Del City, Oklahoma Submit your own pictures of this city and show them to the world
OSM Map
General Map
Google Map
MSN Map
OSM Map
General Map
Google Map
MSN Map
OSM Map
General Map
Google Map
MSN Map
OSM Map
General Map
Google Map
MSN Map
Please wait while loading the map...
Population in 2022: 21,388 (100% urban, 0% rural). Population change since 2000: -3.3%Males: 10,324 Females: 11,064
March 2022 cost of living index in Del City: 84.8 (less than average, U.S. average is 100) Percentage of residents living in poverty in 2022: 20.6%for White Non-Hispanic residents , 32.3% for Black residents , 29.9% for Hispanic or Latino residents , 26.2% for American Indian residents , 8.8% for other race residents , 23.7% for two or more races residents )Business Search - 14 Million verified businesses
Data:
Median household income ($)
Median household income (% change since 2000)
Household income diversity
Ratio of average income to average house value (%)
Ratio of average income to average rent
Median household income ($) - White
Median household income ($) - Black or African American
Median household income ($) - Asian
Median household income ($) - Hispanic or Latino
Median household income ($) - American Indian and Alaska Native
Median household income ($) - Multirace
Median household income ($) - Other Race
Median household income for houses/condos with a mortgage ($)
Median household income for apartments without a mortgage ($)
Races - White alone (%)
Races - White alone (% change since 2000)
Races - Black alone (%)
Races - Black alone (% change since 2000)
Races - American Indian alone (%)
Races - American Indian alone (% change since 2000)
Races - Asian alone (%)
Races - Asian alone (% change since 2000)
Races - Hispanic (%)
Races - Hispanic (% change since 2000)
Races - Native Hawaiian and Other Pacific Islander alone (%)
Races - Native Hawaiian and Other Pacific Islander alone (% change since 2000)
Races - Two or more races (%)
Races - Two or more races (% change since 2000)
Races - Other race alone (%)
Races - Other race alone (% change since 2000)
Racial diversity
Unemployment (%)
Unemployment (% change since 2000)
Unemployment (%) - White
Unemployment (%) - Black or African American
Unemployment (%) - Asian
Unemployment (%) - Hispanic or Latino
Unemployment (%) - American Indian and Alaska Native
Unemployment (%) - Multirace
Unemployment (%) - Other Race
Population density (people per square mile)
Population - Males (%)
Population - Females (%)
Population - Males (%) - White
Population - Males (%) - Black or African American
Population - Males (%) - Asian
Population - Males (%) - Hispanic or Latino
Population - Males (%) - American Indian and Alaska Native
Population - Males (%) - Multirace
Population - Males (%) - Other Race
Population - Females (%) - White
Population - Females (%) - Black or African American
Population - Females (%) - Asian
Population - Females (%) - Hispanic or Latino
Population - Females (%) - American Indian and Alaska Native
Population - Females (%) - Multirace
Population - Females (%) - Other Race
Coronavirus confirmed cases (Apr 26, 2024)
Deaths caused by coronavirus (Apr 26, 2024)
Coronavirus confirmed cases (per 100k population) (Apr 26, 2024)
Deaths caused by coronavirus (per 100k population) (Apr 26, 2024)
Daily increase in number of cases (Apr 26, 2024)
Weekly increase in number of cases (Apr 26, 2024)
Cases doubled (in days) (Apr 26, 2024)
Hospitalized patients (Apr 18, 2022)
Negative test results (Apr 18, 2022)
Total test results (Apr 18, 2022)
COVID Vaccine doses distributed (per 100k population) (Sep 19, 2023)
COVID Vaccine doses administered (per 100k population) (Sep 19, 2023)
COVID Vaccine doses distributed (Sep 19, 2023)
COVID Vaccine doses administered (Sep 19, 2023)
Likely homosexual households (%)
Likely homosexual households (% change since 2000)
Likely homosexual households - Lesbian couples (%)
Likely homosexual households - Lesbian couples (% change since 2000)
Likely homosexual households - Gay men (%)
Likely homosexual households - Gay men (% change since 2000)
Cost of living index
Median gross rent ($)
Median contract rent ($)
Median monthly housing costs ($)
Median house or condo value ($)
Median house or condo value ($ change since 2000)
Mean house or condo value by units in structure - 1, detached ($)
Mean house or condo value by units in structure - 1, attached ($)
Mean house or condo value by units in structure - 2 ($)
Mean house or condo value by units in structure by units in structure - 3 or 4 ($)
Mean house or condo value by units in structure - 5 or more ($)
Mean house or condo value by units in structure - Boat, RV, van, etc. ($)
Mean house or condo value by units in structure - Mobile home ($)
Median house or condo value ($) - White
Median house or condo value ($) - Black or African American
Median house or condo value ($) - Asian
Median house or condo value ($) - Hispanic or Latino
Median house or condo value ($) - American Indian and Alaska Native
Median house or condo value ($) - Multirace
Median house or condo value ($) - Other Race
Median resident age
Resident age diversity
Median resident age - Males
Median resident age - Females
Median resident age - White
Median resident age - Black or African American
Median resident age - Asian
Median resident age - Hispanic or Latino
Median resident age - American Indian and Alaska Native
Median resident age - Multirace
Median resident age - Other Race
Median resident age - Males - White
Median resident age - Males - Black or African American
Median resident age - Males - Asian
Median resident age - Males - Hispanic or Latino
Median resident age - Males - American Indian and Alaska Native
Median resident age - Males - Multirace
Median resident age - Males - Other Race
Median resident age - Females - White
Median resident age - Females - Black or African American
Median resident age - Females - Asian
Median resident age - Females - Hispanic or Latino
Median resident age - Females - American Indian and Alaska Native
Median resident age - Females - Multirace
Median resident age - Females - Other Race
Commute - mean travel time to work (minutes)
Travel time to work - Less than 5 minutes (%)
Travel time to work - Less than 5 minutes (% change since 2000)
Travel time to work - 5 to 9 minutes (%)
Travel time to work - 5 to 9 minutes (% change since 2000)
Travel time to work - 10 to 19 minutes (%)
Travel time to work - 10 to 19 minutes (% change since 2000)
Travel time to work - 20 to 29 minutes (%)
Travel time to work - 20 to 29 minutes (% change since 2000)
Travel time to work - 30 to 39 minutes (%)
Travel time to work - 30 to 39 minutes (% change since 2000)
Travel time to work - 40 to 59 minutes (%)
Travel time to work - 40 to 59 minutes (% change since 2000)
Travel time to work - 60 to 89 minutes (%)
Travel time to work - 60 to 89 minutes (% change since 2000)
Travel time to work - 90 or more minutes (%)
Travel time to work - 90 or more minutes (% change since 2000)
Marital status - Never married (%)
Marital status - Now married (%)
Marital status - Separated (%)
Marital status - Widowed (%)
Marital status - Divorced (%)
Median family income ($)
Median family income (% change since 2000)
Median non-family income ($)
Median non-family income (% change since 2000)
Median per capita income ($)
Median per capita income (% change since 2000)
Median family income ($) - White
Median family income ($) - Black or African American
Median family income ($) - Asian
Median family income ($) - Hispanic or Latino
Median family income ($) - American Indian and Alaska Native
Median family income ($) - Multirace
Median family income ($) - Other Race
Median year house/condo built
Median year apartment built
Year house built - Built 2005 or later (%)
Year house built - Built 2000 to 2004 (%)
Year house built - Built 1990 to 1999 (%)
Year house built - Built 1980 to 1989 (%)
Year house built - Built 1970 to 1979 (%)
Year house built - Built 1960 to 1969 (%)
Year house built - Built 1950 to 1959 (%)
Year house built - Built 1940 to 1949 (%)
Year house built - Built 1939 or earlier (%)
Average household size
Household density (households per square mile)
Average household size - White
Average household size - Black or African American
Average household size - Asian
Average household size - Hispanic or Latino
Average household size - American Indian and Alaska Native
Average household size - Multirace
Average household size - Other Race
Occupied housing units (%)
Vacant housing units (%)
Owner occupied housing units (%)
Renter occupied housing units (%)
Vacancy status - For rent (%)
Vacancy status - For sale only (%)
Vacancy status - Rented or sold, not occupied (%)
Vacancy status - For seasonal, recreational, or occasional use (%)
Vacancy status - For migrant workers (%)
Vacancy status - Other vacant (%)
Residents with income below the poverty level (%)
Residents with income below 50% of the poverty level (%)
Children below poverty level (%)
Poor families by family type - Married-couple family (%)
Poor families by family type - Male, no wife present (%)
Poor families by family type - Female, no husband present (%)
Poverty status for native-born residents (%)
Poverty status for foreign-born residents (%)
Poverty among high school graduates not in families (%)
Poverty among people who did not graduate high school not in families (%)
Residents with income below the poverty level (%) - White
Residents with income below the poverty level (%) - Black or African American
Residents with income below the poverty level (%) - Asian
Residents with income below the poverty level (%) - Hispanic or Latino
Residents with income below the poverty level (%) - American Indian and Alaska Native
Residents with income below the poverty level (%) - Multirace
Residents with income below the poverty level (%) - Other Race
Air pollution - Air Quality Index (AQI)
Air pollution - CO
Air pollution - NO2
Air pollution - SO2
Air pollution - Ozone
Air pollution - PM10
Air pollution - PM25
Air pollution - Pb
Crime - Murders per 100,000 population
Crime - Rapes per 100,000 population
Crime - Robberies per 100,000 population
Crime - Assaults per 100,000 population
Crime - Burglaries per 100,000 population
Crime - Thefts per 100,000 population
Crime - Auto thefts per 100,000 population
Crime - Arson per 100,000 population
Crime - City-data.com crime index
Crime - Violent crime index
Crime - Property crime index
Crime - Murders per 100,000 population (5 year average)
Crime - Rapes per 100,000 population (5 year average)
Crime - Robberies per 100,000 population (5 year average)
Crime - Assaults per 100,000 population (5 year average)
Crime - Burglaries per 100,000 population (5 year average)
Crime - Thefts per 100,000 population (5 year average)
Crime - Auto thefts per 100,000 population (5 year average)
Crime - Arson per 100,000 population (5 year average)
Crime - City-data.com crime index (5 year average)
Crime - Violent crime index (5 year average)
Crime - Property crime index (5 year average)
1996 Presidential Elections Results (%) - Democratic Party (Clinton)
1996 Presidential Elections Results (%) - Republican Party (Dole)
1996 Presidential Elections Results (%) - Other
2000 Presidential Elections Results (%) - Democratic Party (Gore)
2000 Presidential Elections Results (%) - Republican Party (Bush)
2000 Presidential Elections Results (%) - Other
2004 Presidential Elections Results (%) - Democratic Party (Kerry)
2004 Presidential Elections Results (%) - Republican Party (Bush)
2004 Presidential Elections Results (%) - Other
2008 Presidential Elections Results (%) - Democratic Party (Obama)
2008 Presidential Elections Results (%) - Republican Party (McCain)
2008 Presidential Elections Results (%) - Other
2012 Presidential Elections Results (%) - Democratic Party (Obama)
2012 Presidential Elections Results (%) - Republican Party (Romney)
2012 Presidential Elections Results (%) - Other
2016 Presidential Elections Results (%) - Democratic Party (Clinton)
2016 Presidential Elections Results (%) - Republican Party (Trump)
2016 Presidential Elections Results (%) - Other
2020 Presidential Elections Results (%) - Democratic Party (Biden)
2020 Presidential Elections Results (%) - Republican Party (Trump)
2020 Presidential Elections Results (%) - Other
Ancestries Reported - Arab (%)
Ancestries Reported - Czech (%)
Ancestries Reported - Danish (%)
Ancestries Reported - Dutch (%)
Ancestries Reported - English (%)
Ancestries Reported - French (%)
Ancestries Reported - French Canadian (%)
Ancestries Reported - German (%)
Ancestries Reported - Greek (%)
Ancestries Reported - Hungarian (%)
Ancestries Reported - Irish (%)
Ancestries Reported - Italian (%)
Ancestries Reported - Lithuanian (%)
Ancestries Reported - Norwegian (%)
Ancestries Reported - Polish (%)
Ancestries Reported - Portuguese (%)
Ancestries Reported - Russian (%)
Ancestries Reported - Scotch-Irish (%)
Ancestries Reported - Scottish (%)
Ancestries Reported - Slovak (%)
Ancestries Reported - Subsaharan African (%)
Ancestries Reported - Swedish (%)
Ancestries Reported - Swiss (%)
Ancestries Reported - Ukrainian (%)
Ancestries Reported - United States (%)
Ancestries Reported - Welsh (%)
Ancestries Reported - West Indian (%)
Ancestries Reported - Other (%)
Educational Attainment - No schooling completed (%)
Educational Attainment - Less than high school (%)
Educational Attainment - High school or equivalent (%)
Educational Attainment - Less than 1 year of college (%)
Educational Attainment - 1 or more years of college (%)
Educational Attainment - Associate degree (%)
Educational Attainment - Bachelor's degree (%)
Educational Attainment - Master's degree (%)
Educational Attainment - Professional school degree (%)
Educational Attainment - Doctorate degree (%)
School Enrollment - Nursery, preschool (%)
School Enrollment - Kindergarten (%)
School Enrollment - Grade 1 to 4 (%)
School Enrollment - Grade 5 to 8 (%)
School Enrollment - Grade 9 to 12 (%)
School Enrollment - College undergrad (%)
School Enrollment - Graduate or professional (%)
School Enrollment - Not enrolled in school (%)
School enrollment - Public schools (%)
School enrollment - Private schools (%)
School enrollment - Not enrolled (%)
Median number of rooms in houses and condos
Median number of rooms in apartments
Housing units lacking complete plumbing facilities (%)
Housing units lacking complete kitchen facilities (%)
Density of houses
Urban houses (%)
Rural houses (%)
Households with people 60 years and over (%)
Households with people 65 years and over (%)
Households with people 75 years and over (%)
Households with one or more nonrelatives (%)
Households with no nonrelatives (%)
Population in households (%)
Family households (%)
Nonfamily households (%)
Population in families (%)
Family households with own children (%)
Median number of bedrooms in owner occupied houses
Mean number of bedrooms in owner occupied houses
Median number of bedrooms in renter occupied houses
Mean number of bedrooms in renter occupied houses
Median number of vehichles in owner occupied houses
Mean number of vehichles in owner occupied houses
Median number of vehichles in renter occupied houses
Mean number of vehichles in renter occupied houses
Mortgage status - with mortgage (%)
Mortgage status - with second mortgage (%)
Mortgage status - with home equity loan (%)
Mortgage status - with both second mortgage and home equity loan (%)
Mortgage status - without a mortgage (%)
Average family size
Average family size - White
Average family size - Black or African American
Average family size - Asian
Average family size - Hispanic or Latino
Average family size - American Indian and Alaska Native
Average family size - Multirace
Average family size - Other Race
Geographical mobility - Same house 1 year ago (%)
Geographical mobility - Moved within same county (%)
Geographical mobility - Moved from different county within same state (%)
Geographical mobility - Moved from different state (%)
Geographical mobility - Moved from abroad (%)
Place of birth - Born in state of residence (%)
Place of birth - Born in other state (%)
Place of birth - Native, outside of US (%)
Place of birth - Foreign born (%)
Housing units in structures - 1, detached (%)
Housing units in structures - 1, attached (%)
Housing units in structures - 2 (%)
Housing units in structures - 3 or 4 (%)
Housing units in structures - 5 to 9 (%)
Housing units in structures - 10 to 19 (%)
Housing units in structures - 20 to 49 (%)
Housing units in structures - 50 or more (%)
Housing units in structures - Mobile home (%)
Housing units in structures - Boat, RV, van, etc. (%)
House/condo owner moved in on average (years ago)
Renter moved in on average (years ago)
Year householder moved into unit - Moved in 1999 to March 2000 (%)
Year householder moved into unit - Moved in 1995 to 1998 (%)
Year householder moved into unit - Moved in 1990 to 1994 (%)
Year householder moved into unit - Moved in 1980 to 1989 (%)
Year householder moved into unit - Moved in 1970 to 1979 (%)
Year householder moved into unit - Moved in 1969 or earlier (%)
Means of transportation to work - Drove car alone (%)
Means of transportation to work - Carpooled (%)
Means of transportation to work - Public transportation (%)
Means of transportation to work - Bus or trolley bus (%)
Means of transportation to work - Streetcar or trolley car (%)
Means of transportation to work - Subway or elevated (%)
Means of transportation to work - Railroad (%)
Means of transportation to work - Ferryboat (%)
Means of transportation to work - Taxicab (%)
Means of transportation to work - Motorcycle (%)
Means of transportation to work - Bicycle (%)
Means of transportation to work - Walked (%)
Means of transportation to work - Other means (%)
Working at home (%)
Industry diversity
Most Common Industries - Agriculture, forestry, fishing and hunting, and mining (%)
Most Common Industries - Agriculture, forestry, fishing and hunting (%)
Most Common Industries - Mining, quarrying, and oil and gas extraction (%)
Most Common Industries - Construction (%)
Most Common Industries - Manufacturing (%)
Most Common Industries - Wholesale trade (%)
Most Common Industries - Retail trade (%)
Most Common Industries - Transportation and warehousing, and utilities (%)
Most Common Industries - Transportation and warehousing (%)
Most Common Industries - Utilities (%)
Most Common Industries - Information (%)
Most Common Industries - Finance and insurance, and real estate and rental and leasing (%)
Most Common Industries - Finance and insurance (%)
Most Common Industries - Real estate and rental and leasing (%)
Most Common Industries - Professional, scientific, and management, and administrative and waste management services (%)
Most Common Industries - Professional, scientific, and technical services (%)
Most Common Industries - Management of companies and enterprises (%)
Most Common Industries - Administrative and support and waste management services (%)
Most Common Industries - Educational services, and health care and social assistance (%)
Most Common Industries - Educational services (%)
Most Common Industries - Health care and social assistance (%)
Most Common Industries - Arts, entertainment, and recreation, and accommodation and food services (%)
Most Common Industries - Arts, entertainment, and recreation (%)
Most Common Industries - Accommodation and food services (%)
Most Common Industries - Other services, except public administration (%)
Most Common Industries - Public administration (%)
Occupation diversity
Most Common Occupations - Management, business, science, and arts occupations (%)
Most Common Occupations - Management, business, and financial occupations (%)
Most Common Occupations - Management occupations (%)
Most Common Occupations - Business and financial operations occupations (%)
Most Common Occupations - Computer, engineering, and science occupations (%)
Most Common Occupations - Computer and mathematical occupations (%)
Most Common Occupations - Architecture and engineering occupations (%)
Most Common Occupations - Life, physical, and social science occupations (%)
Most Common Occupations - Education, legal, community service, arts, and media occupations (%)
Most Common Occupations - Community and social service occupations (%)
Most Common Occupations - Legal occupations (%)
Most Common Occupations - Education, training, and library occupations (%)
Most Common Occupations - Arts, design, entertainment, sports, and media occupations (%)
Most Common Occupations - Healthcare practitioners and technical occupations (%)
Most Common Occupations - Health diagnosing and treating practitioners and other technical occupations (%)
Most Common Occupations - Health technologists and technicians (%)
Most Common Occupations - Service occupations (%)
Most Common Occupations - Healthcare support occupations (%)
Most Common Occupations - Protective service occupations (%)
Most Common Occupations - Fire fighting and prevention, and other protective service workers including supervisors (%)
Most Common Occupations - Law enforcement workers including supervisors (%)
Most Common Occupations - Food preparation and serving related occupations (%)
Most Common Occupations - Building and grounds cleaning and maintenance occupations (%)
Most Common Occupations - Personal care and service occupations (%)
Most Common Occupations - Sales and office occupations (%)
Most Common Occupations - Sales and related occupations (%)
Most Common Occupations - Office and administrative support occupations (%)
Most Common Occupations - Natural resources, construction, and maintenance occupations (%)
Most Common Occupations - Farming, fishing, and forestry occupations (%)
Most Common Occupations - Construction and extraction occupations (%)
Most Common Occupations - Installation, maintenance, and repair occupations (%)
Most Common Occupations - Production, transportation, and material moving occupations (%)
Most Common Occupations - Production occupations (%)
Most Common Occupations - Transportation occupations (%)
Most Common Occupations - Material moving occupations (%)
People in Group quarters - Institutionalized population (%)
People in Group quarters - Correctional institutions (%)
People in Group quarters - Federal prisons and detention centers (%)
People in Group quarters - Halfway houses (%)
People in Group quarters - Local jails and other confinement facilities (including police lockups) (%)
People in Group quarters - Military disciplinary barracks (%)
People in Group quarters - State prisons (%)
People in Group quarters - Other types of correctional institutions (%)
People in Group quarters - Nursing homes (%)
People in Group quarters - Hospitals/wards, hospices, and schools for the handicapped (%)
People in Group quarters - Hospitals/wards and hospices for chronically ill (%)
People in Group quarters - Hospices or homes for chronically ill (%)
People in Group quarters - Military hospitals or wards for chronically ill (%)
People in Group quarters - Other hospitals or wards for chronically ill (%)
People in Group quarters - Hospitals or wards for drug/alcohol abuse (%)
People in Group quarters - Mental (Psychiatric) hospitals or wards (%)
People in Group quarters - Schools, hospitals, or wards for the mentally retarded (%)
People in Group quarters - Schools, hospitals, or wards for the physically handicapped (%)
People in Group quarters - Institutions for the deaf (%)
People in Group quarters - Institutions for the blind (%)
People in Group quarters - Orthopedic wards and institutions for the physically handicapped (%)
People in Group quarters - Wards in general hospitals for patients who have no usual home elsewhere (%)
People in Group quarters - Wards in military hospitals for patients who have no usual home elsewhere (%)
People in Group quarters - Juvenile institutions (%)
People in Group quarters - Long-term care (%)
People in Group quarters - Homes for abused, dependent, and neglected children (%)
People in Group quarters - Residential treatment centers for emotionally disturbed children (%)
People in Group quarters - Training schools for juvenile delinquents (%)
People in Group quarters - Short-term care, detention or diagnostic centers for delinquent children (%)
People in Group quarters - Type of juvenile institution unknown (%)
People in Group quarters - Noninstitutionalized population (%)
People in Group quarters - College dormitories (includes college quarters off campus) (%)
People in Group quarters - Military quarters (%)
People in Group quarters - On base (%)
People in Group quarters - Barracks, unaccompanied personnel housing (UPH), (Enlisted/Officer), ;and similar group living quarters for military personnel (%)
People in Group quarters - Transient quarters for temporary residents (%)
People in Group quarters - Military ships (%)
People in Group quarters - Group homes (%)
People in Group quarters - Homes or halfway houses for drug/alcohol abuse (%)
People in Group quarters - Homes for the mentally ill (%)
People in Group quarters - Homes for the mentally retarded (%)
People in Group quarters - Homes for the physically handicapped (%)
People in Group quarters - Other group homes (%)
People in Group quarters - Religious group quarters (%)
People in Group quarters - Dormitories (%)
People in Group quarters - Agriculture workers' dormitories on farms (%)
People in Group quarters - Job Corps and vocational training facilities (%)
People in Group quarters - Other workers' dormitories (%)
People in Group quarters - Crews of maritime vessels (%)
People in Group quarters - Other nonhousehold living situations (%)
People in Group quarters - Other noninstitutional group quarters (%)
Residents speaking English at home (%)
Residents speaking English at home - Born in the United States (%)
Residents speaking English at home - Native, born elsewhere (%)
Residents speaking English at home - Foreign born (%)
Residents speaking Spanish at home (%)
Residents speaking Spanish at home - Born in the United States (%)
Residents speaking Spanish at home - Native, born elsewhere (%)
Residents speaking Spanish at home - Foreign born (%)
Residents speaking other language at home (%)
Residents speaking other language at home - Born in the United States (%)
Residents speaking other language at home - Native, born elsewhere (%)
Residents speaking other language at home - Foreign born (%)
Class of Workers - Employee of private company (%)
Class of Workers - Self-employed in own incorporated business (%)
Class of Workers - Private not-for-profit wage and salary workers (%)
Class of Workers - Local government workers (%)
Class of Workers - State government workers (%)
Class of Workers - Federal government workers (%)
Class of Workers - Self-employed workers in own not incorporated business and Unpaid family workers (%)
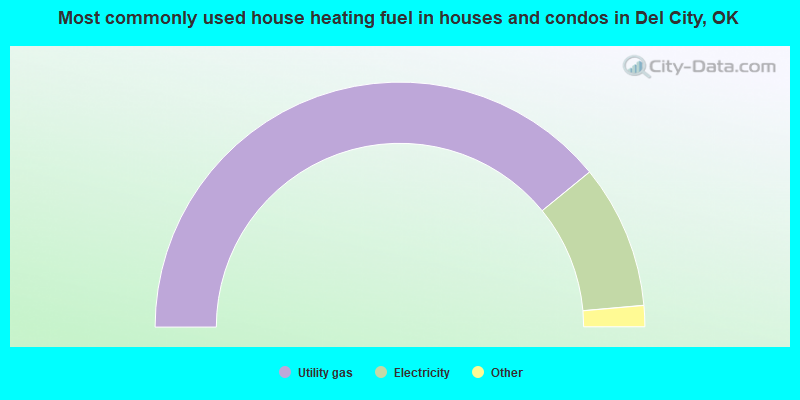
House heating fuel used in houses and condos - Utility gas (%)
House heating fuel used in houses and condos - Bottled, tank, or LP gas (%)
House heating fuel used in houses and condos - Electricity (%)
House heating fuel used in houses and condos - Fuel oil, kerosene, etc. (%)
House heating fuel used in houses and condos - Coal or coke (%)
House heating fuel used in houses and condos - Wood (%)
House heating fuel used in houses and condos - Solar energy (%)
House heating fuel used in houses and condos - Other fuel (%)
House heating fuel used in houses and condos - No fuel used (%)
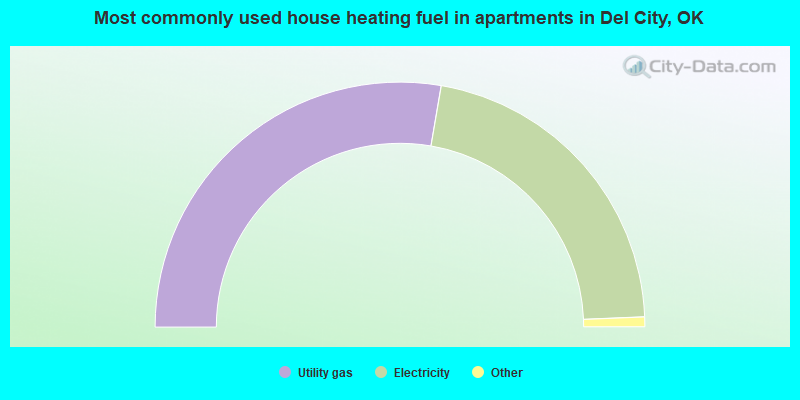
House heating fuel used in apartments - Utility gas (%)
House heating fuel used in apartments - Bottled, tank, or LP gas (%)
House heating fuel used in apartments - Electricity (%)
House heating fuel used in apartments - Fuel oil, kerosene, etc. (%)
House heating fuel used in apartments - Coal or coke (%)
House heating fuel used in apartments - Wood (%)
House heating fuel used in apartments - Solar energy (%)
House heating fuel used in apartments - Other fuel (%)
House heating fuel used in apartments - No fuel used (%)
Armed forces status - In Armed Forces (%)
Armed forces status - Civilian (%)
Armed forces status - Civilian - Veteran (%)
Armed forces status - Civilian - Nonveteran (%)
Fatal accidents locations in years 2005-2021
Fatal accidents locations in 2005
Fatal accidents locations in 2006
Fatal accidents locations in 2007
Fatal accidents locations in 2008
Fatal accidents locations in 2009
Fatal accidents locations in 2010
Fatal accidents locations in 2011
Fatal accidents locations in 2012
Fatal accidents locations in 2013
Fatal accidents locations in 2014
Fatal accidents locations in 2015
Fatal accidents locations in 2016
Fatal accidents locations in 2017
Fatal accidents locations in 2018
Fatal accidents locations in 2019
Fatal accidents locations in 2020
Fatal accidents locations in 2021
Alcohol use - People drinking some alcohol every month (%)
Alcohol use - People not drinking at all (%)
Alcohol use - Average days/month drinking alcohol
Alcohol use - Average drinks/week
Alcohol use - Average days/year people drink much
Audiometry - Average condition of hearing (%)
Audiometry - People that can hear a whisper from across a quiet room (%)
Audiometry - People that can hear normal voice from across a quiet room (%)
Audiometry - Ears ringing, roaring, buzzing (%)
Audiometry - Had a job exposure to loud noise (%)
Audiometry - Had off-work exposure to loud noise (%)
Blood Pressure & Cholesterol - Has high blood pressure (%)
Blood Pressure & Cholesterol - Checking blood pressure at home (%)
Blood Pressure & Cholesterol - Frequently checking blood cholesterol (%)
Blood Pressure & Cholesterol - Has high cholesterol level (%)
Consumer Behavior - Money monthly spent on food at supermarket/grocery store
Consumer Behavior - Money monthly spent on food at other stores
Consumer Behavior - Money monthly spent on eating out
Consumer Behavior - Money monthly spent on carryout/delivered foods
Consumer Behavior - Income spent on food at supermarket/grocery store (%)
Consumer Behavior - Income spent on food at other stores (%)
Consumer Behavior - Income spent on eating out (%)
Consumer Behavior - Income spent on carryout/delivered foods (%)
Current Health Status - General health condition (%)
Current Health Status - Blood donors (%)
Current Health Status - Has blood ever tested for HIV virus (%)
Current Health Status - Left-handed people (%)
Dermatology - People using sunscreen (%)
Diabetes - Diabetics (%)
Diabetes - Had a blood test for high blood sugar (%)
Diabetes - People taking insulin (%)
Diet Behavior & Nutrition - Diet health (%)
Diet Behavior & Nutrition - Milk product consumption (# of products/month)
Diet Behavior & Nutrition - Meals not home prepared (#/week)
Diet Behavior & Nutrition - Meals from fast food or pizza place (#/week)
Diet Behavior & Nutrition - Ready-to-eat foods (#/month)
Diet Behavior & Nutrition - Frozen meals/pizza (#/month)
Drug Use - People that ever used marijuana or hashish (%)
Drug Use - Ever used hard drugs (%)
Drug Use - Ever used any form of cocaine (%)
Drug Use - Ever used heroin (%)
Drug Use - Ever used methamphetamine (%)
Health Insurance - People covered by health insurance (%)
Kidney Conditions-Urology - Avg. # of times urinating at night
Medical Conditions - People with asthma (%)
Medical Conditions - People with anemia (%)
Medical Conditions - People with psoriasis (%)
Medical Conditions - People with overweight (%)
Medical Conditions - Elderly people having difficulties in thinking or remembering (%)
Medical Conditions - People who ever received blood transfusion (%)
Medical Conditions - People having trouble seeing even with glass/contacts (%)
Medical Conditions - People with arthritis (%)
Medical Conditions - People with gout (%)
Medical Conditions - People with congestive heart failure (%)
Medical Conditions - People with coronary heart disease (%)
Medical Conditions - People with angina pectoris (%)
Medical Conditions - People who ever had heart attack (%)
Medical Conditions - People who ever had stroke (%)
Medical Conditions - People with emphysema (%)
Medical Conditions - People with thyroid problem (%)
Medical Conditions - People with chronic bronchitis (%)
Medical Conditions - People with any liver condition (%)
Medical Conditions - People who ever had cancer or malignancy (%)
Mental Health - People who have little interest in doing things (%)
Mental Health - People feeling down, depressed, or hopeless (%)
Mental Health - People who have trouble sleeping or sleeping too much (%)
Mental Health - People feeling tired or having little energy (%)
Mental Health - People with poor appetite or overeating (%)
Mental Health - People feeling bad about themself (%)
Mental Health - People who have trouble concentrating on things (%)
Mental Health - People moving or speaking slowly or too fast (%)
Mental Health - People having thoughts they would be better off dead (%)
Oral Health - Average years since last visit a dentist
Oral Health - People embarrassed because of mouth (%)
Oral Health - People with gum disease (%)
Oral Health - General health of teeth and gums (%)
Oral Health - Average days a week using dental floss/device
Oral Health - Average days a week using mouthwash for dental problem
Oral Health - Average number of teeth
Pesticide Use - Households using pesticides to control insects (%)
Pesticide Use - Households using pesticides to kill weeds (%)
Physical Activity - People doing vigorous-intensity work activities (%)
Physical Activity - People doing moderate-intensity work activities (%)
Physical Activity - People walking or bicycling (%)
Physical Activity - People doing vigorous-intensity recreational activities (%)
Physical Activity - People doing moderate-intensity recreational activities (%)
Physical Activity - Average hours a day doing sedentary activities
Physical Activity - Average hours a day watching TV or videos
Physical Activity - Average hours a day using computer
Physical Functioning - People having limitations keeping them from working (%)
Physical Functioning - People limited in amount of work they can do (%)
Physical Functioning - People that need special equipment to walk (%)
Physical Functioning - People experiencing confusion/memory problems (%)
Physical Functioning - People requiring special healthcare equipment (%)
Prescription Medications - Average number of prescription medicines taking
Preventive Aspirin Use - Adults 40+ taking low-dose aspirin (%)
Reproductive Health - Vaginal deliveries (%)
Reproductive Health - Cesarean deliveries (%)
Reproductive Health - Deliveries resulted in a live birth (%)
Reproductive Health - Pregnancies resulted in a delivery (%)
Reproductive Health - Women breastfeeding newborns (%)
Reproductive Health - Women that had a hysterectomy (%)
Reproductive Health - Women that had both ovaries removed (%)
Reproductive Health - Women that have ever taken birth control pills (%)
Reproductive Health - Women taking birth control pills (%)
Reproductive Health - Women that have ever used Depo-Provera or injectables (%)
Reproductive Health - Women that have ever used female hormones (%)
Sexual Behavior - People 18+ that ever had sex (vaginal, anal, or oral) (%)
Sexual Behavior - Males 18+ that ever had vaginal sex with a woman (%)
Sexual Behavior - Males 18+ that ever performed oral sex on a woman (%)
Sexual Behavior - Males 18+ that ever had anal sex with a woman (%)
Sexual Behavior - Males 18+ that ever had any sex with a man (%)
Sexual Behavior - Females 18+ that ever had vaginal sex with a man (%)
Sexual Behavior - Females 18+ that ever performed oral sex on a man (%)
Sexual Behavior - Females 18+ that ever had anal sex with a man (%)
Sexual Behavior - Females 18+ that ever had any kind of sex with a woman (%)
Sexual Behavior - Average age people first had sex
Sexual Behavior - Average number of female sex partners in lifetime (males 18+)
Sexual Behavior - Average number of female vaginal sex partners in lifetime (males 18+)
Sexual Behavior - Average age people first performed oral sex on a woman (18+)
Sexual Behavior - Average number of woman performed oral sex on in lifetime (18+)
Sexual Behavior - Average number of male sex partners in lifetime (males 18+)
Sexual Behavior - Average number of male anal sex partners in lifetime (males 18+)
Sexual Behavior - Average age people first performed oral sex on a man (18+)
Sexual Behavior - Average number of male oral sex partners in lifetime (18+)
Sexual Behavior - People using protection when performing oral sex (%)
Sexual Behavior - Average number of times people have vaginal or anal sex a year
Sexual Behavior - People having sex without condom (%)
Sexual Behavior - Average number of male sex partners in lifetime (females 18+)
Sexual Behavior - Average number of male vaginal sex partners in lifetime (females 18+)
Sexual Behavior - Average number of female sex partners in lifetime (females 18+)
Sexual Behavior - Circumcised males 18+ (%)
Sleep Disorders - Average hours sleeping at night
Sleep Disorders - People that has trouble sleeping (%)
Smoking-Cigarette Use - People smoking cigarettes (%)
Taste & Smell - People 40+ having problems with smell (%)
Taste & Smell - People 40+ having problems with taste (%)
Taste & Smell - People 40+ that ever had wisdom teeth removed (%)
Taste & Smell - People 40+ that ever had tonsils teeth removed (%)
Taste & Smell - People 40+ that ever had a loss of consciousness because of a head injury (%)
Taste & Smell - People 40+ that ever had a broken nose or other serious injury to face or skull (%)
Taste & Smell - People 40+ that ever had two or more sinus infections (%)
Weight - Average height (inches)
Weight - Average weight (pounds)
Weight - Average BMI
Weight - People that are obese (%)
Weight - People that ever were obese (%)
Weight - People trying to lose weight (%)
According to our research of Oklahoma and other state lists, there were 11 registered sex offenders living in Del City, Oklahoma as of April 26, 2024 . The ratio of all residents to sex offenders in Del City is 2,044 to 1.The ratio of registered sex offenders to all residents in this city is much lower than the state average.
Officers per 1,000 residents here:
1.75Oklahoma average:
2.27
Latest news from Del City, OK collected exclusively by city-data.com from local newspapers, TV, and radio stations
Del City, OK City Guides: Ancestries: American (9.5%), English (4.5%), Irish (3.6%), German (3.5%), Italian (1.9%), European (1.7%).
Current Local Time:
Land area: 7.54 square miles.
Population density: 2,838 people per square mile (average).
884 residents are foreign born (2.3% Latin America , 1.5% Asia ).
This city:
4.0%Oklahoma:
6.1%
Median real estate property taxes paid for housing units with mortgages in 2022: $1,345 (1.1%)Median real estate property taxes paid for housing units with no mortgage in 2022: $973 (0.9%)
Nearest city with pop. 50,000+: Midwest City, OK
Nearest city with pop. 200,000+: Oklahoma City, OK
Nearest city with pop. 1,000,000+: Dallas, TX
Nearest cities:
Smith Village, OK (1.0 miles),
Lake Aluma, OK (2.5 miles),
Latitude: 35.44 N, Longitude: 97.44 W
Daytime population change due to commuting: -2,610 (-11.9%)Workers who live and work in this city: 1,529 (15.9%)
Area code commonly used in this area: 405
Property values in Del City, OK
Single-family new house construction building permits:
2022: 8 buildings , average cost: $186,1002021: 7 buildings , average cost: $190,0002020: 3 buildings , average cost: $113,3002019: 5 buildings , average cost: $139,4002018: 11 buildings , average cost: $93,6002017: 24 buildings , average cost: $142,5002016: 24 buildings , average cost: $75,0002015: 1 building , cost: $200,0002014: 7 buildings , average cost: $138,1002013: 7 buildings , average cost: $101,7002012: 3 buildings , average cost: $145,0002011: 11 buildings , average cost: $106,6002010: 21 buildings , average cost: $122,4002009: 20 buildings , average cost: $123,4002008: 29 buildings , average cost: $120,6002007: 35 buildings , average cost: $139,4002006: 40 buildings , average cost: $118,6002005: 32 buildings , average cost: $90,0002004: 46 buildings , average cost: $72,7002003: 67 buildings , average cost: $82,4002002: 52 buildings , average cost: $106,1002001: 35 buildings , average cost: $100,5002000: 35 buildings , average cost: $114,6001999: 137 buildings , average cost: $105,6001998: 6 buildings , average cost: $121,7001997: 2 buildings , average cost: $90,000Unemployment in December 2023:
Most common occupations in Del City, OK (%)
Both Males Females
Other production occupations, including supervisors (4.9%)
Other office and administrative support workers, including supervisors (4.4%)
Electrical equipment mechanics and other installation, maintenance, and repair workers, including supervisors (3.8%)
Building and grounds cleaning and maintenance occupations (3.8%)
Retail sales workers, except cashiers (3.7%)
Driver/sales workers and truck drivers (3.7%)
Vehicle and mobile equipment mechanics, installers, and repairers (3.5%)
Electrical equipment mechanics and other installation, maintenance, and repair workers, including supervisors (6.7%)
Other production occupations, including supervisors (6.6%)
Driver/sales workers and truck drivers (6.4%)
Vehicle and mobile equipment mechanics, installers, and repairers (5.9%)
Laborers and material movers, hand (4.7%)
Building and grounds cleaning and maintenance occupations (4.7%)
Material recording, scheduling, dispatching, and distributing workers (4.4%)
Other office and administrative support workers, including supervisors (7.9%)
Secretaries and administrative assistants (5.5%)
Cashiers (5.2%)
Information and record clerks, except customer service representatives (4.9%)
Other sales and related occupations, including supervisors (4.1%)
Customer service representatives (3.9%)
Financial clerks, except bookkeeping, accounting and auditing clerks (3.3%)
Tornado activity:
Del City-area historical tornado activity is slightly above Oklahoma state average. It is 254% greater than the overall U.S. average.
On 5/3/1999, a category F5 (max. wind speeds 261-318 mph) tornado 0.8 miles away from the Del City city center killed 36 people and injured 583 people and caused $1000 million in damages.
On 5/1/1954, a category F4 (max. wind speeds 207-260 mph) tornado 5.0 miles away from the city center injured 65 people and caused between $500,000 and $5,000,000 in damages.
Earthquake activity:
Del City-area historical earthquake activity is significantly above Oklahoma state average. It is 834% greater than the overall U.S. average. On 11/6/2011 at 03:53:10, a magnitude 5.7 (5.7 MW, Depth: 3.2 mi, Class: Moderate, Intensity: VI - VII) earthquake occurred 38.6 miles away from the city center On 9/3/2016 at 12:02:44, a magnitude 5.8 (5.8 MW, Depth: 3.5 mi) earthquake occurred 73.8 miles away from the city center On 11/7/2016 at 01:44:24, a magnitude 5.0 (5.0 MW, Depth: 2.8 mi) earthquake occurred 52.2 miles away from the city center On 2/13/2016 at 17:07:06, a magnitude 5.1 (5.1 MW, Depth: 5.2 mi) earthquake occurred 101.4 miles away from the city center On 11/8/2011 at 02:46:57, a magnitude 4.8 (4.8 MW, Depth: 3.1 mi, Class: Light, Intensity: IV - V) earthquake occurred 37.3 miles away from Del City center On 11/5/2011 at 07:12:45, a magnitude 4.8 (4.8 MW, Depth: 1.9 mi) earthquake occurred 38.8 miles away from the city center Magnitude types: moment magnitude (MW) Natural disasters: The number of natural disasters in Oklahoma County (43) is a lot greater than the US average (15).Major Disasters (Presidential) Declared: 26Emergencies Declared: 6Storms: 18, Floods: 15, Fires: 12, Tornadoes: 12, Winter Storms: 8, Winds: 3, Explosion: 1, Hurricane: 1, Ice Storm: 1, Snow: 1, Other: 1 (Note: some incidents may be assigned to more than one category). Hospitals and medical centers in Del City: RELIANT LIVING CENTER OF DEL CITY (3317 SE 18TH STREET) ALLWOOD HOME HEALTH, LLC (2836 LINDA LANE)
GRACE LIVING CENTER-DEL CITY (400 SOUTH SCOTT STREET)
Amtrak stations near Del City: 5 miles: OKLAHOMA CITY (100 SOUTH E. K. GAYLORD BLVD.) 16 miles: NORMAN (200 S. JONES AVE.) Colleges/universities with over 2000 students nearest to Del City:
Rose State College (about 2 miles; Midwest City, OK ; Full-time enrollment: 4,896)
University of Oklahoma-Health Sciences Center (about 5 miles; Oklahoma City, OK ; FT enrollment: 2,507)
Oklahoma City University (about 7 miles; Oklahoma City, OK ; FT enrollment: 2,547)
Oklahoma City Community College (about 9 miles; Oklahoma City, OK ; FT enrollment: 8,904)
Oklahoma State University-Oklahoma City (about 9 miles; Oklahoma City, OK ; FT enrollment: 4,784)
Mid-America Christian University (about 11 miles; Oklahoma City, OK ; FT enrollment: 2,869)
Oklahoma Christian University (about 12 miles; Edmond, OK ; FT enrollment: 2,173)
Public high school in Del City: DEL CITY HS Students: 1,460, Location: 1900 S SUNNYLANE ROAD, Grades: 9-12)Private high schools in Del City: CHRISTIAN HERITAGE ACADEMY Students: 636, Location: 4400 SE 27TH ST, Grades: PK-12)
DESTINY CHRISTIAN SCHOOL Students: 482, Location: 3801 SE 29TH ST, Grades: PK-12)
Public elementary/middle schools in Del City: KERR MS Students: 615, Location: 2300 LINDA LANE, Grades: 6-8)EPPERLY HEIGHTS ES Students: 614, Location: 3805 DEL ROAD, Grades: PK-5)TOWNSEND ES Students: 446, Location: 4000 EPPERLY DRIVE, Grades: PK-5)DEL CITY ES Students: 421, Location: 2400 EPPERLY DRIVE, Grades: PK-5)DEL CREST MS Location: 4731 JUDY DRIVE, Grades: 6-8)
See full list of schools located in Del City
Notable locations in Del City: (A) , Sooner Market Place (B) , Midwest Regional Emergency Medical Services Station 32 (C) , Del City Fire Department Station 1 (D) , Del City Fire Department Station 2 (E) . Display/hide their locations on the map
Shopping Centers: (1) , Hartsdell Shopping Center (2) , Newey Shopping Center (3) , Oakcliff Shopping Center (4) , The Village Shopping Center (5) . Display/hide their locations on the map
Churches in Del City include: (A) , Sunnylane Southern Baptist Church (B) , Sunnylane Free Will Baptist Church (C) , Saint Paul Catholic Church (D) , Sooner Road Church of God (E) , Reorganized Church of Jesus Christ of Latter Day Saints (F) , Praise Assembly Ministries Center (G) , New Testament Christian Church (H) , Mid-Del Christian Church (I) . Display/hide their locations on the map
Cemetery: (1) . Display/hide its location on the map
Lake: (A) . Display/hide its location on the map
Parks in Del City include: (1) , Lions Park (2) . Display/hide their locations on the map
Oklahoma County has a predicted average indoor radon screening level less than 2 pCi/L (pico curies per liter) - Low Potential Drinking water stations with addresses in Del City and their reported violations in the past:
DEL CITY (Address: 4605 S.E. 44th Population served: 22,128, Surface water):
Past monitoring violations:
One minor monitoring violation
Average household size: This city:
2.5 peopleOklahoma:
2.5 people
Percentage of family households: This city:
63.9%Whole state:
66.8%
Percentage of households with unmarried partners: This city:
7.2%Whole state:
5.9%
Likely homosexual households (counted as self-reported same-sex unmarried-partner households)
Lesbian couples: 0.4% of all households Gay men: 0.2% of all households
People in group quarters in Del City in 2010:
59 people in nursing facilities/skilled-nursing facilities
16 people in group homes intended for adults
2 people in local jails and other municipal confinement facilities
people in nursing homes in 2000Banks with branches in Del City (2011 data):
BOKF, National Association: Del City Branch at 4324 Southeast 44th Street, branch established on 1985/06/30; Del City Branch at 4129 S. E. 29th Street, branch established on 2004/02/03. Info updated 2012/02/28: Bank assets: $25,360.0 mil, Deposits: $19,171.3 mil, headquarters in Tulsa, OK, positive income , Commercial Lending Specialization, 189 total offices , Holding Company: Bok Financial Corporation
The City National Bank and Trust Company of Lawton, Oklahoma: Del City Branch at 5401 Tinker Diagonal Street, branch established on 2006/05/17. Info updated 2006/11/03: Bank assets: $287.7 mil, Deposits: $245.8 mil, headquarters in Lawton, OK, positive income , Commercial Lending Specialization, 36 total offices , Holding Company: Jrmb Ii, Inc
BancFirst: Del City Branch at 4200 South Sunnylane Road, branch established on 1984/01/16. Info updated 2012/02/24: Bank assets: $5,407.8 mil, Deposits: $4,893.4 mil, headquarters in Oklahoma City, OK, positive income , Commercial Lending Specialization, 101 total offices , Holding Company: Bancfirst Corporation
First National Bank: Del City Branch at 4330 S.E. 29th Street, branch established on 1973/08/13. Info updated 2006/11/03: Bank assets: $432.0 mil, Deposits: $371.1 mil, headquarters in Midwest City, OK, positive income , 8 total offices , Holding Company: First Midwest Acquisition Corporation
Arvest Bank: Del City Branch at 4600 Southeast 29th Street, branch established on 1984/05/11. Info updated 2010/11/29: Bank assets: $12,520.8 mil, Deposits: $10,446.2 mil, headquarters in Fayetteville, AR, positive income , Commercial Lending Specialization, 241 total offices , Holding Company: Arvest Bank Group, Inc.
For population 15 years and over in Del City:
Never married: 35.7%Now married: 42.0%Separated: 1.6%Widowed: 6.3%Divorced: 14.4% For population 25 years and over in Del City:
High school or higher: 89.4%Bachelor's degree or higher: 14.8%Graduate or professional degree: 2.8%Unemployed: 6.1%Mean travel time to work (commute): 19.3 minutes
Education Gini index (Inequality in education) Here:
9.2Oklahoma average:
11.3
Religion statistics for Del City, OK (based on Oklahoma County data)
Religion Adherents Congregations Evangelical Protestant 325,241 609 Mainline Protestant 83,693 122 Catholic 61,318 27 Other 26,587 73 Black Protestant 22,346 64 Orthodox 1,807 10 None 197,641 -
Source: Clifford Grammich, Kirk Hadaway, Richard Houseal, Dale E.Jones, Alexei Krindatch, Richie Stanley and Richard H.Taylor. 2012. 2010 U.S.Religion Census: Religious Congregations & Membership Study. Association of Statisticians of American Religious Bodies. Jones, Dale E., et al. 2002. Congregations and Membership in the United States 2000. Nashville, TN: Glenmary Research Center. Graphs represent county-level data
Food Environment Statistics: Number of grocery stores : 195This county :
2.79 / 10,000 pop.Oklahoma :
1.97 / 10,000 pop.
Number of supercenters and club stores : 12This county :
0.17 / 10,000 pop.Oklahoma :
0.20 / 10,000 pop.
Number of convenience stores (no gas) : 29This county :
0.41 / 10,000 pop.Oklahoma :
0.76 / 10,000 pop.
Number of convenience stores (with gas) : 163Oklahoma County :
2.33 / 10,000 pop.Oklahoma :
4.35 / 10,000 pop.
Number of full-service restaurants : 566This county :
8.10 / 10,000 pop.State :
6.89 / 10,000 pop.
Adult diabetes rate : Oklahoma County :
9.8%State :
10.3%
Adult obesity rate : Oklahoma County :
27.9%Oklahoma :
29.2%
Health and Nutrition: Healthy diet rate : This city:
49.0%Oklahoma:
48.6%
Average overall health of teeth and gums : This city:
45.5%Oklahoma:
45.2%
People feeling badly about themselves : Del City:
21.3%State:
21.4%
People not drinking alcohol at all : Del City:
12.4%Oklahoma:
10.8%
Average hours sleeping at night : Overweight people : Del City:
35.3%State:
33.9%
General health condition : This city:
55.0%State:
55.2%
Average condition of hearing : This city:
78.3%Oklahoma:
78.4%
More about Health and Nutrition of Del City, OK Residents
Local government employment and payroll (March 2022)
Function
Full-time employees
Monthly full-time payroll
Average yearly full-time wage
Part-time employees
Monthly part-time payroll
Police Protection - Officers
35 $189,981 $65,136 0 $0 Firefighters
30 $198,118 $79,247 0 $0 Other and Unallocable
24 $97,228 $48,614 0 $0 Water Supply
19 $60,659 $38,311 0 $0 Police - Other
16 $73,788 $55,341 1 $785 Other Government Administration
13 $52,300 $48,277 0 $0 Sewerage
12 $37,394 $37,394 0 $0 Solid Waste Management
8 $36,255 $54,383 0 $0 Judicial and Legal
7 $27,745 $47,563 2 $188 Financial Administration
6 $31,638 $63,276 0 $0 Streets and Highways
6 $20,599 $41,198 0 $0 Fire - Other
4 $35,673 $107,019 0 $0 Parks and Recreation
2 $7,146 $42,876 1 $1,378 Correction
1 $4,842 $58,104 0 $0
Totals for Government
183 $873,365 $57,270 4 $2,351
Del City government finances - Expenditure in 2021 (per resident):
Construction - Water Utilities: $33,000 ($1.54)
Current Operations - Police Protection: $4,138,000 ($193.47)
Local Fire Protection: $3,143,000 ($146.95)General - Other: $2,054,000 ($96.04)Water Utilities: $1,676,000 ($78.36)Central Staff Services: $1,582,000 ($73.97)Solid Waste Management: $1,189,000 ($55.59)Sewerage: $1,069,000 ($49.98)Parks and Recreation: $1,038,000 ($48.53)Housing and Community Development: $1,013,000 ($47.36)Judicial and Legal Services: $597,000 ($27.91)Regular Highways: $534,000 ($24.97)General - Interest on Debt: $645,000 ($30.16)
Other Capital Outlay - Regular Highways: $170,000 ($7.95)
Water Utilities: $136,000 ($6.36)Central Staff Services: $102,000 ($4.77)Sewerage: $71,000 ($3.32)Solid Waste Management: $29,000 ($1.36)Local Fire Protection: $23,000 ($1.08)General - Other: $12,000 ($0.56)Parks and Recreation: $11,000 ($0.51)Total Salaries and Wages: $7,973,000 ($372.78)
Water Utilities - Interest on Debt: $375,000 ($17.53)
Del City government finances - Revenue in 2021 (per resident):
Charges - Sewerage: $3,138,000 ($146.72)
Solid Waste Management: $2,218,000 ($103.70)Other: $518,000 ($24.22)Natural Resources - Other: $268,000 ($12.53)Parks and Recreation: $74,000 ($3.46)Federal Intergovernmental - Other: $433,000 ($20.24)
Housing and Community Development: $38,000 ($1.78)Miscellaneous - Fines and Forfeits: $477,000 ($22.30)
Interest Earnings: $137,000 ($6.41)Rents: $80,000 ($3.74)General Revenue - Other: $53,000 ($2.48)Donations From Private Sources: $1,000 ($0.05)Revenue - Water Utilities: $2,669,000 ($124.79)
State Intergovernmental - Other: $161,000 ($7.53)
General Local Government Support: $151,000 ($7.06)Highways: $50,000 ($2.34)Tax - General Sales and Gross Receipts: $14,162,000 ($662.15)
Public Utilities Sales: $1,014,000 ($47.41)Property: $562,000 ($26.28)Other Selective Sales: $177,000 ($8.28)Other: $93,000 ($4.35)Occupation and Business License - Other: $18,000 ($0.84)
Del City government finances - Debt in 2021 (per resident):
Long Term Debt - Beginning Outstanding - Unspecified Public Purpose: $36,359,000 ($1699.97)
Outstanding Unspecified Public Purpose: $29,055,000 ($1358.47)Beginning Outstanding - Public Debt for Private Purpose: $20,996,000 ($981.67)Outstanding Nonguaranteed - Industrial Revenue: $19,470,000 ($910.32)Retired Unspecified Public Purpose: $7,304,000 ($341.50)Retired Nonguaranteed - Public Debt for Private Purpose: $1,526,000 ($71.35)
Del City government finances - Cash and Securities in 2021 (per resident):
Other Funds - Cash and Securities: $13,466,000 ($629.61)
Sinking Funds - Cash and Securities: $22,690,000 ($1060.88)
7.15% of this county's 2021 resident taxpayers lived in other counties in 2020 ($56,046 average adjusted gross income )
Here:
7.15%Oklahoma average:
8.28%
0.04% of residents moved from foreign countries ($425 average AGI )Oklahoma County:
0.04%Oklahoma average:
0.04%
Top counties from which taxpayers relocated into this county between 2020 and 2021:
7.53% of this county's 2020 resident taxpayers moved to other counties in 2021 ($55,930 average adjusted gross income )
Here:
7.53%Oklahoma average:
7.66%
0.04% of residents moved to foreign countries ($348 average AGI )Oklahoma County:
0.04%Oklahoma average:
0.03%
Top counties to which taxpayers relocated from this county between 2020 and 2021:
Businesses in Del City, OK
Name Count Name Count
AMF Bowling 1 La Quinta 1 Advance Auto Parts 1 Long John Silver's 1 Arby's 1 McDonald's 1 Ashley Furniture 1 Nissan 1 AutoZone 1 Papa John's Pizza 1 Blockbuster 1 Pizza Hut 1 Burger King 1 SONIC Drive-In 2 CVS 1 Subway 3 Carl\s Jr. 1 T-Mobile 1 Cricket Wireless 1 Taco Bell 1 Dunkin Donuts 1 U-Haul 2 FedEx 1 Waffle House 1 H&R Block 2 Walgreens 1
Strongest AM radio stations in Del City:
KOMA (1520 AM; 50 kW; OKLAHOMA CITY, OK; Owner: RENDA BROADCASTING CORP. OF NEVADA)
KTOK (1000 AM; 5 kW; OKLAHOMA CITY, OK; Owner: CLEAR CHANNEL BROADCASTING LICENSES, INC.)
KOCY (1560 AM; 1 kW; CHICKASHA, OK; Owner: TYLER ENTERPRISES, L.L.C.)
WKY (930 AM; 5 kW; OKLAHOMA CITY, OK; Owner: CITADEL BROADCASTING COMPANY)
WWLS (640 AM; 5 kW; MOORE, OK; Owner: CITADEL BROADCASTING COMPANY)
KVSP (1140 AM; daytime; 1 kW; OKLAHOMA CITY, OK; Owner: PERRY BROADCASTING COMPANY, INC.)
KEBC (1340 AM; 1 kW; OKLAHOMA CITY, OK; Owner: CLEAR CHANNEL BROADCASTING LICENSES, INC.)
KTLV (1220 AM; 0 kW; MIDWEST CITY, OK; Owner: FIRST CHOICE BROADCASTING, INC.)
KQCV (800 AM; 2 kW; OKLAHOMA CITY, OK; Owner: BOTT BROADCASTING COMPANY)
KTLR (890 AM; daytime; 1 kW; OKLAHOMA CITY, OK; Owner: TYLER BROADCASTING CORPORATION)
KRMG (740 AM; 50 kW; TULSA, OK; Owner: CXR HOLDINGS, INC.)
KFAQ (1170 AM; 50 kW; TULSA, OK; Owner: JOURNAL BROADCAST CORPORATION)
KREF (1400 AM; 1 kW; NORMAN, OK; Owner: FOX BROADCASTING CO, INC.)
Strongest FM radio stations in Del City:
KMGL (104.1 FM; OKLAHOMA CITY, OK; Owner: RENDA BROADCASTING CORP. OF NEVADA)
KHBZ-FM (94.7 FM; OKLAHOMA CITY, OK; Owner: CLEAR CHANNEL BROADCASTING LICENSES, INC.)
KTST (101.9 FM; OKLAHOMA CITY, OK; Owner: CLEAR CHANNEL BROADCASTING LICENSES, INC.)
K246AF (97.1 FM; OKLAHOMA CITY, OK; Owner: MICHAEL A. BROOKS / DBA JIME'NEZ COM)
K259AM (99.7 FM; OKLAHOMA CITY, OK; Owner: THE LOVE STATION, INC.)
KOMA-FM (92.5 FM; OKLAHOMA CITY, OK; Owner: RENDA BROADCASTING CORPORATION OF NV)
KRXO (107.7 FM; OKLAHOMA CITY, OK; Owner: RENDA BROADCASTING CORPORATION OF NV)
KYIS (98.9 FM; OKLAHOMA CITY, OK; Owner: CITADEL BROADCASTING COMPANY)
KATT-FM (100.5 FM; OKLAHOMA CITY, OK; Owner: CITADEL BROADCASTING COMPANY)
KJYO (102.7 FM; OKLAHOMA CITY, OK; Owner: CLEAR CHANNEL BROADCASTING LICENSES, INC.)
KXXY-FM (96.1 FM; OKLAHOMA CITY, OK; Owner: CLEAR CHANNEL BROADCASTING LICENSES, INC.)
KOKF (90.9 FM; EDMOND, OK; Owner: R.D.M BROADCASTING ENTERPRISES, INC.)
KYLV (88.9 FM; OKLAHOMA CITY, OK; Owner: EDUCATIONAL MEDIA FOUNDATION)
KCSC (90.1 FM; EDMOND, OK; Owner: THE UNIVERSITY OF CENTRAL OKLAHOMA)
KKNG-FM (93.3 FM; NEWCASTLE, OK; Owner: TYLER BROADCASTING CORPORATION)
KKWD (97.9 FM; EDMOND, OK; Owner: CITADEL BROADCASTING COMPANY)
KROU (105.7 FM; SPENCER, OK; Owner: UNIVERSITY OF OKLAHOMA)
WWLS-FM (104.9 FM; BETHANY, OK; Owner: CITADEL BROADCASTING COMPANY)
KMSI (88.1 FM; MOORE, OK; Owner: CREATIVE EDUCATIONAL MEDIA CORPORATION, INC.)
K208CG (89.5 FM; OKLAHOMA CITY, OK; Owner: CALVARY CHAPEL OF TWIN FALLS, INC.)
TV broadcast stations around Del City:
KWTV (Channel 9; OKLAHOMA CITY, OK; Owner: GRIFFIN ENTITIES, L.L.C.)
KOCO-TV (Channel 5; OKLAHOMA CITY, OK; Owner: OHIO/OKLAHOMA HEARST- ARGYLE TELEVISION)
KOKH-TV (Channel 25; OKLAHOMA CITY, OK; Owner: KOKH LICENSEE, LLC)
KETA-TV (Channel 13; OKLAHOMA CITY, OK; Owner: OKLAHOMA EDUCATIONAL TELEVISION AUTHORITY)
KOCB (Channel 34; OKLAHOMA CITY, OK; Owner: KOCB LICENSEE, LLC)
KOPX (Channel 62; OKLAHOMA CITY, OK; Owner: PAXSON OKLAHOMA CITY LICENSE, INC.)
KFOR-TV (Channel 4; OKLAHOMA CITY, OK; Owner: NEW YORK TIMES MANAGEMENT SERVICES)
KSBI (Channel 52; OKLAHOMA CITY, OK; Owner: LOCKE SUPPLY CO.)
K69EK (Channel 69; OKLAHOMA CITY, OK; Owner: ARKANSAS MEDIA, L.L.C.)
KTBO-TV (Channel 14; OKLAHOMA CITY, OK; Owner: TRINITY BROADCASTING OF OKLAHOMA CITY, INC.)
KCHM-LP (Channel 59; OKLAHOMA CITY, OK; Owner: TIGER EYE BROADCASTING CORPORATION)
KXOC-LP (Channel 54; OKLAHOMA CITY, OK; Owner: LOCKE SUPPLY CO.)
KDSA-LP (Channel 11; NORMAN, OK; Owner: DAY STAR BROADCASTING CORPORATION)
KOHC-LP (Channel 7; OKLAHOMA CITY, OK; Owner: TIGER EYE BROADCASTING CORPORATION)
KQOK (Channel 30; SHAWNEE, OK; Owner: SHAWNEE BROADCASTING, INC.)
K30EC (Channel 30; BATESVILLE, AR; Owner: MS COMMUNICATIONS, LLC)
KLHO-LP (Channel 17; OKLAHOMA CITY, OK; Owner: ARACELIS ORTIZ, EXECUTRIX OF THE ESTATE OF CARLOS ORTIZ)
KKCC-LP (Channel 19; OKLAHOMA CITY, OK; Owner: EICB-TV, LLC)
KTOU-LP (Channel 21; OKLAHOMA CITY, OK; Owner: MAKO COMMUNICATIONS, LLC)
National Bridge Inventory (NBI) Statistics 44 Number of bridges367ft / 112m Total length $42,056,000 Total costs528,699 Total average daily traffic54,644 Total average daily truck traffic
New bridges - historical statistics
4 1930-1939 1 1940-1949 24 1960-1969 4 1970-1979 2 1980-1989 1 1990-1999 5 2000-2009 3 2010-2019
See full National Bridge Inventory statistics for Del City, OK
Home Mortgage Disclosure Act Aggregated Statistics For Year 2009(Based on 7 full and 1 partial tracts) A) FHA, FSA/RHS & VA B) Conventional C) Refinancings D) Home Improvement Loans E) Loans on Dwellings For 5+ Families F) Non-occupant Loans on G) Loans On Manufactured Number Average Value Number Average Value Number Average Value Number Average Value Number Average Value Number Average Value Number Average Value
LOANS ORIGINATED 165 $84,868 51 $52,857 178 $74,679 94 $17,263 1 $455,430 58 $41,947 1 $3,000 APPLICATIONS APPROVED, NOT ACCEPTED 8 $68,444 4 $70,770 21 $99,614 9 $97,210 0 $0 0 $0 0 $0 APPLICATIONS DENIED 18 $95,098 16 $67,352 138 $75,121 67 $11,865 0 $0 20 $35,622 1 $81,000 APPLICATIONS WITHDRAWN 15 $93,439 9 $50,151 83 $83,293 7 $33,926 0 $0 5 $38,310 0 $0 FILES CLOSED FOR INCOMPLETENESS 3 $68,000 3 $70,927 16 $89,988 1 $73,000 0 $0 0 $0 0 $0
Aggregated Statistics For Year 2008(Based on 7 full and 1 partial tracts) A) FHA, FSA/RHS & VA B) Conventional C) Refinancings D) Home Improvement Loans E) Loans on Dwellings For 5+ Families F) Non-occupant Loans on G) Loans On Manufactured Number Average Value Number Average Value Number Average Value Number Average Value Number Average Value Number Average Value Number Average Value
LOANS ORIGINATED 133 $80,257 98 $64,675 176 $62,623 99 $19,270 2 $2,218,555 95 $55,152 0 $0 APPLICATIONS APPROVED, NOT ACCEPTED 6 $83,118 11 $94,543 17 $71,745 7 $23,707 0 $0 6 $42,977 3 $95,000 APPLICATIONS DENIED 17 $71,206 36 $71,685 199 $73,186 86 $24,286 1 $2,213,000 25 $50,573 2 $60,000 APPLICATIONS WITHDRAWN 7 $96,316 11 $90,994 66 $77,344 8 $39,166 0 $0 13 $48,182 0 $0 FILES CLOSED FOR INCOMPLETENESS 4 $73,780 3 $99,260 11 $77,511 2 $166,500 0 $0 1 $46,000 0 $0
Aggregated Statistics For Year 2007(Based on 7 full and 1 partial tracts) A) FHA, FSA/RHS & VA B) Conventional C) Refinancings D) Home Improvement Loans E) Loans on Dwellings For 5+ Families F) Non-occupant Loans on G) Loans On Manufactured Number Average Value Number Average Value Number Average Value Number Average Value Number Average Value Number Average Value Number Average Value
LOANS ORIGINATED 74 $80,635 228 $73,611 200 $63,839 131 $18,896 3 $2,024,167 120 $60,621 2 $13,415 APPLICATIONS APPROVED, NOT ACCEPTED 4 $96,130 25 $81,316 35 $69,011 15 $38,566 0 $0 11 $41,823 4 $80,418 APPLICATIONS DENIED 10 $75,550 75 $71,738 269 $73,602 114 $26,624 0 $0 26 $54,744 6 $48,377 APPLICATIONS WITHDRAWN 2 $61,850 21 $78,780 107 $78,646 24 $45,560 0 $0 17 $56,372 0 $0 FILES CLOSED FOR INCOMPLETENESS 1 $46,000 11 $80,434 26 $77,998 4 $41,800 0 $0 1 $50,520 0 $0
Aggregated Statistics For Year 2006(Based on 7 full and 1 partial tracts) A) FHA, FSA/RHS & VA B) Conventional C) Refinancings D) Home Improvement Loans E) Loans on Dwellings For 5+ Families F) Non-occupant Loans on G) Loans On Manufactured Number Average Value Number Average Value Number Average Value Number Average Value Number Average Value Number Average Value Number Average Value
LOANS ORIGINATED 93 $81,124 273 $63,388 280 $68,225 128 $23,088 2 $1,778,915 137 $68,714 3 $18,080 APPLICATIONS APPROVED, NOT ACCEPTED 7 $80,321 39 $63,513 49 $72,820 14 $31,288 0 $0 12 $48,738 6 $68,797 APPLICATIONS DENIED 8 $64,142 97 $59,382 338 $77,195 151 $22,764 1 $2,265,410 34 $46,230 7 $40,913 APPLICATIONS WITHDRAWN 5 $84,978 46 $75,509 167 $74,652 20 $31,807 0 $0 10 $53,313 0 $0 FILES CLOSED FOR INCOMPLETENESS 1 $73,000 11 $67,606 41 $74,847 1 $39,000 1 $3,500,000 3 $63,287 0 $0
Aggregated Statistics For Year 2005(Based on 7 full and 1 partial tracts) A) FHA, FSA/RHS & VA B) Conventional C) Refinancings D) Home Improvement Loans E) Loans on Dwellings For 5+ Families F) Non-occupant Loans on G) Loans On Manufactured Number Average Value Number Average Value Number Average Value Number Average Value Number Average Value Number Average Value Number Average Value
LOANS ORIGINATED 102 $72,513 267 $54,654 342 $58,888 132 $24,132 3 $3,269,483 145 $47,158 1 $27,820 APPLICATIONS APPROVED, NOT ACCEPTED 10 $63,556 59 $52,608 58 $60,265 13 $33,045 0 $0 15 $37,822 9 $48,991 APPLICATIONS DENIED 11 $68,503 93 $51,743 384 $69,177 146 $22,286 0 $0 46 $45,081 12 $34,087 APPLICATIONS WITHDRAWN 5 $86,616 88 $77,648 215 $78,970 25 $56,553 2 $3,289,020 24 $65,245 0 $0 FILES CLOSED FOR INCOMPLETENESS 4 $70,715 10 $64,278 33 $83,869 7 $52,759 0 $0 8 $51,165 0 $0
Aggregated Statistics For Year 2004(Based on 7 full and 1 partial tracts) A) FHA, FSA/RHS & VA B) Conventional C) Refinancings D) Home Improvement Loans E) Loans on Dwellings For 5+ Families F) Non-occupant Loans on G) Loans On Manufactured Number Average Value Number Average Value Number Average Value Number Average Value Number Average Value Number Average Value Number Average Value
LOANS ORIGINATED 158 $77,763 214 $64,701 392 $57,839 112 $20,066 0 $0 138 $41,329 1 $50,000 APPLICATIONS APPROVED, NOT ACCEPTED 7 $53,826 30 $62,221 84 $63,969 12 $23,105 0 $0 7 $43,741 2 $38,850 APPLICATIONS DENIED 17 $59,005 53 $58,465 362 $62,732 112 $20,432 1 $3,840,000 29 $50,578 8 $71,068 APPLICATIONS WITHDRAWN 2 $70,035 23 $78,227 182 $71,133 15 $34,123 0 $0 12 $53,261 1 $45,000 FILES CLOSED FOR INCOMPLETENESS 1 $68,470 11 $74,016 28 $64,066 3 $15,790 0 $0 3 $49,847 0 $0
Aggregated Statistics For Year 2003(Based on 7 full and 1 partial tracts) A) FHA, FSA/RHS & VA B) Conventional C) Refinancings D) Home Improvement Loans E) Loans on Dwellings For 5+ Families F) Non-occupant Loans on Number Average Value Number Average Value Number Average Value Number Average Value Number Average Value Number Average Value
LOANS ORIGINATED 181 $70,322 207 $62,978 582 $55,871 102 $14,041 1 $1,398,000 131 $38,723 APPLICATIONS APPROVED, NOT ACCEPTED 6 $55,398 19 $66,661 72 $55,569 12 $24,881 0 $0 10 $53,462 APPLICATIONS DENIED 26 $65,003 54 $53,059 316 $62,856 86 $14,461 0 $0 23 $37,992 APPLICATIONS WITHDRAWN 7 $60,359 23 $67,546 165 $67,536 16 $13,518 0 $0 8 $44,619 FILES CLOSED FOR INCOMPLETENESS 4 $56,498 12 $54,762 42 $62,832 1 $49,000 0 $0 6 $50,332
Aggregated Statistics For Year 2002(Based on 7 full and 1 partial tracts) A) FHA, FSA/RHS & VA B) Conventional C) Refinancings D) Home Improvement Loans E) Loans on Dwellings For 5+ Families F) Non-occupant Loans on Number Average Value Number Average Value Number Average Value Number Average Value Number Average Value Number Average Value
LOANS ORIGINATED 148 $67,618 163 $55,661 395 $48,757 104 $13,099 2 $466,480 97 $38,786 APPLICATIONS APPROVED, NOT ACCEPTED 2 $44,000 27 $55,629 89 $53,120 7 $23,036 0 $0 8 $42,392 APPLICATIONS DENIED 14 $55,673 51 $48,271 235 $52,461 54 $15,616 0 $0 17 $38,895 APPLICATIONS WITHDRAWN 9 $59,992 23 $53,830 169 $56,133 8 $23,114 0 $0 5 $47,508 FILES CLOSED FOR INCOMPLETENESS 0 $0 4 $46,890 35 $60,992 0 $0 0 $0 7 $50,704
Aggregated Statistics For Year 2001(Based on 7 full and 1 partial tracts) A) FHA, FSA/RHS & VA B) Conventional C) Refinancings D) Home Improvement Loans E) Loans on Dwellings For 5+ Families F) Non-occupant Loans on Number Average Value Number Average Value Number Average Value Number Average Value Number Average Value Number Average Value
LOANS ORIGINATED 170 $59,131 115 $50,909 322 $49,847 129 $12,682 3 $584,653 87 $36,918 APPLICATIONS APPROVED, NOT ACCEPTED 2 $34,000 16 $50,537 42 $44,740 8 $10,136 0 $0 6 $29,030 APPLICATIONS DENIED 17 $59,336 64 $46,728 246 $48,666 75 $10,915 0 $0 23 $34,969 APPLICATIONS WITHDRAWN 11 $54,529 28 $47,554 186 $52,300 14 $15,954 0 $0 6 $36,360 FILES CLOSED FOR INCOMPLETENESS 5 $65,070 8 $51,765 32 $47,428 1 $19,870 0 $0 4 $46,870
Aggregated Statistics For Year 2000(Based on 7 full and 1 partial tracts) A) FHA, FSA/RHS & VA B) Conventional C) Refinancings D) Home Improvement Loans E) Loans on Dwellings For 5+ Families F) Non-occupant Loans on Number Average Value Number Average Value Number Average Value Number Average Value Number Average Value Number Average Value
LOANS ORIGINATED 155 $53,595 149 $40,547 192 $43,703 120 $14,031 1 $2,207,780 71 $27,495 APPLICATIONS APPROVED, NOT ACCEPTED 7 $49,116 23 $48,370 56 $41,943 23 $26,779 0 $0 5 $27,770 APPLICATIONS DENIED 28 $51,183 86 $41,911 153 $46,624 99 $14,073 0 $0 15 $32,695 APPLICATIONS WITHDRAWN 10 $57,788 24 $45,412 106 $42,188 15 $15,898 0 $0 5 $29,766 FILES CLOSED FOR INCOMPLETENESS 2 $34,030 2 $29,500 27 $54,269 1 $29,150 0 $0 0 $0
Aggregated Statistics For Year 1999(Based on 7 full and 1 partial tracts) A) FHA, FSA/RHS & VA B) Conventional C) Refinancings D) Home Improvement Loans E) Loans on Dwellings For 5+ Families F) Non-occupant Loans on Number Average Value Number Average Value Number Average Value Number Average Value Number Average Value Number Average Value
LOANS ORIGINATED 168 $52,772 106 $44,895 237 $39,657 100 $10,220 4 $8,750 56 $28,975 APPLICATIONS APPROVED, NOT ACCEPTED 3 $38,343 39 $42,543 81 $40,152 17 $15,834 0 $0 14 $24,734 APPLICATIONS DENIED 26 $56,831 105 $42,404 182 $40,693 76 $13,681 0 $0 19 $36,736 APPLICATIONS WITHDRAWN 18 $59,064 24 $56,448 113 $47,115 13 $25,598 0 $0 4 $23,592 FILES CLOSED FOR INCOMPLETENESS 2 $24,575 4 $40,392 36 $45,362 1 $26,800 0 $0 3 $46,333
Detailed HMDA statistics for the following Tracts:
1078.01
, 1078.04 , 1078.05 , 1078.06 , 1078.07 , 1078.08 , 1078.09 , 1078.10
Private Mortgage Insurance Companies Aggregated Statistics For Year 2009(Based on 7 full and 1 partial tracts) A) Conventional B) Refinancings C) Non-occupant Loans on Number Average Value Number Average Value Number Average Value
LOANS ORIGINATED 8 $105,395 9 $104,443 0 $0 APPLICATIONS APPROVED, NOT ACCEPTED 4 $51,325 6 $79,848 1 $69,000 APPLICATIONS DENIED 4 $69,420 0 $0 0 $0 APPLICATIONS WITHDRAWN 0 $0 2 $73,030 0 $0 FILES CLOSED FOR INCOMPLETENESS 0 $0 0 $0 0 $0
Aggregated Statistics For Year 2008(Based on 7 full and 1 partial tracts) A) Conventional B) Refinancings C) Non-occupant Loans on Number Average Value Number Average Value Number Average Value
LOANS ORIGINATED 38 $72,608 13 $88,115 11 $73,286 APPLICATIONS APPROVED, NOT ACCEPTED 15 $77,047 7 $97,794 4 $70,550 APPLICATIONS DENIED 1 $43,000 2 $79,500 2 $79,500 APPLICATIONS WITHDRAWN 3 $71,283 1 $69,000 1 $69,000 FILES CLOSED FOR INCOMPLETENESS 1 $49,000 0 $0 1 $49,000
Aggregated Statistics For Year 2007(Based on 7 full and 1 partial tracts) A) Conventional B) Refinancings C) Non-occupant Loans on Number Average Value Number Average Value Number Average Value
LOANS ORIGINATED 119 $69,872 32 $76,560 32 $51,945 APPLICATIONS APPROVED, NOT ACCEPTED 15 $71,606 9 $65,926 4 $57,098 APPLICATIONS DENIED 0 $0 0 $0 0 $0 APPLICATIONS WITHDRAWN 2 $42,580 2 $58,000 2 $42,580 FILES CLOSED FOR INCOMPLETENESS 1 $53,080 0 $0 0 $0
Aggregated Statistics For Year 2006(Based on 7 full and 1 partial tracts) A) Conventional B) Refinancings C) Non-occupant Loans on Number Average Value Number Average Value Number Average Value
LOANS ORIGINATED 81 $70,965 19 $77,422 21 $49,689 APPLICATIONS APPROVED, NOT ACCEPTED 8 $47,095 4 $82,312 3 $42,667 APPLICATIONS DENIED 1 $79,000 0 $0 0 $0 APPLICATIONS WITHDRAWN 1 $152,000 0 $0 0 $0 FILES CLOSED FOR INCOMPLETENESS 0 $0 0 $0 0 $0
Aggregated Statistics For Year 2005(Based on 7 full and 1 partial tracts) A) Conventional B) Refinancings C) Non-occupant Loans on Number Average Value Number Average Value Number Average Value
LOANS ORIGINATED 66 $62,380 36 $72,134 25 $50,232 APPLICATIONS APPROVED, NOT ACCEPTED 10 $59,293 5 $71,998 1 $56,000 APPLICATIONS DENIED 2 $50,000 0 $0 1 $50,000 APPLICATIONS WITHDRAWN 0 $0 3 $69,473 0 $0 FILES CLOSED FOR INCOMPLETENESS 1 $55,000 0 $0 0 $0
Aggregated Statistics For Year 2004(Based on 7 full and 1 partial tracts) A) Conventional B) Refinancings C) Non-occupant Loans on Number Average Value Number Average Value Number Average Value
LOANS ORIGINATED 68 $72,732 46 $68,434 22 $43,886 APPLICATIONS APPROVED, NOT ACCEPTED 6 $52,568 10 $71,685 1 $41,000 APPLICATIONS DENIED 2 $63,420 0 $0 0 $0 APPLICATIONS WITHDRAWN 2 $63,500 3 $59,177 0 $0 FILES CLOSED FOR INCOMPLETENESS 0 $0 0 $0 0 $0
Aggregated Statistics For Year 2003(Based on 7 full and 1 partial tracts) A) Conventional B) Refinancings C) Non-occupant Loans on Number Average Value Number Average Value Number Average Value
LOANS ORIGINATED 62 $67,476 95 $68,971 21 $49,295 APPLICATIONS APPROVED, NOT ACCEPTED 8 $58,232 25 $72,790 4 $43,045 APPLICATIONS DENIED 0 $0 0 $0 0 $0 APPLICATIONS WITHDRAWN 3 $41,667 3 $62,773 2 $36,155 FILES CLOSED FOR INCOMPLETENESS 0 $0 1 $46,160 0 $0
Aggregated Statistics For Year 2002(Based on 7 full and 1 partial tracts) A) Conventional B) Refinancings C) Non-occupant Loans on Number Average Value Number Average Value Number Average Value
LOANS ORIGINATED 49 $59,577 71 $68,064 18 $46,291 APPLICATIONS APPROVED, NOT ACCEPTED 11 $50,947 14 $67,364 4 $35,000 APPLICATIONS DENIED 0 $0 1 $92,000 1 $92,000 APPLICATIONS WITHDRAWN 1 $79,000 5 $64,446 1 $59,270 FILES CLOSED FOR INCOMPLETENESS 0 $0 0 $0 0 $0
Aggregated Statistics For Year 2001(Based on 7 full and 1 partial tracts) A) Conventional B) Refinancings C) Non-occupant Loans on Number Average Value Number Average Value Number Average Value
LOANS ORIGINATED 31 $62,630 30 $62,792 6 $35,197 APPLICATIONS APPROVED, NOT ACCEPTED 4 $65,390 3 $57,010 0 $0 APPLICATIONS DENIED 0 $0 1 $69,000 0 $0 APPLICATIONS WITHDRAWN 1 $57,630 1 $93,000 0 $0 FILES CLOSED FOR INCOMPLETENESS 0 $0 0 $0 0 $0
Aggregated Statistics For Year 2000(Based on 7 full and 1 partial tracts) A) Conventional B) Refinancings C) Non-occupant Loans on Number Average Value Number Average Value Number Average Value
LOANS ORIGINATED 30 $43,926 22 $51,522 8 $28,356 APPLICATIONS APPROVED, NOT ACCEPTED 5 $42,938 4 $56,758 0 $0 APPLICATIONS DENIED 1 $99,000 2 $40,155 1 $38,000 APPLICATIONS WITHDRAWN 0 $0 0 $0 0 $0 FILES CLOSED FOR INCOMPLETENESS 1 $34,010 0 $0 0 $0
Aggregated Statistics For Year 1999(Based on 7 full and 1 partial tracts) A) Conventional B) Refinancings C) Non-occupant Loans on Number Average Value Number Average Value Number Average Value
LOANS ORIGINATED 26 $60,518 17 $49,553 6 $31,677 APPLICATIONS APPROVED, NOT ACCEPTED 1 $46,080 4 $53,282 0 $0 APPLICATIONS DENIED 1 $88,260 1 $57,000 0 $0 APPLICATIONS WITHDRAWN 0 $0 1 $44,000 0 $0 FILES CLOSED FOR INCOMPLETENESS 1 $38,000 1 $50,000 0 $0
Detailed PMIC statistics for the following Tracts:
1078.01
, 1078.04 , 1078.05 , 1078.06 , 1078.07 , 1078.08 , 1078.09 , 1078.10 Fire-safe hotels and motels in Del City, Oklahoma:
Candlewood Suites, 5300 Main St, Del City, Oklahoma 73115 Phone: (405) 604-5300
SpringHill Suites, 5400 Main St, Del City, Oklahoma 73115 Phone: (405) 604-0552
All 2 fire-safe hotels and motels in Del City, Oklahoma Del City compared to Oklahoma state average:
Median house value below state average. Unemployed percentage below state average. Black race population percentage above state average. Foreign-born population percentage below state average. Length of stay since moving in significantly above state average.
Top Patent Applicants
Jacob R. Honekamp (1)
Wesley G. Ingham (1)
Jacob H. Ely (1)
Jeremy Gardner (1)
Total of 4 patent applications in 2008-2024.
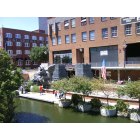

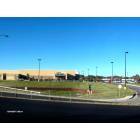
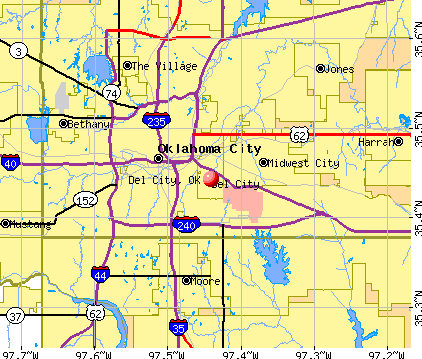


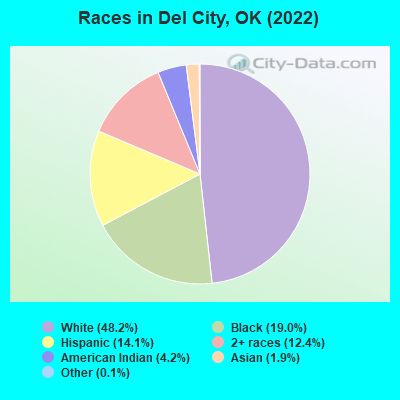
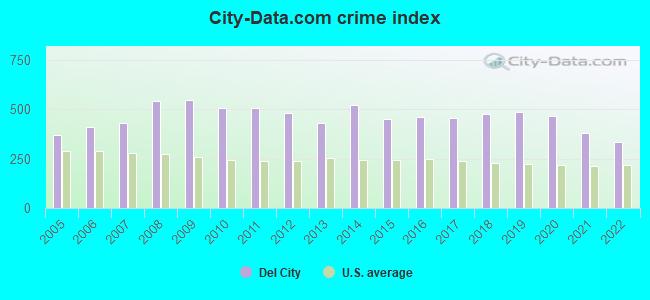
 Recent articles from our blog. Our writers, many of them Ph.D. graduates or candidates, create easy-to-read articles on a wide variety of topics.

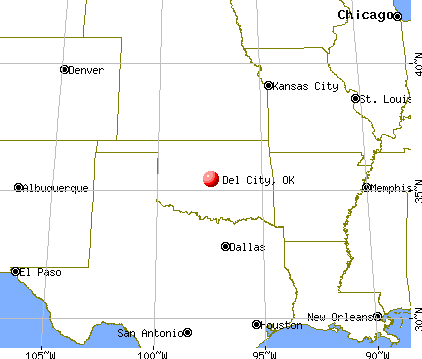
 (3.5 miles
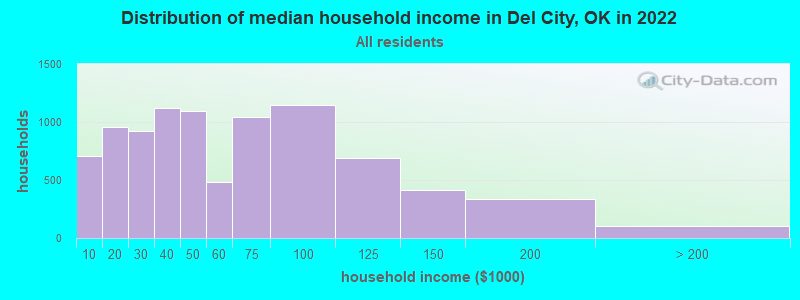
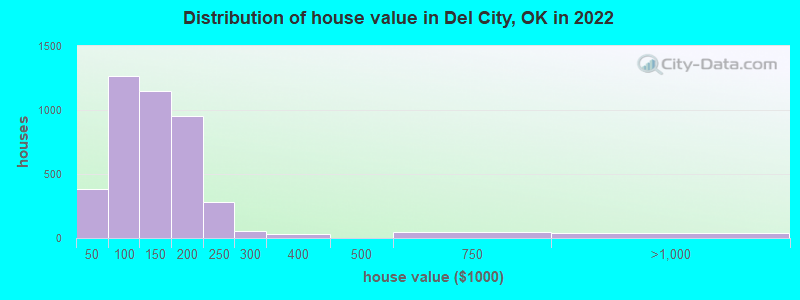
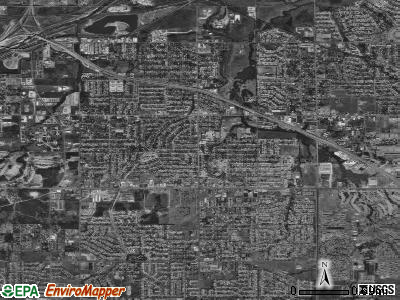
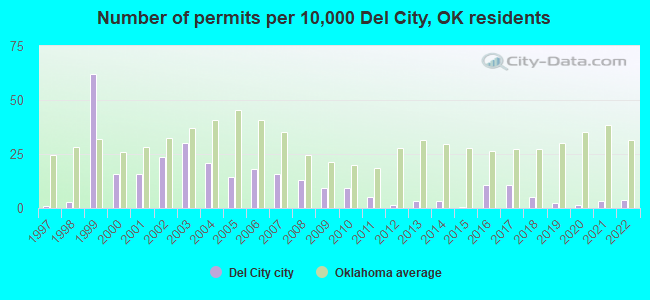
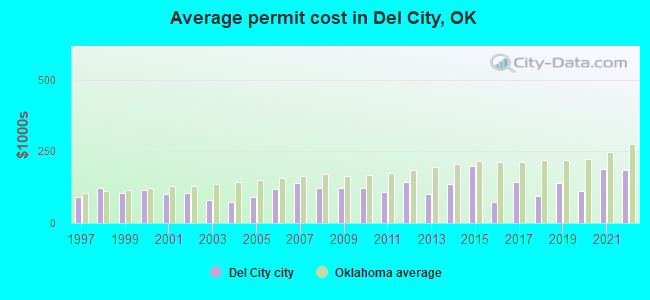
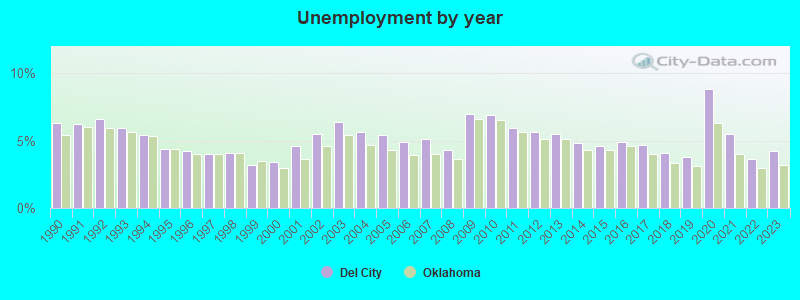
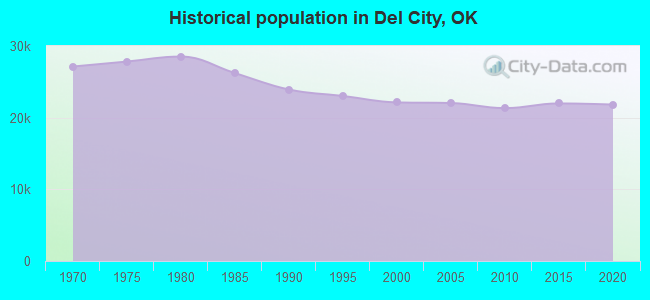
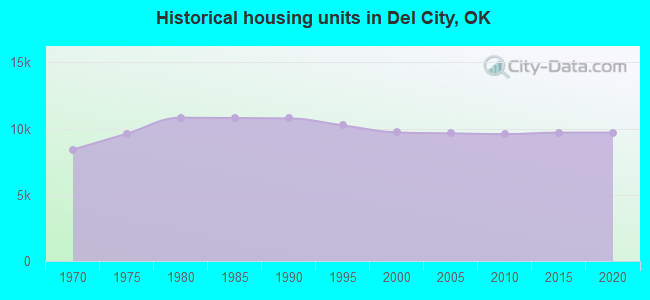
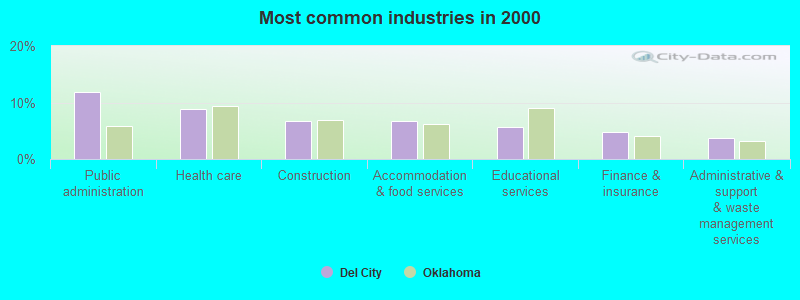
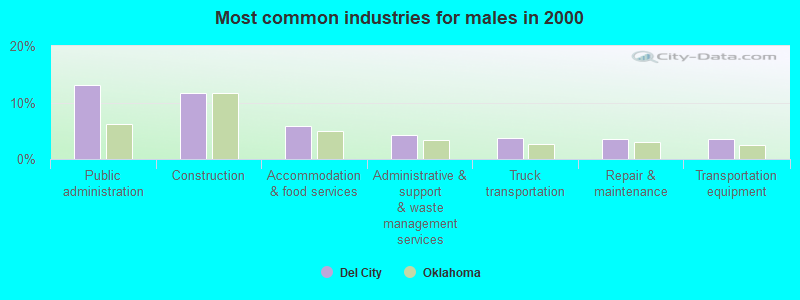
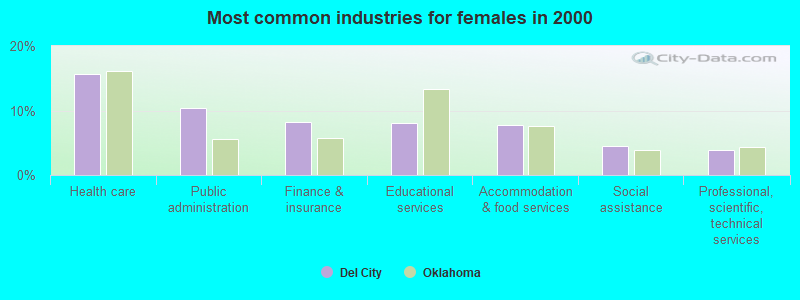
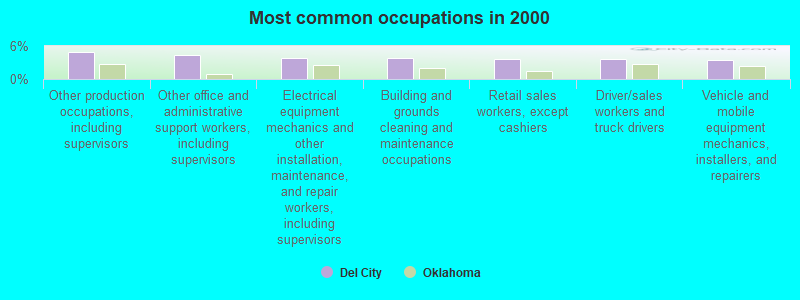
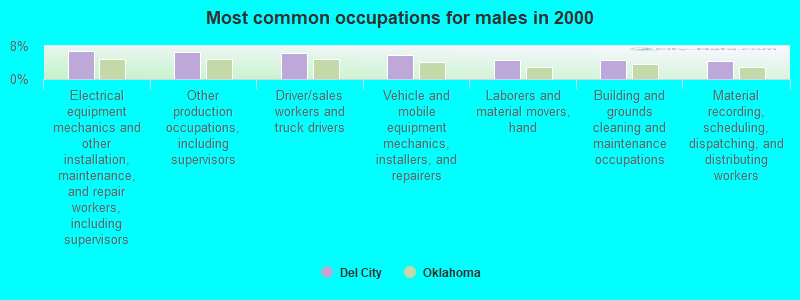
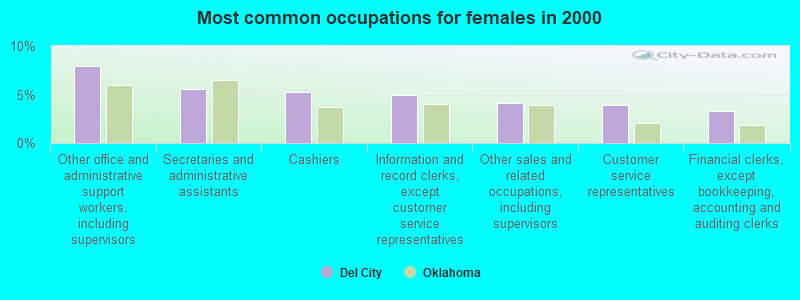
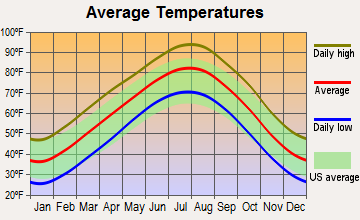
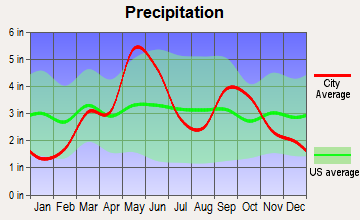
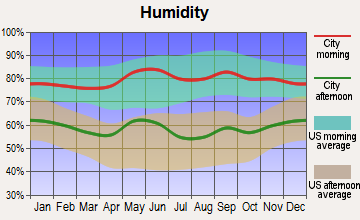
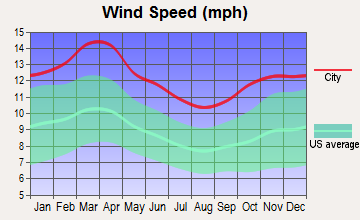
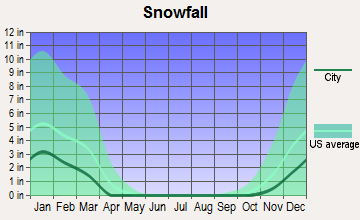
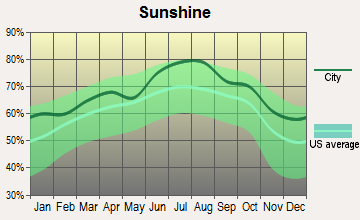
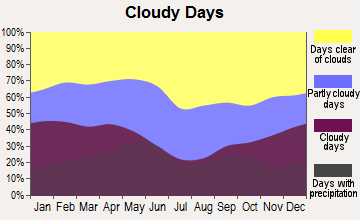
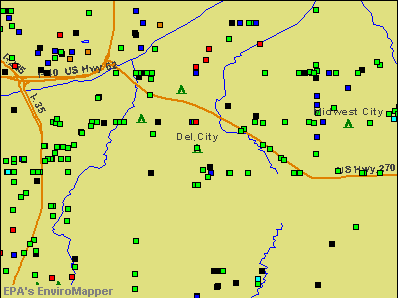

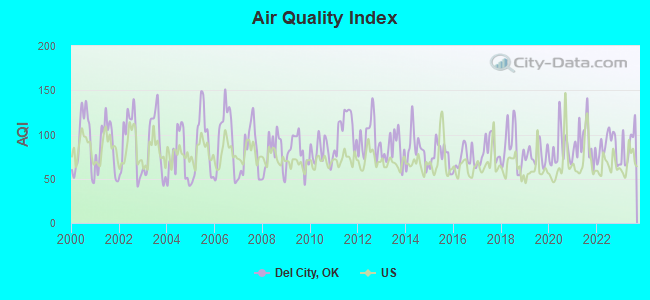
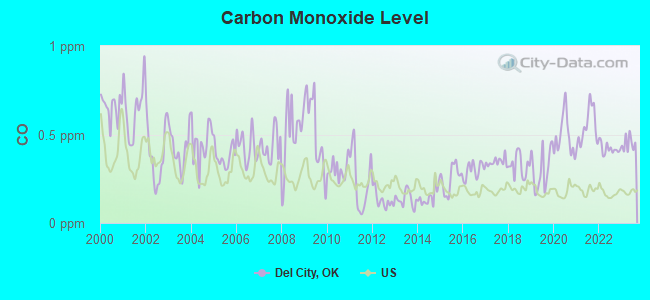
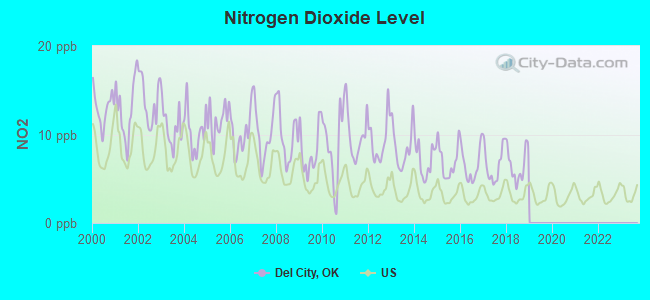
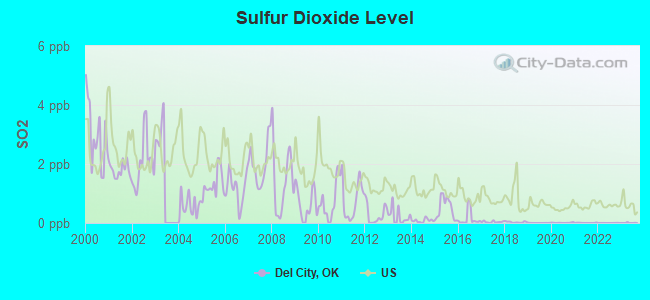
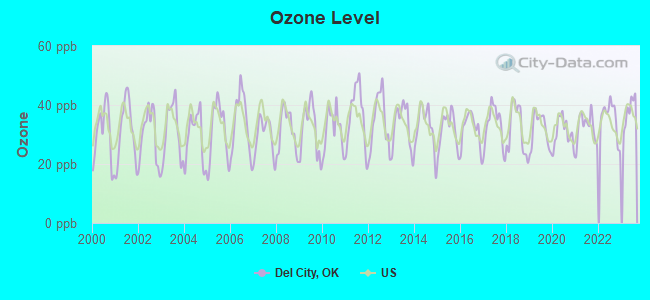
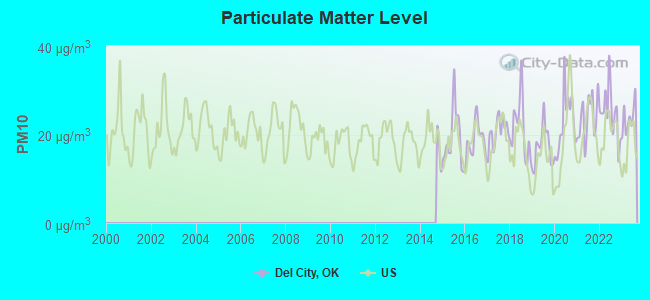
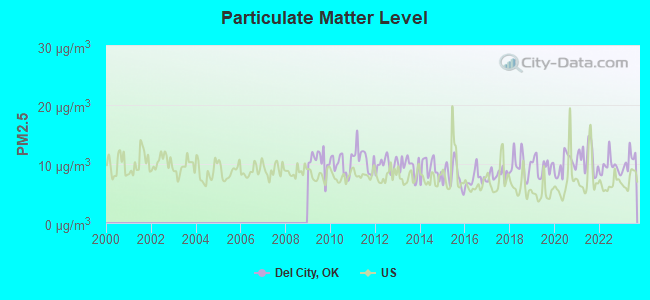
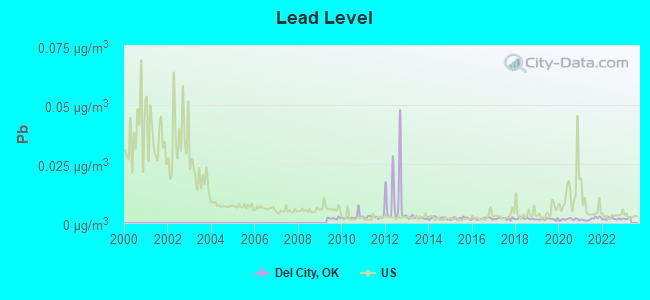
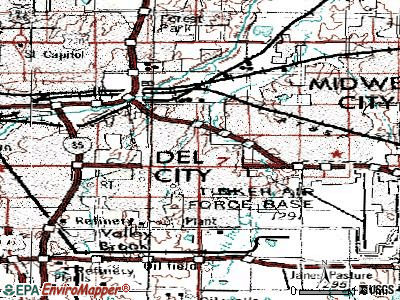
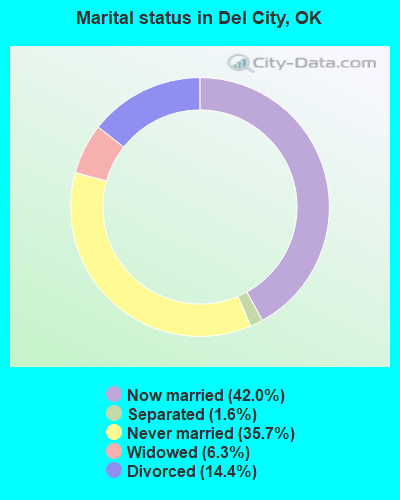
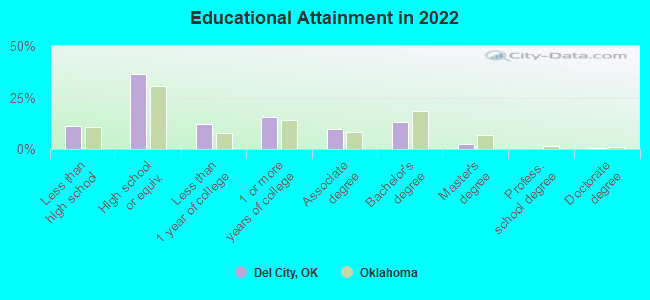
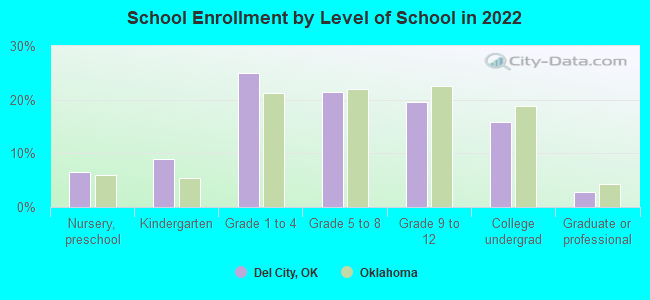
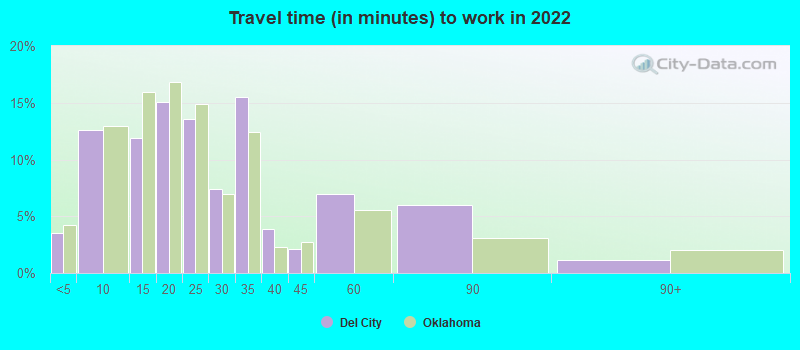
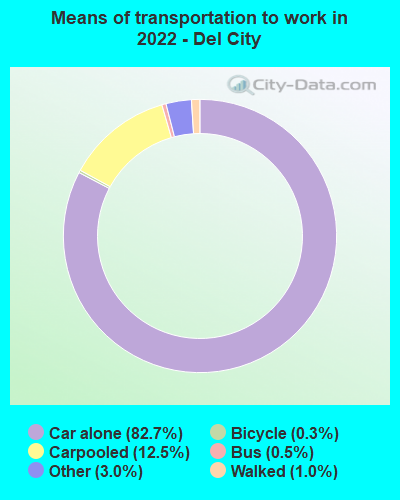
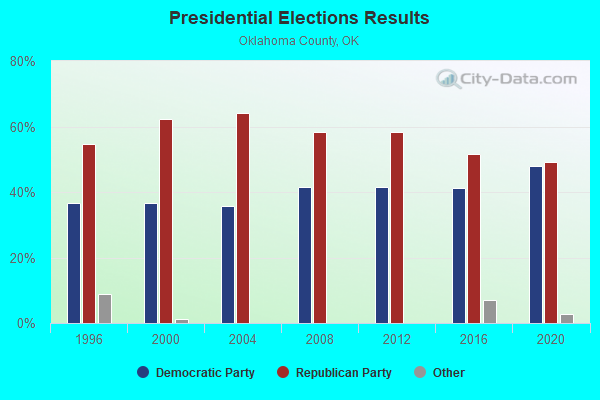
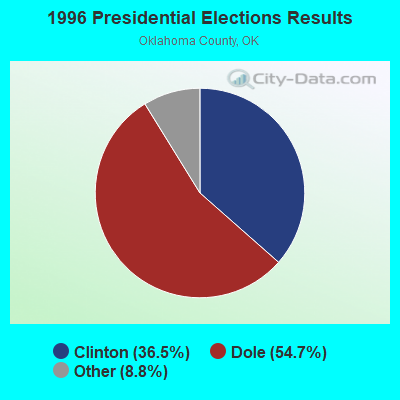
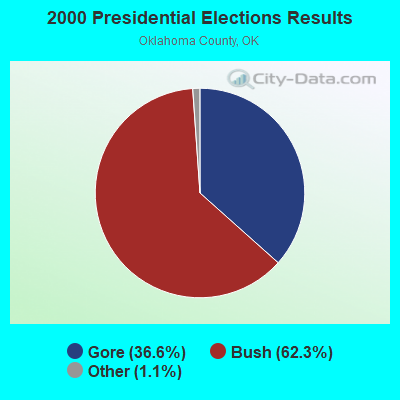
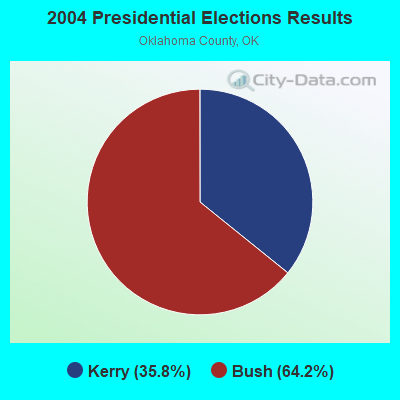
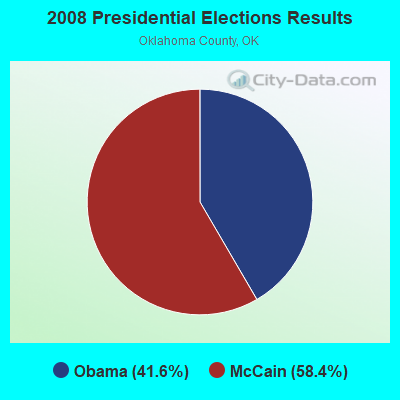
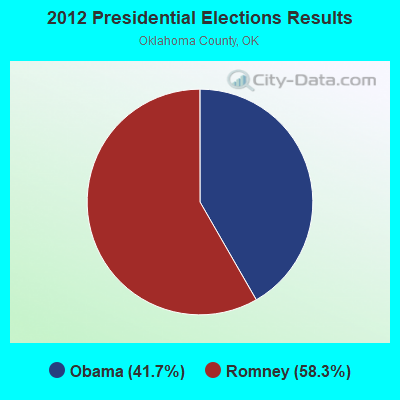
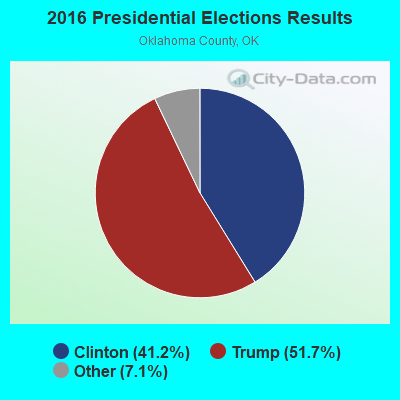
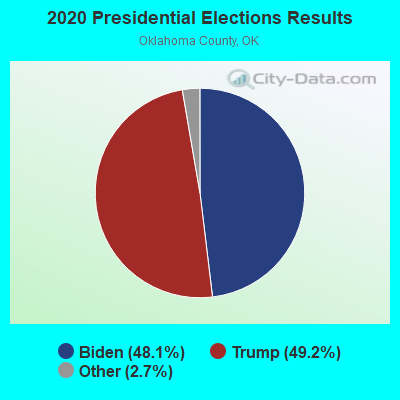
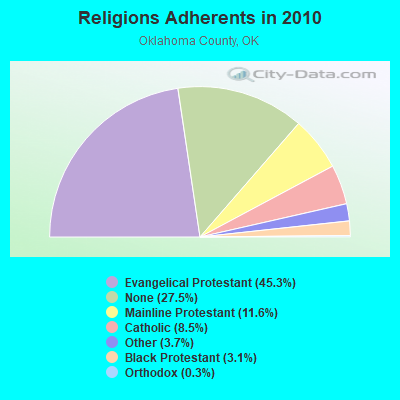
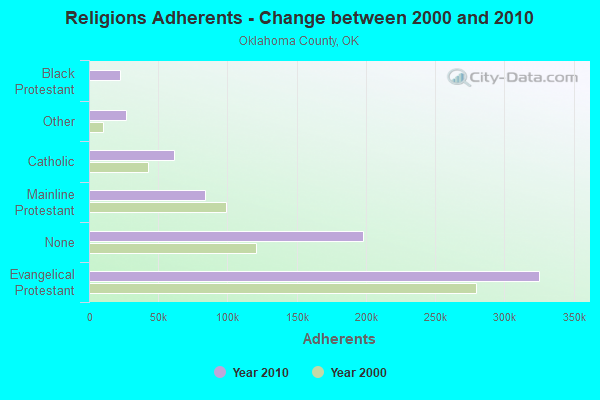
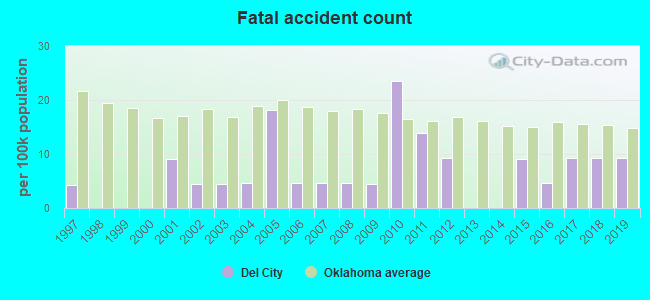
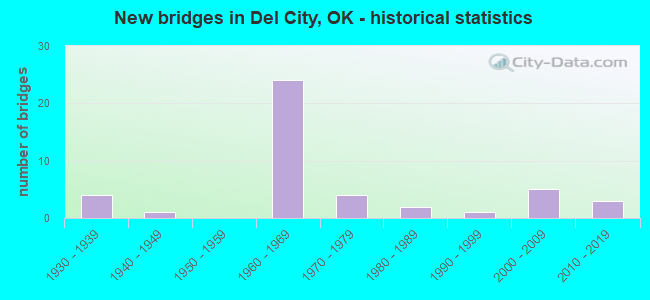
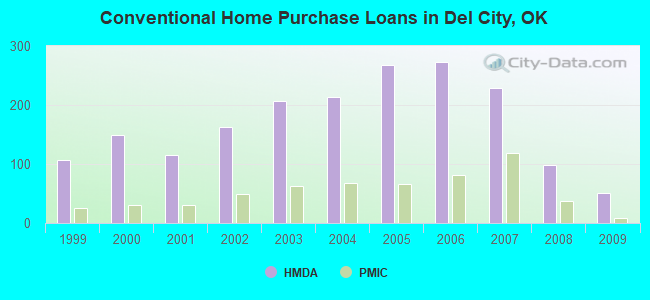
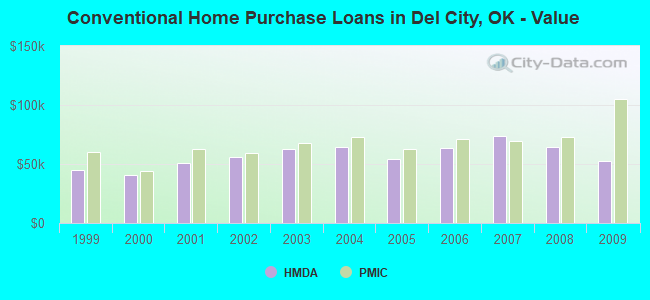
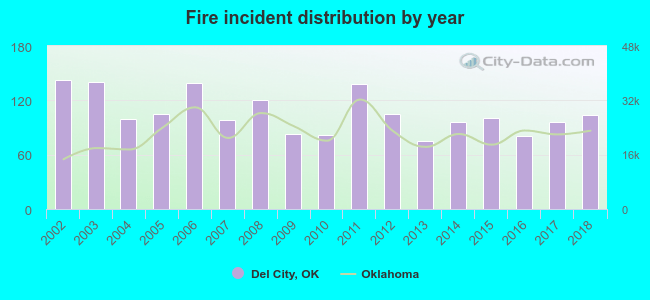 According to the data from the years 2002 - 2018 the average number of fires per year is 106. The highest number of fire incidents - 143 took place in 2002, and the least - 75 in 2013. The data has a dropping trend.
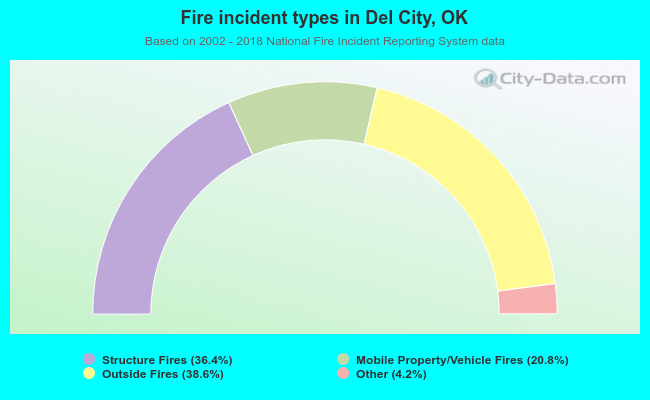 When looking into fire subcategories, the most reports belonged to: Outside Fires (38.6%), and Structure Fires (36.4%).