Estimated zip code population in 2022: 5,819 Zip code population in 2010: 4,609 Zip code population in 2000: 4,672
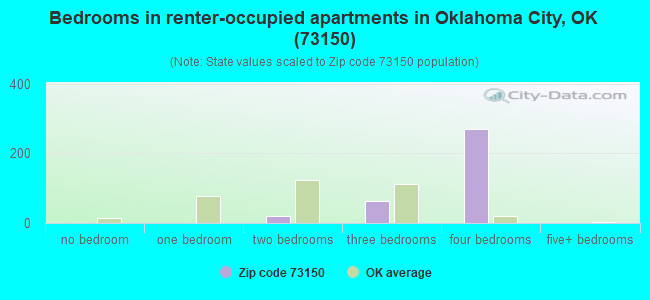
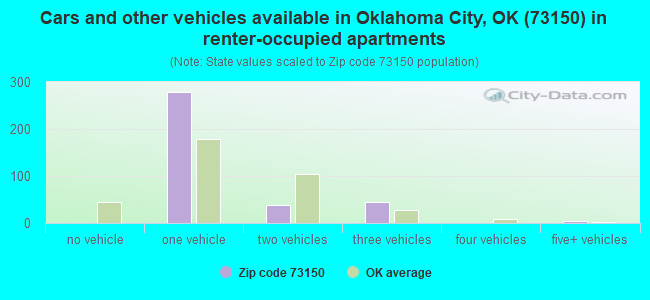
Houses and condos: 2,200 Renter-occupied apartments: 364
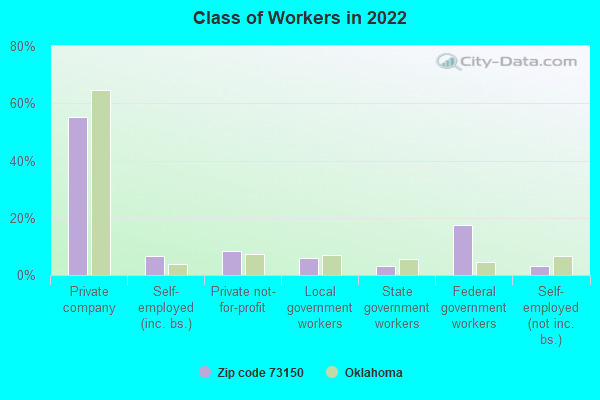
% of renters here:
17%
State:
35%
March 2022 cost of living index in zip code 73150: 80.3 (low, U.S. average is 100)
Land area: 18.9 sq. mi. Water area: 0.1 sq. mi.
Population density: 307 people per square mile
(very low).
OSM Map
General Map
Google Map
MSN Map
OSM Map
General Map
Google Map
MSN Map
OSM Map
General Map
Google Map
MSN Map
OSM Map
General Map
Google Map
MSN Map
Please wait while loading the map...
Real estate property taxes paid for housing units in 2022:
This zip code:
1.0% ($3,008)
Oklahoma:
0.8% ($1,501)
Median real estate property taxes paid for housing units with mortgages in 2022: $3,491 (1.0%) Median real estate property taxes paid for housing units with no mortgage in 2022: $2,248 (1.0%)
Business Search- 14 Million verified businesses
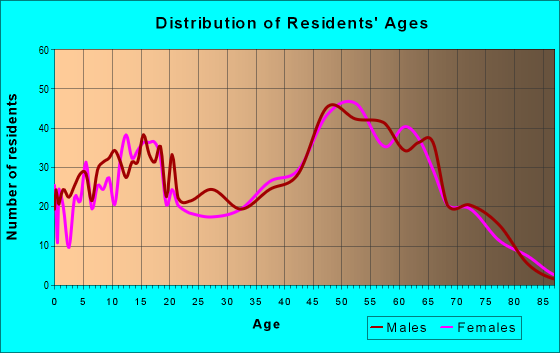
Males: 2,806
(48.2%)
Females: 3,013
(51.8%)
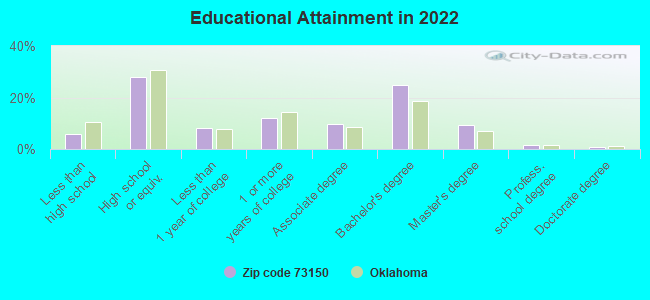
For population 25 years and over in 73150:
High school or higher: 94.8%
Bachelor's degree or higher: 36.8%
Graduate or professional degree: 11.8%
Unemployed: 4.8%
Mean travel time to work (commute): 23.7 minutes
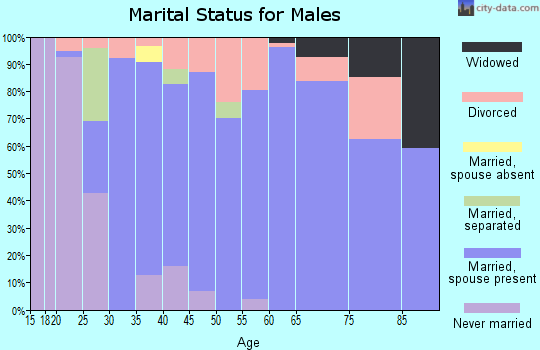
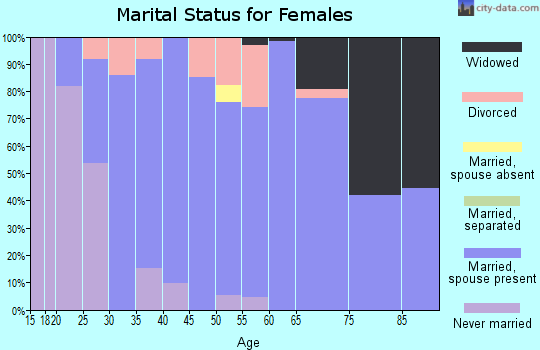
For population 15 years and over in 73150:
Never married: 16.3%
Now married: 68.2%
Separated: 2.0%
Widowed: 3.0%
Divorced: 10.6%
Zip code 73150 compared to state average:
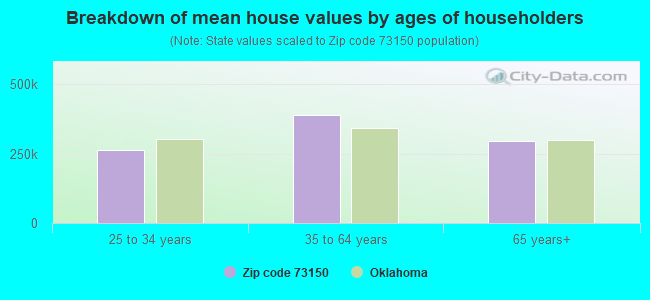
Median house value above state average.
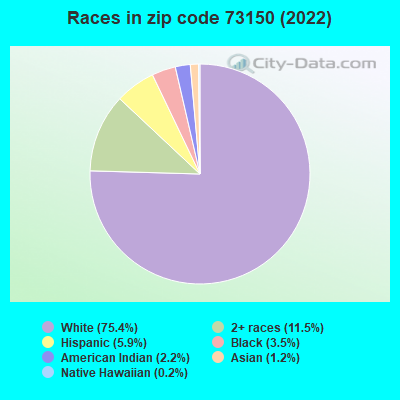
Black race population percentage below state average.
Hispanic race population percentage below state average.
Median age significantly above state average.
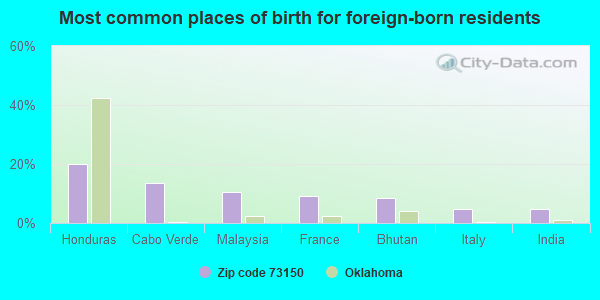
Foreign-born population percentage below state average.
Renting percentage below state average.
Length of stay since moving in significantly above state average.
Averages for the 2020 tax year for zip code 73150, filed in 2021:
Average Adjusted Gross Income (AGI) in 2020: $80,289 (Individual Income Tax Returns)
Here:
$80,289
State:
$63,060
Salary/wage: $67,410 (reported on 76.7% of returns)
Here:
$67,410
State:
$52,427
(% of AGI for various income ranges: 1102.5% for AGIs below $25k, 3004.9% for AGIs $25k-50k, 5720.8% for AGIs $50k-75k, 7472.5% for AGIs $75k-100k, 16380.0% for AGIs $100k-200k, 60880.0% for AGIs over 200k)
Taxable interest for individuals: $1,214 (reported on 46.2% of returns)
This zip code:
$1,214
Oklahoma:
$1,603
(% of AGI for various income ranges: 19.8% for AGIs below $25k, 20.8% for AGIs $25k-50k, 69.6% for AGIs $50k-75k, 126.5% for AGIs $75k-100k, 93.8% for AGIs $100k-200k, 1087.5% for AGIs over 200k)
Ordinary dividends: $3,954 (reported on 19.5% of returns)
Here:
$3,954
State:
$7,001
(% of AGI for various income ranges: 10.9% for AGIs below $25k, 24.4% for AGIs $25k-50k, 80.0% for AGIs $50k-75k, 132.0% for AGIs $75k-100k, 135.6% for AGIs $100k-200k, 1965.0% for AGIs over 200k)
Net capital gain/loss in AGI: +$7,890 (reported on 17.8% of returns)
Here:
+$7,890
State:
+$19,855
(% of AGI for various income ranges: 31.1% for AGIs below $25k, 30.8% for AGIs $25k-50k, 40.8% for AGIs $50k-75k, 187.0% for AGIs $75k-100k, 319.4% for AGIs $100k-200k, 3907.5% for AGIs over 200k)
Profit/loss from business: +$11,949 (reported on 16.5% of returns)
Here:
+$11,949
State:
+$9,904
(% of AGI for various income ranges: 119.5% for AGIs below $25k, 106.4% for AGIs $25k-50k, 100.8% for AGIs $50k-75k, 209.5% for AGIs $75k-100k, 440.6% for AGIs $100k-200k, 4120.0% for AGIs over 200k)
Taxable individual retirement arrangement distribution: $17,100 (reported on 11.0% of returns)
73150:
$17,100
Oklahoma:
$20,476
(% of AGI for various income ranges: 51.1% for AGIs below $25k, 138.5% for AGIs $25k-50k, 172.9% for AGIs $50k-75k, 228.5% for AGIs $75k-100k, 877.8% for AGIs $100k-200k)
Total itemized deductions: $36,417 (reported on 10.2% of returns)
Here:
$36,417
State:
$39,736
(% of AGI for various income ranges: 114.5% for AGIs below $25k, 262.9% for AGIs $50k-75k, 383.5% for AGIs $75k-100k, 1042.8% for AGIs $100k-200k, 8752.5% for AGIs over 200k)
Charity contributions: $12,367 (reported on 8.9% of returns)
Here:
$12,367
State:
$17,288
(% of AGI for various income ranges: 104.6% for AGIs $50k-75k, 112.5% for AGIs $75k-100k, 360.0% for AGIs $100k-200k, 2422.5% for AGIs over 200k)
Taxes paid: $7,796 (reported on 9.7% of returns)
73150:
$7,796
State:
$7,046
(% of AGI for various income ranges: 75.8% for AGIs $50k-75k, 86.0% for AGIs $75k-100k, 263.4% for AGIs $100k-200k, 1490.0% for AGIs over 200k)
Earned income credit: $1,927 (reported on 11.0% of returns)
Here:
$1,927
State:
$2,435
(% of AGI for various income ranges: 64.3% for AGIs below $25k, 55.9% for AGIs $25k-50k)
Percentage of individuals using paid preparers for their 2020 taxes: 92.4%
Here:
92%
State:
94%
(% for various income ranges: 93.1% for AGIs below $25k, 93.8% for AGIs $25k-50k, 90.9% for AGIs $50k-75k, 89.3% for AGIs $75k-100k, 92.7% for AGIs $100k-200k, 92.9% for AGIs over 200k)
Averages for the 2012 tax year for zip code 73150, filed in 2013:
Average Adjusted Gross Income (AGI) in 2012: $73,917 (Individual Income Tax Returns)
Here:
$73,917
State:
$58,581
Salary/wage: $56,949 (reported on 80.7% of returns)
Here:
$56,949
State:
$45,973
(% of AGI for various income ranges: 73.5% for AGIs below $25k, 71.3% for AGIs $25k-50k, 60.8% for AGIs $50k-75k, 68.6% for AGIs $75k-100k, 69.3% for AGIs $100k-200k, 39.3% for AGIs over 200k)
Taxable interest for individuals: $1,102 (reported on 48.2% of returns)
This zip code:
$1,102
Oklahoma:
$1,625
(% of AGI for various income ranges: 0.7% for AGIs below $25k, 0.8% for AGIs $25k-50k, 1.0% for AGIs $50k-75k, 0.7% for AGIs $75k-100k, 0.6% for AGIs $100k-200k, 0.8% for AGIs over 200k)
Ordinary dividends: $3,357 (reported on 19.3% of returns)
Here:
$3,357
State:
$6,374
(% of AGI for various income ranges: 0.9% for AGIs below $25k, 0.7% for AGIs $25k-50k, 0.9% for AGIs $50k-75k, 0.7% for AGIs $75k-100k, 0.7% for AGIs $100k-200k, 1.4% for AGIs over 200k)
Net capital gain/loss in AGI: +$11,150 (reported on 14.7% of returns)
Here:
+$11,150
State:
+$24,023
(% of AGI for various income ranges: 1.1% for AGIs $100k-200k, 8.4% for AGIs over 200k)
Profit/loss from business: +$11,943 (reported on 17.0% of returns)
Here:
+$11,943
State:
+$11,913
(% of AGI for various income ranges: 7.0% for AGIs below $25k, 3.6% for AGIs $25k-50k, 1.4% for AGIs $50k-75k, 1.7% for AGIs $75k-100k, 4.2% for AGIs $100k-200k)
Taxable individual retirement arrangement distribution: $13,142 (reported on 11.0% of returns)
73150:
$13,142
Oklahoma:
$15,242
(% of AGI for various income ranges: 2.8% for AGIs $25k-50k, 2.9% for AGIs $50k-75k, 1.9% for AGIs $75k-100k, 2.9% for AGIs $100k-200k)
Total itemized deductions: $23,680 (19% of AGI, reported on 40.8% of returns)
Here:
$23,680
State:
$24,882
Here:
18.6% of AGI
State:
18.8% of AGI
(% of AGI for various income ranges: 7.2% for AGIs below $25k, 10.5% for AGIs $25k-50k, 12.9% for AGIs $50k-75k, 13.9% for AGIs $75k-100k, 15.2% for AGIs $100k-200k, 11.2% for AGIs over 200k)
Charity contributions: $5,768 (reported on 34.9% of returns)
Here:
$5,768
State:
$6,591
(% of AGI for various income ranges: 0.8% for AGIs below $25k, 1.9% for AGIs $25k-50k, 2.4% for AGIs $50k-75k, 2.5% for AGIs $75k-100k, 3.3% for AGIs $100k-200k, 2.8% for AGIs over 200k)
Taxes paid: $7,792 (reported on 39.9% of returns)
73150:
$7,792
State:
$7,196
(% of AGI for various income ranges: 0.7% for AGIs below $25k, 2.3% for AGIs $25k-50k, 3.2% for AGIs $50k-75k, 4.1% for AGIs $75k-100k, 5.4% for AGIs $100k-200k, 4.3% for AGIs over 200k)
Earned income credit: $1,814 (reported on 13.3% of returns)
Here:
$1,814
State:
$2,354
(% of AGI for various income ranges: 4.7% for AGIs below $25k, 1.0% for AGIs $25k-50k)
Percentage of individuals using paid preparers for their 2012 taxes: 50.5%
Here:
50%
State:
56%
(% for various income ranges: 41.2% for AGIs below $25k, 50.0% for AGIs $25k-50k, 59.3% for AGIs $50k-75k, 57.7% for AGIs $75k-100k, 52.1% for AGIs $100k-200k, 66.7% for AGIs over 200k)
Averages for the 2004 tax year for zip code 73150, filed in 2005:
Average Adjusted Gross Income (AGI) in 2004: $54,265 (Individual Income Tax Returns)
Here:
$54,265
State:
$41,245
Salary/wage: $48,106 (reported on 80.8% of returns)
Here:
$48,106
State:
$35,318
(% of AGI for various income ranges: 107.7% for AGIs below $10k, 68.2% for AGIs $10k-25k, 67.4% for AGIs $25k-50k, 76.1% for AGIs $50k-75k, 80.5% for AGIs $75k-100k, 66.7% for AGIs over 100k)
Taxable interest for individuals: $1,214 (reported on 56.1% of returns)
This zip code:
$1,214
Oklahoma:
$1,745
(% of AGI for various income ranges: 3.5% for AGIs below $10k, 2.5% for AGIs $10k-25k, 1.9% for AGIs $25k-50k, 0.9% for AGIs $50k-75k, 0.8% for AGIs $75k-100k, 1.2% for AGIs over 100k)
Taxable dividends: $1,587 (reported on 24.4% of returns)
Here:
$1,587
State:
$2,920
(% of AGI for various income ranges: 2.6% for AGIs below $10k, 0.9% for AGIs $10k-25k, 0.6% for AGIs $25k-50k, 0.6% for AGIs $50k-75k, 0.6% for AGIs $75k-100k, 0.8% for AGIs over 100k)
Net capital gain/loss: +$3,198 (reported on 19.1% of returns)
Here:
+$3,198
State:
+$10,653
(% of AGI for various income ranges: -1.4% for AGIs below $10k, -0.6% for AGIs $10k-25k, -0.3% for AGIs $25k-50k, 0.1% for AGIs $50k-75k, 0.8% for AGIs $75k-100k, 2.4% for AGIs over 100k)
Profit/loss from business: +$9,980 (reported on 17.8% of returns)
Here:
+$9,980
State:
+$8,532
(% of AGI for various income ranges: 17.7% for AGIs below $10k, 2.7% for AGIs $10k-25k, 3.0% for AGIs $25k-50k, 1.8% for AGIs $50k-75k, 1.7% for AGIs $75k-100k, 4.3% for AGIs over 100k)
IRA payment deduction: $3,577 (reported on 2.6% of returns)
73150:
$3,577
Oklahoma:
$3,127
Self-employed pension: $15,733 (reported on 0.8% of returns)
Here:
$15,733
Oklahoma:
$14,276
Total itemized deductions: $18,546 (21% of AGI, reported on 46.1% of returns)
Here:
$18,546
State:
$17,093
Here:
20.6% of AGI
State:
20.5% of AGI
(% of AGI for various income ranges: 7.1% for AGIs below $10k, 14.0% for AGIs $10k-25k, 13.9% for AGIs $25k-50k, 16.1% for AGIs $50k-75k, 17.7% for AGIs $75k-100k, 15.8% for AGIs over 100k)
Charity contributions deductions: $4,227 (5% of AGI, reported on 42.1% of returns)
Here:
$4,227
State:
$4,240
Here:
4.5% of AGI
State:
4.8% of AGI
(% of AGI for various income ranges: 2.1% for AGIs $10k-25k, 2.4% for AGIs $25k-50k, 3.3% for AGIs $50k-75k, 3.3% for AGIs $75k-100k, 3.8% for AGIs over 100k)
Total tax: $7,948 (reported on 79.1% of returns)
73150:
$7,948
State:
$6,542
(% of AGI for various income ranges: 4.6% for AGIs below $10k, 3.8% for AGIs $10k-25k, 6.3% for AGIs $25k-50k, 8.6% for AGIs $50k-75k, 10.2% for AGIs $75k-100k, 16.3% for AGIs over 100k)
Earned income credit: $1,698 (reported on 11.9% of returns)
Here:
$1,698
State:
$1,830
Percentage of individuals using paid preparers for their 2004 taxes: 52.9%
Here:
53%
State:
63%
(% for various income ranges: 39.8% for AGIs below $10k, 53.7% for AGIs $10k-25k, 60.7% for AGIs $25k-50k, 57.8% for AGIs $50k-75k, 53.4% for AGIs $75k-100k, 52.2% for AGIs over 100k)
Household received Food Stamps/SNAP in the past 12 months: 129 Household did not receive Food Stamps/SNAP in the past 12 months: 1,931
Women who had a birth in the past 12 months: 14 (14 now married, 0 unmarried) Women who did not have a birth in the past 12 months: 1,075 (597 now married, 477 unmarried)
Housing units in zip code 73150 with a mortgage: 1,000 (97 second mortgage, 44 both second mortgage and home equity loan) Houses without a mortgage: 10
Median monthly owner costs for units with a mortgage: $1,945 Median monthly owner costs for units without a mortgage: $653
Residents with income below the poverty level in 2022:
This zip code:
8.0%
Whole state:
15.7%
Residents with income below 50% of the poverty level in 2022:
This zip code:
3.5%
Whole state:
8.3%
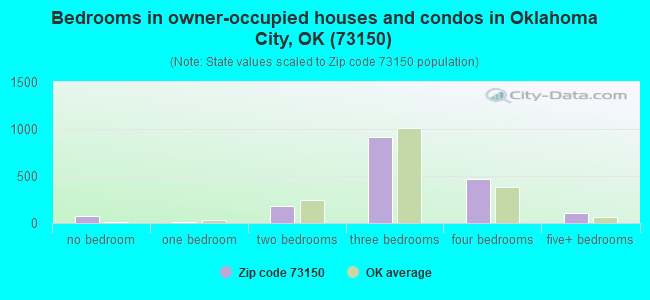
Median number of rooms in houses and condos:
Here:
7.0
State:
6.1
Median number of rooms in apartments:
Here:
10.0
State:
4.5
Notable locations in this zip code not listed on our city pages
Churches in zip code 73150 include: Seventh Day Adventist Church (A), Family Cathedral of Praise Church (B), Prayer of Faith World Outreach Center (C), Pentecostal Holiness Oklahoma Conference (D), Mishak Baptist Church (E), Living Waters Tabernacle Church (F), Life Christian Ministries Incorporated Church (G), Crestview Baptist Church (H), Church of God Through Christ (I). Display/hide their locations on the map
Size of family households: 684 2-persons, 289 3-persons, 352 4-persons, 97 5-persons, 57 6-persons, 70 7-or-more-persons
Size of nonfamily households: 497 1-person, 38 2-persons
1,053 married couples with children.
113 single-parent households (27 men, 86 women).
95.2% of residents of 73150 zip code speak English at home.
3.3% of residents speak Spanish at home (76% very well, 14% well, 10% not well).
0.4% of residents speak other Indo-European language at home (100% very well).
0.7% of residents speak Asian or Pacific Island language at home (26% very well, 69% well, 5% not well).
0.3% of residents speak other language at home (82% very well, 18% not well).
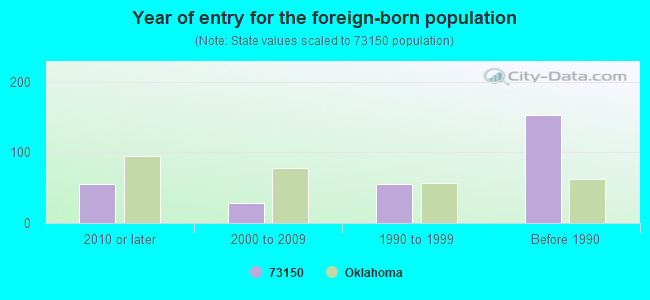
Foreign born population: 164 (2.8%) (80.1% of them are naturalized citizens)
Facilities with environmental interests located in this zip code:
BARNES ES (10551 S.E. 59TH STREET in OKLAHOMA CITY, OK)
(National Center for Education Statistics) - STATE ID-55-I052-105 Organizations: MWC/DEL CITY (SCHOOL DISTRICT)
DAVIS PAINT & COLLISION INC (10830 SE 29TH in OKLAHOMA CITY, OK)
Conditionally Exempt Small Quantity Generators, less than 100 kg/month of hazardous waste (Resource Conservation and Recovery Act (tracking hazardous waste)) - notification Organizations: GARY & BRENDA WILLIAMS (CONTACT/OWNER)
Housing units lacking complete plumbing facilities: 1.4% Housing units lacking complete kitchen facilities: 0.8%
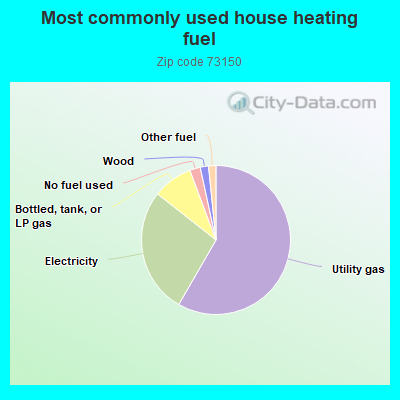
58.4%Utility gas
27.3%Electricity
8.7%Bottled, tank, or LP gas
2.3%No fuel used
1.8%Wood
1.6%Other fuel
Population in 1990: 4,512. Population change in the 1990s: +160 (+3.5%).
Place of birth for U.S.-born residents:
This state: 3,158
Northeast: 147
Midwest: 813
South: 876
West: 526
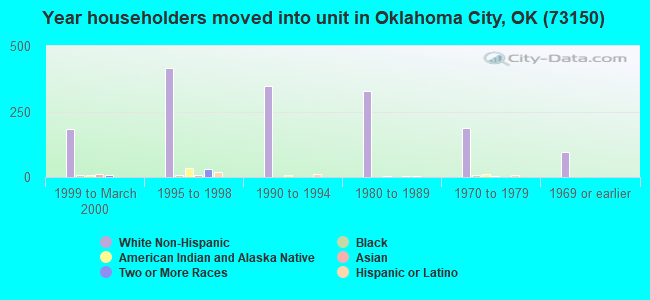
58% of the 73150 zip code residents lived in the same house 5 years ago. Out of people who lived in different houses, 74% lived in this county. Out of people who lived in different counties, 50% lived in Oklahoma.
90% of the 73150 zip code residents lived in the same house 1 year ago. Out of people who lived in different houses, 28% moved from this county. Out of people who lived in different houses, 37% moved from different county within same state. Out of people who lived in different houses, 40% moved from different state. Out of people who lived in different houses, 2% moved from abroad.
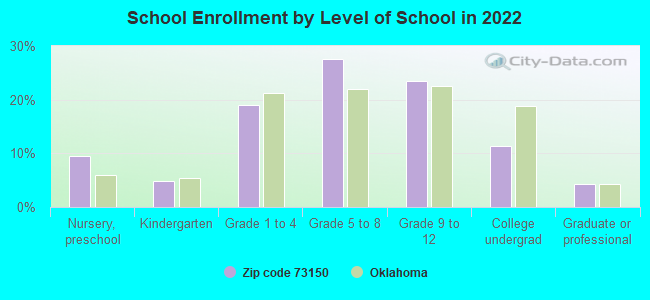
Private vs. public school enrollment:
Students in private schools in grades 1 to 8 (elementary and middle school): 220
Here:
29.8%
Oklahoma:
11.7%
Students in private schools in grades 9 to 12 (high school): 99
Here:
27.2%
Oklahoma:
11.7%
Students in private undergraduate colleges: 27
Here:
15.4%
Oklahoma:
19.3%
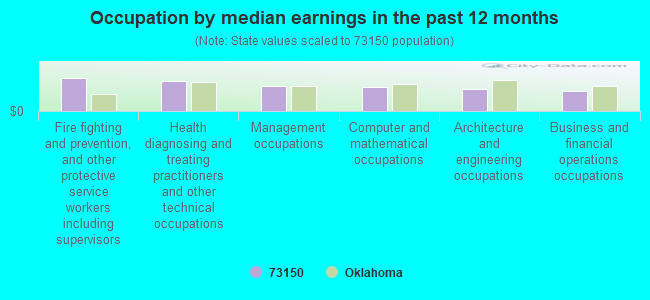
Occupation by median earnings in the past 12 months ($)
123,445Fire fighting and prevention, and other protective service workers including supervisors
112,397Health diagnosing and treating practitioners and other technical occupations
92,593Management occupations
89,107Computer and mathematical occupations
79,933Architecture and engineering occupations
74,675Business and financial operations occupations
Companies with federal contracts located in this zip code (OKLAHOMA CITY, OK):
MIDWEST CONTAINER COMPANY (9100 SE 49TH STREET; small business) : $7,438,727 in 24 contractsfrom 1999 to 2006
Contracts for Trash/Garbage Collection Services - Including Portable Sanitation Services by Air Force Signed by year:2000: $287,467; 2001: $2,250,785; 2002: $1,080,110; 2003: $1,036,750; 2004: $1,196,116; 2005: $253,348; 2006: $196,733.
Biggest contracts:
$1,232,031 with Air Force for Trash/Garbage Collection Services - Including Portable Sanitation Services. Signed on 2001-11-29. Completion date: 2002-09-30.
$1,225,909, same as above.Signed on 2004-10-01. Completion date: 2005-09-30.
$1,166,714, same as above.Signed on 2003-12-02. Completion date: 2004-09-30.
$1,164,672, same as above.Signed on 2002-12-13. Completion date: 2003-09-30.
WILLIAM STOVER (4817 ROBIN HILL LN; small business) : $95,000 in 2 contractsfrom 2005 to 2006
$85,000 with Air Force for Recreational Services. Signed on 2005-10-01. Completion date: 2006-09-30.
$10,000, same as above.Signed on 2006-03-24. Completion date: 2006-09-30.
ROY MILLS CONST CO (11501 BURNING OAKS DR; small business)
$66,005 with Air Force for Maintenance, Repair and Rebuilding of Equipment -- Maintenance and Repair Shop Equipment. Signed on 2001-05-30. Completion date: 2001-08-31.
DAVES S & S PAINT & BODY SHOP (4102 S DOUGLAS BOULEVARD; small business)
$50,000 with Air Force for Maintenance, Repair and Rebuilding of Equipment -- Ground Effect Vehicles, Motor Vehicles, Trailers, and Cycles. Signed on 2005-10-01. Completion date: 2006-09-30.
Top industries in this zip code by the number of employees in 2005:
Construction: Other Heavy and Civil Engineering Construction (100-249 employees: 1 establishment, 1-4 employees: 1 establishment)
Accommodation and Food Services: Full-Service Restaurants (20-49: 1, 1-4: 1)
Construction: Highway, Street, and Bridge Construction (20-49: 1)
Educational Services: Elementary and Secondary Schools (20-49: 1)
Other Services (except Public Administration): Religious Organizations (10-19: 1, 5-9: 1, 1-4: 1)
Construction: Plumbing, Heating, and Air-Conditioning Contractors (5-9: 3)
Other Services (except Public Administration): Footwear and Leather Goods Repair (10-19: 1)
Construction: New Single-Family Housing Construction (except Operative Builders) (5-9: 1, 1-4: 2)
Real Estate and Rental and Leasing: Nonresidential Property Managers (5-9: 1, 1-4: 1)
Fatal accident statistics in 2014:
Fatal accident count: 2
Vehicles involved in fatal accidents: 3
Fatal accidents caused by drunken drivers: 1
Fatalities: 3
Persons involved in fatal accidents: 6
Pedestrians involved in fatal accidents: 0
Fatal accident statistics in 2013:
Fatal accident count: 2
Vehicles involved in fatal accidents: 5
Fatal accidents caused by drunken drivers: 0
Fatalities: 2
Persons involved in fatal accidents: 7
Pedestrians involved in fatal accidents: 1
Home Mortgage Disclosure Act Aggregated Statistics For Year 2009 (Based on 1 full and 4 partial tracts)
A) FHA, FSA/RHS & VA Home Purchase Loans
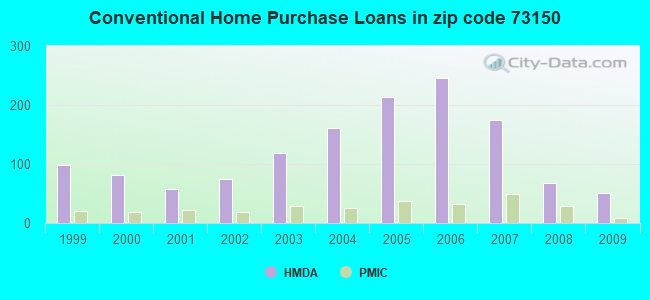
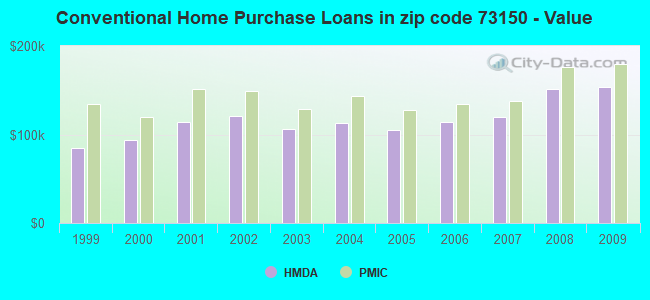
B) Conventional Home Purchase Loans
C) Refinancings
D) Home Improvement Loans
F) Non-occupant Loans on < 5 Family Dwellings (A B C & D)
G) Loans On Manufactured Home Dwelling (A B C & D)
Number
Average Value
Number
Average Value
Number
Average Value
Number
Average Value
Number
Average Value
Number
Average Value
LOANS ORIGINATED
107
$162,799
51
$153,676
285
$152,390
52
$37,194
14
$105,788
11
$86,379
APPLICATIONS APPROVED, NOT ACCEPTED
4
$136,360
6
$83,502
30
$180,239
3
$35,560
2
$151,360
4
$29,428
APPLICATIONS DENIED
7
$125,489
11
$207,042
103
$157,737
32
$22,038
9
$112,882
7
$40,514
APPLICATIONS WITHDRAWN
10
$153,014
6
$87,100
78
$160,871
7
$65,037
3
$92,323
3
$90,000
FILES CLOSED FOR INCOMPLETENESS
1
$132,970
1
$38,980
13
$178,175
0
$0
0
$0
1
$38,980
Aggregated Statistics For Year 2008 (Based on 1 full and 4 partial tracts)
A) FHA, FSA/RHS & VA Home Purchase Loans
B) Conventional Home Purchase Loans
C) Refinancings
D) Home Improvement Loans
F) Non-occupant Loans on < 5 Family Dwellings (A B C & D)
G) Loans On Manufactured Home Dwelling (A B C & D)
Number
Average Value
Number
Average Value
Number
Average Value
Number
Average Value
Number
Average Value
Number
Average Value
LOANS ORIGINATED
107
$153,628
68
$151,502
123
$131,931
60
$41,015
17
$156,368
18
$49,638
APPLICATIONS APPROVED, NOT ACCEPTED
6
$121,810
12
$115,449
25
$152,324
7
$44,129
1
$118,120
7
$53,501
APPLICATIONS DENIED
7
$194,994
16
$81,331
104
$151,346
45
$37,760
8
$53,538
7
$53,690
APPLICATIONS WITHDRAWN
3
$100,647
8
$123,426
41
$153,515
6
$75,177
3
$26,683
2
$119,275
FILES CLOSED FOR INCOMPLETENESS
1
$126,980
3
$160,320
11
$133,033
1
$5,000
1
$93,980
0
$0
Aggregated Statistics For Year 2007 (Based on 1 full and 4 partial tracts)
A) FHA, FSA/RHS & VA Home Purchase Loans
B) Conventional Home Purchase Loans
C) Refinancings
D) Home Improvement Loans
E) Loans on Dwellings For 5+ Families
F) Non-occupant Loans on < 5 Family Dwellings (A B C & D)
G) Loans On Manufactured Home Dwelling (A B C & D)
Number
Average Value
Number
Average Value
Number
Average Value
Number
Average Value
Number
Average Value
Number
Average Value
Number
Average Value
LOANS ORIGINATED
81
$141,488
175
$119,819
132
$118,916
68
$27,122
1
$2,754,450
23
$91,454
14
$68,016
APPLICATIONS APPROVED, NOT ACCEPTED
1
$151,970
17
$86,823
32
$119,477
9
$28,268
0
$0
1
$38,390
8
$48,519
APPLICATIONS DENIED
6
$126,980
31
$114,557
126
$140,721
34
$33,998
0
$0
7
$112,681
11
$85,056
APPLICATIONS WITHDRAWN
5
$159,384
12
$138,559
53
$151,563
9
$54,517
0
$0
3
$114,447
2
$127,555
FILES CLOSED FOR INCOMPLETENESS
0
$0
8
$151,420
13
$130,125
2
$103,495
0
$0
1
$147,970
0
$0
Aggregated Statistics For Year 2006 (Based on 1 full and 4 partial tracts)
A) FHA, FSA/RHS & VA Home Purchase Loans
B) Conventional Home Purchase Loans
C) Refinancings
D) Home Improvement Loans
F) Non-occupant Loans on < 5 Family Dwellings (A B C & D)
G) Loans On Manufactured Home Dwelling (A B C & D)
Number
Average Value
Number
Average Value
Number
Average Value
Number
Average Value
Number
Average Value
Number
Average Value
LOANS ORIGINATED
73
$144,945
246
$114,269
158
$108,472
74
$29,223
23
$73,610
8
$57,731
APPLICATIONS APPROVED, NOT ACCEPTED
1
$76,980
28
$82,483
37
$135,604
10
$51,713
4
$88,525
13
$47,167
APPLICATIONS DENIED
4
$121,725
44
$88,630
136
$136,256
43
$34,602
11
$79,772
20
$56,326
APPLICATIONS WITHDRAWN
5
$166,160
29
$129,297
96
$136,618
9
$76,317
4
$80,478
4
$98,302
FILES CLOSED FOR INCOMPLETENESS
0
$0
13
$121,198
17
$143,663
1
$75,980
0
$0
0
$0
Aggregated Statistics For Year 2005 (Based on 1 full and 4 partial tracts)
A) FHA, FSA/RHS & VA Home Purchase Loans
B) Conventional Home Purchase Loans
C) Refinancings
D) Home Improvement Loans
F) Non-occupant Loans on < 5 Family Dwellings (A B C & D)
G) Loans On Manufactured Home Dwelling (A B C & D)
Number
Average Value
Number
Average Value
Number
Average Value
Number
Average Value
Number
Average Value
Number
Average Value
LOANS ORIGINATED
95
$136,866
213
$105,256
178
$116,548
75
$35,031
23
$80,923
22
$58,254
APPLICATIONS APPROVED, NOT ACCEPTED
5
$125,580
34
$75,598
36
$108,015
3
$21,860
10
$51,890
12
$56,874
APPLICATIONS DENIED
20
$123,334
51
$90,249
164
$130,059
54
$33,855
10
$68,939
18
$51,569
APPLICATIONS WITHDRAWN
0
$0
33
$105,453
144
$128,211
21
$79,793
9
$106,894
0
$0
FILES CLOSED FOR INCOMPLETENESS
0
$0
8
$128,458
34
$144,835
5
$34,594
0
$0
0
$0
Aggregated Statistics For Year 2004 (Based on 1 full and 4 partial tracts)
A) FHA, FSA/RHS & VA Home Purchase Loans
B) Conventional Home Purchase Loans
C) Refinancings
D) Home Improvement Loans
F) Non-occupant Loans on < 5 Family Dwellings (A B C & D)
G) Loans On Manufactured Home Dwelling (A B C & D)
Number
Average Value
Number
Average Value
Number
Average Value
Number
Average Value
Number
Average Value
Number
Average Value
LOANS ORIGINATED
84
$131,449
161
$112,902
231
$115,216
60
$30,109
17
$116,426
11
$49,323
APPLICATIONS APPROVED, NOT ACCEPTED
5
$106,786
20
$91,314
40
$102,791
7
$57,736
5
$70,558
6
$38,948
APPLICATIONS DENIED
8
$113,831
55
$66,194
125
$127,533
37
$30,766
5
$50,406
34
$42,035
APPLICATIONS WITHDRAWN
10
$143,237
18
$118,170
127
$113,672
11
$24,003
4
$41,150
1
$83,870
FILES CLOSED FOR INCOMPLETENESS
3
$88,660
6
$85,533
31
$123,458
2
$23,380
0
$0
0
$0
Aggregated Statistics For Year 2003 (Based on 1 full and 4 partial tracts)
A) FHA, FSA/RHS & VA Home Purchase Loans
B) Conventional Home Purchase Loans
C) Refinancings
D) Home Improvement Loans
F) Non-occupant Loans on < 5 Family Dwellings (A B C & D)
Number
Average Value
Number
Average Value
Number
Average Value
Number
Average Value
Number
Average Value
LOANS ORIGINATED
70
$126,397
118
$106,330
506
$111,800
40
$21,204
23
$53,722
APPLICATIONS APPROVED, NOT ACCEPTED
3
$120,720
17
$99,554
72
$120,736
7
$38,344
2
$72,385
APPLICATIONS DENIED
2
$158,970
45
$53,702
174
$104,343
25
$26,459
7
$53,376
APPLICATIONS WITHDRAWN
6
$132,765
24
$107,366
102
$120,212
2
$18,500
2
$20,245
FILES CLOSED FOR INCOMPLETENESS
2
$97,915
2
$99,515
32
$117,655
2
$47,195
2
$91,465
Aggregated Statistics For Year 2002 (Based on 1 full and 2 partial tracts)
A) FHA, FSA/RHS & VA Home Purchase Loans
B) Conventional Home Purchase Loans
C) Refinancings
D) Home Improvement Loans
F) Non-occupant Loans on < 5 Family Dwellings (A B C & D)
Number
Average Value
Number
Average Value
Number
Average Value
Number
Average Value
Number
Average Value
LOANS ORIGINATED
24
$134,142
75
$120,719
201
$116,832
27
$14,837
10
$61,539
APPLICATIONS APPROVED, NOT ACCEPTED
1
$60,830
5
$98,414
28
$123,496
3
$57,867
1
$17,720
APPLICATIONS DENIED
1
$45,480
27
$63,146
50
$96,052
7
$16,554
3
$42,297
APPLICATIONS WITHDRAWN
1
$113,990
7
$108,794
36
$113,599
1
$23,030
0
$0
FILES CLOSED FOR INCOMPLETENESS
0
$0
2
$179,905
19
$141,902
0
$0
1
$29,530
Aggregated Statistics For Year 2001 (Based on 1 full and 2 partial tracts)
A) FHA, FSA/RHS & VA Home Purchase Loans
B) Conventional Home Purchase Loans
C) Refinancings
D) Home Improvement Loans
F) Non-occupant Loans on < 5 Family Dwellings (A B C & D)
Number
Average Value
Number
Average Value
Number
Average Value
Number
Average Value
Number
Average Value
LOANS ORIGINATED
21
$120,439
58
$113,866
128
$111,671
36
$18,230
6
$62,912
APPLICATIONS APPROVED, NOT ACCEPTED
0
$0
9
$82,238
22
$85,585
1
$25,990
1
$67,000
APPLICATIONS DENIED
0
$0
20
$51,039
47
$89,053
12
$10,348
2
$73,785
APPLICATIONS WITHDRAWN
0
$0
7
$102,916
31
$117,652
2
$26,870
0
$0
FILES CLOSED FOR INCOMPLETENESS
1
$74,420
1
$12,400
12
$89,562
0
$0
0
$0
Aggregated Statistics For Year 2000 (Based on 1 full and 2 partial tracts)
A) FHA, FSA/RHS & VA Home Purchase Loans
B) Conventional Home Purchase Loans
C) Refinancings
D) Home Improvement Loans
F) Non-occupant Loans on < 5 Family Dwellings (A B C & D)
Number
Average Value
Number
Average Value
Number
Average Value
Number
Average Value
Number
Average Value
LOANS ORIGINATED
17
$120,611
81
$93,911
57
$90,393
35
$24,186
7
$33,117
APPLICATIONS APPROVED, NOT ACCEPTED
0
$0
16
$46,649
7
$48,276
6
$33,367
1
$44,890
APPLICATIONS DENIED
3
$87,397
44
$48,826
29
$81,553
22
$19,833
4
$56,875
APPLICATIONS WITHDRAWN
2
$82,765
7
$98,486
15
$75,525
4
$25,388
0
$0
FILES CLOSED FOR INCOMPLETENESS
0
$0
0
$0
6
$78,783
0
$0
0
$0
Aggregated Statistics For Year 1999 (Based on 1 full and 2 partial tracts)
A) FHA, FSA/RHS & VA Home Purchase Loans
B) Conventional Home Purchase Loans
C) Refinancings
D) Home Improvement Loans
E) Loans on Dwellings For 5+ Families
F) Non-occupant Loans on < 5 Family Dwellings (A B C & D)
2002 - 2018 National Fire Incident Reporting System (NFIRS) incidents
According to the data from the years 2002 - 2018 the average number of fire incidents per year is 46. The highest number of reported fire incidents - 75 took place in 2011, and the least - 30 in 2014. The data has a decreasing trend.
When looking into fire subcategories, the most reports belonged to: Outside Fires (63.2%), and Mobile Property/Vehicle Fires (19.5%).
Fire incident types reported to NFIRS in Zip Code 73150


 Nearest zip codes: 73165, 73130, 73145, 73020, 73110, 73066.


 According to the data from the years 2002 - 2018 the average number of fire incidents per year is 46. The highest number of reported fire incidents - 75 took place in 2011, and the least - 30 in 2014. The data has a decreasing trend.
 When looking into fire subcategories, the most reports belonged to: Outside Fires (63.2%), and Mobile Property/Vehicle Fires (19.5%).