Estimated zip code population in 2022: 29,519 Zip code population in 2010: 27,951 Zip code population in 2000: 26,621
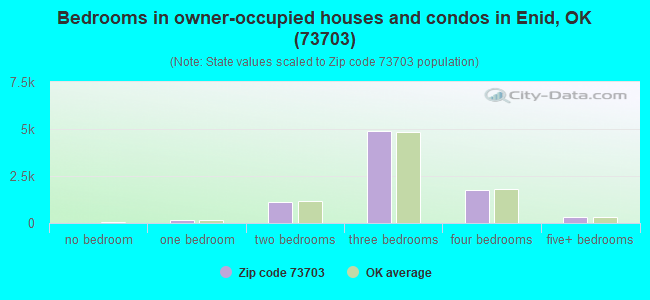
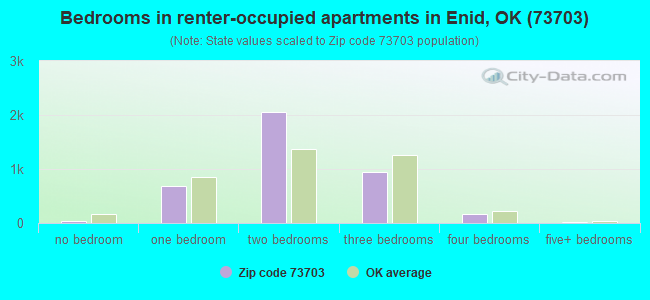
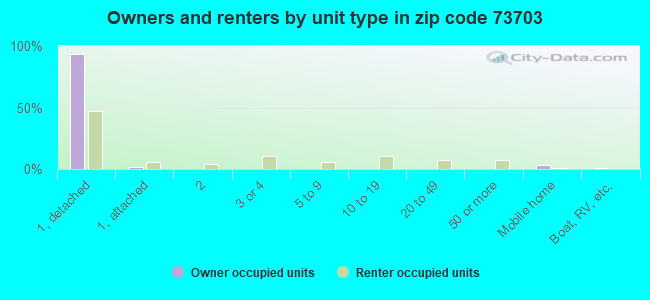
Houses and condos: 13,538 Renter-occupied apartments: 3,917
% of renters here:
32%
State:
35%
March 2022 cost of living index in zip code 73703: 81.0 (low, U.S. average is 100)
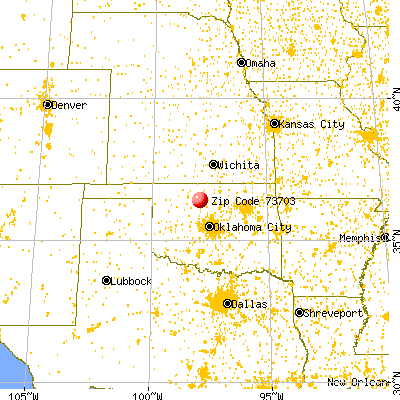
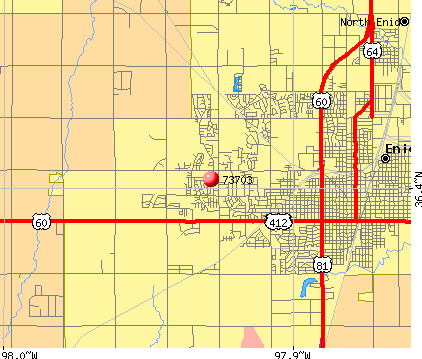
Land area: 113.4 sq. mi. Water area: 0.1 sq. mi.
Population density: 260 people per square mile
(very low).
OSM Map
General Map
Google Map
MSN Map
OSM Map
General Map
Google Map
MSN Map
OSM Map
General Map
Google Map
MSN Map
OSM Map
General Map
Google Map
MSN Map
Please wait while loading the map...
Real estate property taxes paid for housing units in 2022:
This zip code:
0.9% ($1,820)
Oklahoma:
0.8% ($1,501)
Median real estate property taxes paid for housing units with mortgages in 2022: $1,846 (0.9%) Median real estate property taxes paid for housing units with no mortgage in 2022: $1,753 (0.9%)
Business Search- 14 Million verified businesses
Males: 14,463
(49.0%)
Females: 15,056
(51.0%)
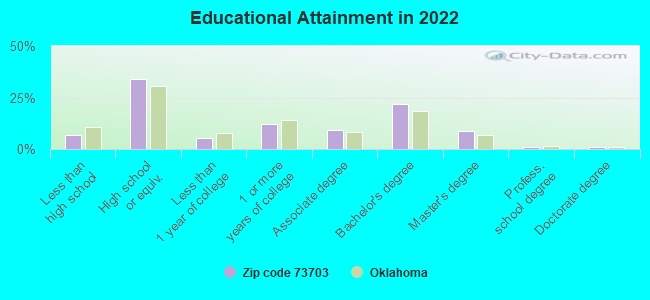
For population 25 years and over in 73703:
High school or higher: 94.0%
Bachelor's degree or higher: 32.8%
Graduate or professional degree: 10.7%
Unemployed: 3.2%
Mean travel time to work (commute): 17.5 minutes
For population 15 years and over in 73703:
Never married: 26.4%
Now married: 54.2%
Separated: 1.0%
Widowed: 6.6%
Divorced: 11.8%
Zip code 73703 compared to state average:
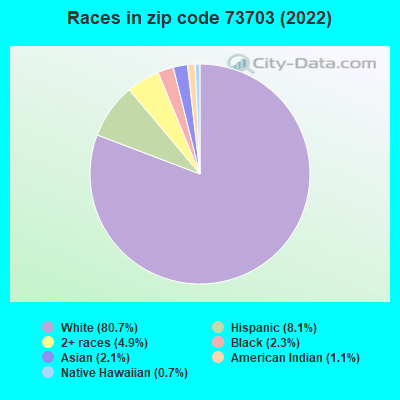
Black race population percentage significantly below state average.
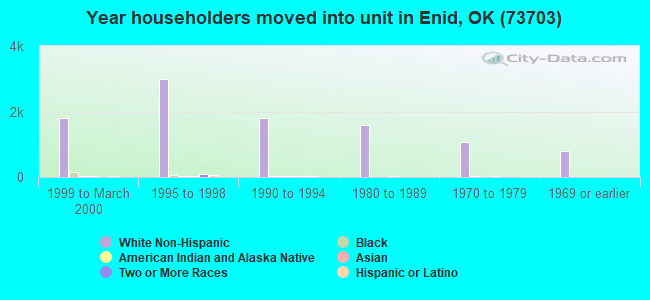
Length of stay since moving in above state average.
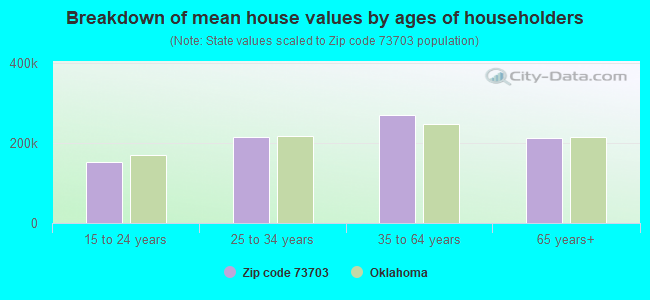
Estimated median house/condo value in 2022: $197,209
73703:
$197,209
Oklahoma:
$191,700
According to our research of Oklahoma and other state lists, there were 14 registered sex offenders living in 73703 zip code as of April 27, 2024. The ratio of all residents to sex offenders in zip code 73703 is 2,149 to 1. The ratio of registered sex offenders to all residents in this zip code is much lower than the state average.
Median resident age:
This zip code:
38.2 years
Oklahoma median age:
37.1 years
Average household size:
This zip code:
2.4 people
Oklahoma:
2.5 people
Averages for the 2020 tax year for zip code 73703, filed in 2021:
Average Adjusted Gross Income (AGI) in 2020: $67,714 (Individual Income Tax Returns)
Here:
$67,714
State:
$63,060
Salary/wage: $54,385 (reported on 80.1% of returns)
Here:
$54,385
State:
$52,427
(% of AGI for various income ranges: 1126.4% for AGIs below $25k, 3417.5% for AGIs $25k-50k, 6088.8% for AGIs $50k-75k, 9013.8% for AGIs $75k-100k, 16103.0% for AGIs $100k-200k, 58597.9% for AGIs over 200k)
Taxable interest for individuals: $2,193 (reported on 38.1% of returns)
This zip code:
$2,193
Oklahoma:
$1,603
(% of AGI for various income ranges: 19.2% for AGIs below $25k, 32.2% for AGIs $25k-50k, 60.3% for AGIs $50k-75k, 94.9% for AGIs $75k-100k, 175.9% for AGIs $100k-200k, 4058.6% for AGIs over 200k)
Ordinary dividends: $7,681 (reported on 21.7% of returns)
Here:
$7,681
State:
$7,001
(% of AGI for various income ranges: 26.6% for AGIs below $25k, 46.1% for AGIs $25k-50k, 93.5% for AGIs $50k-75k, 214.3% for AGIs $75k-100k, 439.7% for AGIs $100k-200k, 8086.4% for AGIs over 200k)
Net capital gain/loss in AGI: +$16,744 (reported on 19.9% of returns)
Here:
+$16,744
State:
+$19,855
(% of AGI for various income ranges: 14.8% for AGIs below $25k, 44.1% for AGIs $25k-50k, 111.2% for AGIs $50k-75k, 212.0% for AGIs $75k-100k, 654.9% for AGIs $100k-200k, 22179.3% for AGIs over 200k)
Profit/loss from business: +$10,051 (reported on 17.7% of returns)
Here:
+$10,051
State:
+$9,904
(% of AGI for various income ranges: 107.2% for AGIs below $25k, 60.8% for AGIs $25k-50k, 71.0% for AGIs $50k-75k, 174.5% for AGIs $75k-100k, 554.7% for AGIs $100k-200k, 6710.0% for AGIs over 200k)
Taxable individual retirement arrangement distribution: $17,531 (reported on 10.6% of returns)
73703:
$17,531
Oklahoma:
$20,476
(% of AGI for various income ranges: 62.8% for AGIs below $25k, 97.6% for AGIs $25k-50k, 215.6% for AGIs $50k-75k, 411.5% for AGIs $75k-100k, 709.8% for AGIs $100k-200k, 3305.0% for AGIs over 200k)
Self-employed (Keogh) retirement plans: $20,320 (reported on 0.4% of returns)
73703:
$20,320
Oklahoma:
$23,482
(% of AGI for various income ranges: 22.5% for AGIs $75k-100k, 566.4% for AGIs over 200k)
Total itemized deductions: $35,333 (reported on 8.1% of returns)
Here:
$35,333
State:
$39,736
(% of AGI for various income ranges: 50.0% for AGIs below $25k, 129.0% for AGIs $25k-50k, 277.4% for AGIs $50k-75k, 461.6% for AGIs $75k-100k, 1004.1% for AGIs $100k-200k, 9055.7% for AGIs over 200k)
Charity contributions: $14,460 (reported on 7.0% of returns)
Here:
$14,460
State:
$17,288
(% of AGI for various income ranges: 5.6% for AGIs below $25k, 23.5% for AGIs $25k-50k, 65.0% for AGIs $50k-75k, 110.7% for AGIs $75k-100k, 332.4% for AGIs $100k-200k, 4760.7% for AGIs over 200k)
Taxes paid: $6,430 (reported on 8.0% of returns)
73703:
$6,430
State:
$7,046
(% of AGI for various income ranges: 4.6% for AGIs below $25k, 17.6% for AGIs $25k-50k, 41.1% for AGIs $50k-75k, 85.9% for AGIs $75k-100k, 226.5% for AGIs $100k-200k, 1505.7% for AGIs over 200k)
Earned income credit: $2,511 (reported on 16.0% of returns)
Here:
$2,511
State:
$2,435
(% of AGI for various income ranges: 100.1% for AGIs below $25k, 78.8% for AGIs $25k-50k, 1.8% for AGIs $50k-75k)
Percentage of individuals using paid preparers for their 2020 taxes: 94.5%
Here:
95%
State:
94%
(% for various income ranges: 93.6% for AGIs below $25k, 95.5% for AGIs $25k-50k, 94.4% for AGIs $50k-75k, 93.7% for AGIs $75k-100k, 94.9% for AGIs $100k-200k, 95.9% for AGIs over 200k)
Averages for the 2012 tax year for zip code 73703, filed in 2013:
Average Adjusted Gross Income (AGI) in 2012: $75,136 (Individual Income Tax Returns)
Here:
$75,136
State:
$58,581
Salary/wage: $51,263 (reported on 81.7% of returns)
Here:
$51,263
State:
$45,973
(% of AGI for various income ranges: 74.7% for AGIs below $25k, 77.8% for AGIs $25k-50k, 74.4% for AGIs $50k-75k, 73.5% for AGIs $75k-100k, 67.9% for AGIs $100k-200k, 26.5% for AGIs over 200k)
Taxable interest for individuals: $1,948 (reported on 42.2% of returns)
This zip code:
$1,948
Oklahoma:
$1,625
(% of AGI for various income ranges: 1.8% for AGIs below $25k, 1.2% for AGIs $25k-50k, 1.0% for AGIs $50k-75k, 0.8% for AGIs $75k-100k, 0.8% for AGIs $100k-200k, 1.3% for AGIs over 200k)
Ordinary dividends: $8,190 (reported on 22.8% of returns)
Here:
$8,190
State:
$6,374
(% of AGI for various income ranges: 1.8% for AGIs below $25k, 1.2% for AGIs $25k-50k, 1.2% for AGIs $50k-75k, 1.4% for AGIs $75k-100k, 1.6% for AGIs $100k-200k, 4.3% for AGIs over 200k)
Net capital gain/loss in AGI: +$22,697 (reported on 18.8% of returns)
Here:
+$22,697
State:
+$24,023
(% of AGI for various income ranges: 0.7% for AGIs $25k-50k, 0.9% for AGIs $50k-75k, 1.2% for AGIs $75k-100k, 2.1% for AGIs $100k-200k, 13.4% for AGIs over 200k)
Profit/loss from business: +$13,882 (reported on 16.9% of returns)
Here:
+$13,882
State:
+$11,913
(% of AGI for various income ranges: 5.4% for AGIs below $25k, 2.3% for AGIs $25k-50k, 2.9% for AGIs $50k-75k, 2.4% for AGIs $75k-100k, 3.2% for AGIs $100k-200k, 3.3% for AGIs over 200k)
Taxable individual retirement arrangement distribution: $14,396 (reported on 12.5% of returns)
73703:
$14,396
Oklahoma:
$15,242
(% of AGI for various income ranges: 3.4% for AGIs below $25k, 2.6% for AGIs $25k-50k, 2.4% for AGIs $50k-75k, 2.5% for AGIs $75k-100k, 3.3% for AGIs $100k-200k, 1.6% for AGIs over 200k)
Self-employment retirement plans: $16,900 (reported on 0.7% of returns)
73703:
$16,900
Oklahoma:
$20,266
Total itemized deductions: $24,472 (16% of AGI, reported on 30.6% of returns)
Here:
$24,472
State:
$24,882
Here:
15.6% of AGI
State:
18.8% of AGI
(% of AGI for various income ranges: 9.6% for AGIs below $25k, 8.8% for AGIs $25k-50k, 9.2% for AGIs $50k-75k, 10.6% for AGIs $75k-100k, 12.4% for AGIs $100k-200k, 9.1% for AGIs over 200k)
Charity contributions: $6,960 (reported on 25.7% of returns)
Here:
$6,960
State:
$6,591
(% of AGI for various income ranges: 1.3% for AGIs below $25k, 1.5% for AGIs $25k-50k, 1.8% for AGIs $50k-75k, 2.2% for AGIs $75k-100k, 3.0% for AGIs $100k-200k, 2.7% for AGIs over 200k)
Taxes paid: $7,854 (reported on 30.5% of returns)
73703:
$7,854
State:
$7,196
(% of AGI for various income ranges: 1.2% for AGIs below $25k, 1.5% for AGIs $25k-50k, 2.0% for AGIs $50k-75k, 2.9% for AGIs $75k-100k, 4.1% for AGIs $100k-200k, 4.0% for AGIs over 200k)
Earned income credit: $2,206 (reported on 15.1% of returns)
Here:
$2,206
State:
$2,354
(% of AGI for various income ranges: 5.8% for AGIs below $25k, 1.1% for AGIs $25k-50k)
Percentage of individuals using paid preparers for their 2012 taxes: 53.4%
Here:
53%
State:
56%
(% for various income ranges: 45.8% for AGIs below $25k, 47.9% for AGIs $25k-50k, 55.1% for AGIs $50k-75k, 57.6% for AGIs $75k-100k, 67.5% for AGIs $100k-200k, 88.9% for AGIs over 200k)
Averages for the 2004 tax year for zip code 73703, filed in 2005:
Average Adjusted Gross Income (AGI) in 2004: $45,752 (Individual Income Tax Returns)
Here:
$45,752
State:
$41,245
Salary/wage: $38,137 (reported on 79.9% of returns)
Here:
$38,137
State:
$35,318
(% of AGI for various income ranges: 117.6% for AGIs below $10k, 70.8% for AGIs $10k-25k, 76.6% for AGIs $25k-50k, 75.6% for AGIs $50k-75k, 75.2% for AGIs $75k-100k, 48.5% for AGIs over 100k)
Taxable interest for individuals: $2,198 (reported on 50.6% of returns)
This zip code:
$2,198
Oklahoma:
$1,745
(% of AGI for various income ranges: 8.7% for AGIs below $10k, 3.9% for AGIs $10k-25k, 2.3% for AGIs $25k-50k, 1.9% for AGIs $50k-75k, 1.5% for AGIs $75k-100k, 2.6% for AGIs over 100k)
Taxable dividends: $2,692 (reported on 28.7% of returns)
Here:
$2,692
State:
$2,920
(% of AGI for various income ranges: 4.7% for AGIs below $10k, 1.6% for AGIs $10k-25k, 1.4% for AGIs $25k-50k, 1.5% for AGIs $50k-75k, 1.2% for AGIs $75k-100k, 2.1% for AGIs over 100k)
Net capital gain/loss: +$4,692 (reported on 23.5% of returns)
Here:
+$4,692
State:
+$10,653
(% of AGI for various income ranges: -2.6% for AGIs below $10k, 0.1% for AGIs $10k-25k, 0.7% for AGIs $25k-50k, 1.1% for AGIs $50k-75k, 1.4% for AGIs $75k-100k, 5.4% for AGIs over 100k)
Profit/loss from business: +$10,272 (reported on 18.0% of returns)
Here:
+$10,272
State:
+$8,532
(% of AGI for various income ranges: 7.0% for AGIs below $10k, 4.6% for AGIs $10k-25k, 3.0% for AGIs $25k-50k, 2.4% for AGIs $50k-75k, 3.6% for AGIs $75k-100k, 5.6% for AGIs over 100k)
IRA payment deduction: $3,408 (reported on 3.9% of returns)
73703:
$3,408
Oklahoma:
$3,127
(% of AGI for various income ranges: 0.4% for AGIs $10k-25k, 0.4% for AGIs $25k-50k, 0.3% for AGIs $50k-75k, 0.3% for AGIs $75k-100k, 0.2% for AGIs over 100k)
Self-employed pension: $12,681 (reported on 1.0% of returns)
Here:
$12,681
Oklahoma:
$14,276
(% of AGI for various income ranges: 0.1% for AGIs $25k-50k, 0.1% for AGIs $50k-75k, 0.2% for AGIs $75k-100k, 0.6% for AGIs over 100k)
Total itemized deductions: $15,897 (20% of AGI, reported on 37.1% of returns)
Here:
$15,897
State:
$17,093
Here:
20.0% of AGI
State:
20.5% of AGI
(% of AGI for various income ranges: 24.2% for AGIs below $10k, 12.5% for AGIs $10k-25k, 12.2% for AGIs $25k-50k, 13.7% for AGIs $50k-75k, 15.1% for AGIs $75k-100k, 11.6% for AGIs over 100k)
Charity contributions deductions: $4,039 (5% of AGI, reported on 32.9% of returns)
Here:
$4,039
State:
$4,240
Here:
5.0% of AGI
State:
4.8% of AGI
(% of AGI for various income ranges: 2.5% for AGIs below $10k, 2.2% for AGIs $10k-25k, 2.3% for AGIs $25k-50k, 2.8% for AGIs $50k-75k, 3.8% for AGIs $75k-100k, 3.2% for AGIs over 100k)
Total tax: $7,227 (reported on 76.4% of returns)
73703:
$7,227
State:
$6,542
(% of AGI for various income ranges: 3.4% for AGIs below $10k, 4.1% for AGIs $10k-25k, 6.5% for AGIs $25k-50k, 8.5% for AGIs $50k-75k, 10.5% for AGIs $75k-100k, 20.7% for AGIs over 100k)
Earned income credit: $1,674 (reported on 12.7% of returns)
Here:
$1,674
State:
$1,830
Percentage of individuals using paid preparers for their 2004 taxes: 61.7%
Here:
62%
State:
63%
(% for various income ranges: 52.4% for AGIs below $10k, 62.1% for AGIs $10k-25k, 62.5% for AGIs $25k-50k, 62.6% for AGIs $50k-75k, 65.9% for AGIs $75k-100k, 75.4% for AGIs over 100k)
Likely homosexual households (counted as self-reported same-sex unmarried-partner households)
Lesbian couples: 0.2% of all households
Gay men: 0.0% of all households
Household received Food Stamps/SNAP in the past 12 months: 1,114 Household did not receive Food Stamps/SNAP in the past 12 months: 11,058
Women who had a birth in the past 12 months: 489 (410 now married, 84 unmarried) Women who did not have a birth in the past 12 months: 5,382 (2,905 now married, 2,476 unmarried)
Housing units in zip code 73703 with a mortgage: 4,317 (279 second mortgage, 27 home equity loan, 158 both second mortgage and home equity loan) Houses without a mortgage: 29
Median monthly owner costs for units with a mortgage: $1,413 Median monthly owner costs for units without a mortgage: $539
Residents with income below the poverty level in 2022:
This zip code:
9.0%
Whole state:
15.7%
Residents with income below 50% of the poverty level in 2022:
This zip code:
4.4%
Whole state:
8.3%
Median number of rooms in houses and condos:
Here:
6.2
State:
6.1
Median number of rooms in apartments:
Here:
4.7
State:
4.5
Notable locations in this zip code not listed on our city pages
Notable locations in zip code 73703: Sunnyside School (A), Turkey Creek School (B), Vernon School (C), Sunset Plaza (D), Westgate Plaza (E), Sycamore Square (F), Happy Valley School (G), Camp Rhodes (H), Enid Fire Department Station 5 (I), Enid Fire Department Station 4 (J). Display/hide their locations on the map
Churches in zip code 73703 include: Banner Church (A), Willow View United Methodist Church (B), West Willow Community Church (C), West Side Church of God (D), Victory Christian Training Center (E), Saint Gregorys Catholic Church (F), Seventh Day Adventist Church (G), Reorganized Church of Jesus (H), Redeemer Lutheran Church (I). Display/hide their locations on the map
Parks in zip code 73703 include: Vance Park (1), Meadowlake Park (2), Northwest Area Park (3), Weldon Park (4), Meadowlake Park (5). Display/hide their locations on the map
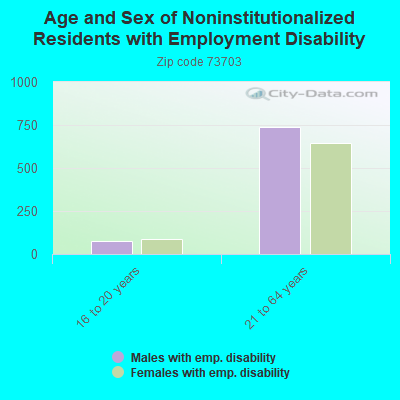
In group quarters: 441 (-1 institutionalized population)
Size of family households: 4,145 2-persons, 1,196 3-persons, 1,109 4-persons, 769 5-persons, 318 6-persons, 140 7-or-more-persons
Size of nonfamily households: 3,775 1-person, 756 2-persons, 59 3-persons
4,517 married couples with children.
1,388 single-parent households (601 men, 787 women).
91.8% of residents of 73703 zip code speak English at home.
4.8% of residents speak Spanish at home (71% very well, 15% well, 7% not well, 6% not at all).
0.5% of residents speak other Indo-European language at home (73% very well, 27% well).
2.6% of residents speak Asian or Pacific Island language at home (63% very well, 19% well, 16% not well, 2% not at all).
0.5% of residents speak other language at home (100% very well).
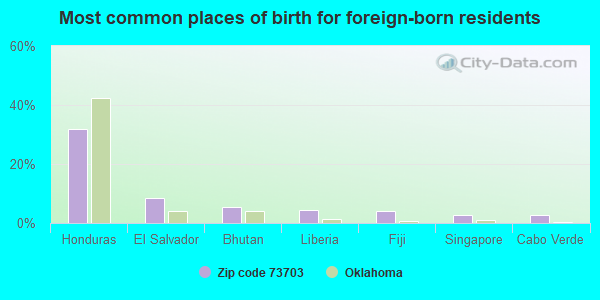
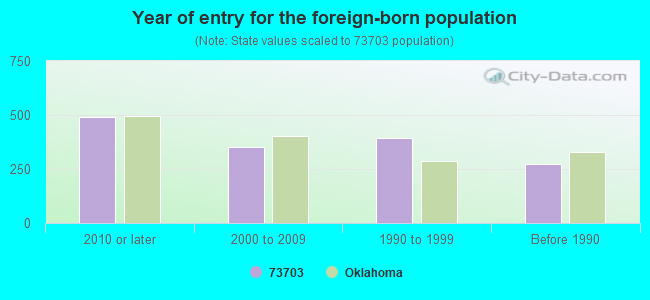
Foreign born population: 1,215 (4.1%) (42.1% of them are naturalized citizens)
This zip code:
4.1%
Whole state:
6.0%
32%Honduras
9%El Salvador
6%Bhutan
4%Liberia
4%Fiji
3%Singapore
3%Cabo Verde
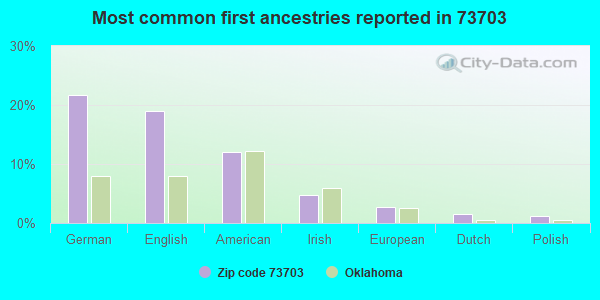
22%German
19%English
12%American
5%Irish
3%European
2%Dutch
1%Polish
Year of entry for the foreign-born population
4922010 or later
3512000 to 2009
3931990 to 1999
275Before 1990
Major facilities with environmental interests located in this zip code:
B-K GRAIN & SUPPLY INCORPORATED (6822 NORTH OAKWOOD ROAD in ENID, OK)
AIR MINOR (AIRS/AFS) (Integrated Compliance Information System) - ICIS-06-2002-3516, FORMAL ENFORCEMENT ACTION ENFORCEMENT/COMPLIANCE ACTIVITY (Integrated Compliance Information System) Business SIC classification: GRAIN AND FIELD BEANS
DEWITT WALLER JHS (2604 WEST RANDOLPH in ENID, OK)
(National Center for Education Statistics) - STATE ID-24-I057-620 Organizations: ENID (SCHOOL DISTRICT)
EISENHOWER ES (1301 WEST FOX DRIVE in ENID, OK)
(National Center for Education Statistics) - STATE ID-24-I057-125 Organizations: ENID (SCHOOL DISTRICT)
GLENWOOD ES (824 N. OALWOOD RD. in ENID, OK)
(National Center for Education Statistics) - STATE ID-24-I057-132 Organizations: ENID (SCHOOL DISTRICT)
MCKINLEY ES (1701 WEST BROADWAY in ENID, OK)
(National Center for Education Statistics) - STATE ID-24-I057-160 Organizations: ENID (SCHOOL DISTRICT)
BARTHOLOMEW TRANSPORTATION INC (1115 NORMAN ROAD in ENID, OK)
(Resource Conservation and Recovery Act (tracking hazardous waste)) Organizations: A K MANAHAN (CONTACT/OWNER)
ENID FORD & NEW HOLLAND (3210 N VAN BUREN in ENID, OK)
(Resource Conservation and Recovery Act (tracking hazardous waste))
BETHEL BAPTIST ACADEMY (901 S CLEVELAND ST in ENID, OK)
COMPLIANCE ACTIVITY (Tracking inspections of insecticide, fungicide, and rodenticide, and toxic substances)
BOOKER TRANSMISSION INC (857 COMMERCIAL CIRCLE in ENID, OK)
Conditionally Exempt Small Quantity Generators, less than 100 kg/month of hazardous waste (Resource Conservation and Recovery Act (tracking hazardous waste)) Organizations: KEVIN W BOOKER (CONTACT/OPERATOR)
EMMANUEL CHRISTIAN SCHOOL (2505 WEST GARRIOT ROAD in ENID, OK)
COMPLIANCE ACTIVITY (Tracking inspections of insecticide, fungicide, and rodenticide, and toxic substances) Business SIC classification: ELEMENTARY AND SECONDARY SCHOOLS
GOODPASTURE INC/ENID GRAIN ELEVATOR (1015 N VAN BUREN ST in ENID, OK)
AIR MINOR (AIRS/AFS) Business SIC classification: GRAIN AND FIELD BEANS Alternative names: GOODPASTURE INC./ENID FAC
BAKERS ALTERNATOR & STARTER INC. (1006 TRAILS W LOOP in ENID, OK)
Conditionally Exempt Small Quantity Generators, less than 100 kg/month of hazardous waste (Resource Conservation and Recovery Act (tracking hazardous waste)) Organizations: HERBERT D. ROBINSON JR. (CONTACT/OWNER)
Housing units lacking complete plumbing facilities: 1.1% Housing units lacking complete kitchen facilities: 1.8%
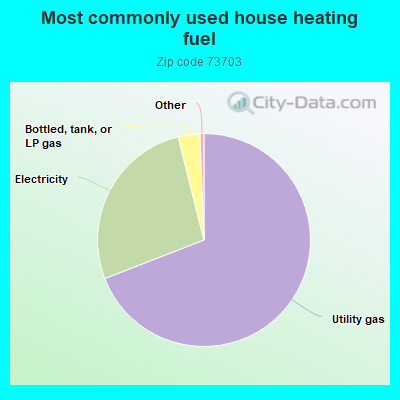
69.1%Utility gas
27.0%Electricity
3.3%Bottled, tank, or LP gas
Population in 1990: 24,700. Population change in the 1990s: +1,921 (+7.8%).
Place of birth for U.S.-born residents:
This state: 18,154
Northeast: 627
Midwest: 3,431
South: 3,477
West: 2,320
51% of the 73703 zip code residents lived in the same house 5 years ago. Out of people who lived in different houses, 55% lived in this county. Out of people who lived in different counties, 50% lived in Oklahoma.
86% of the 73703 zip code residents lived in the same house 1 year ago. Out of people who lived in different houses, 50% moved from this county. Out of people who lived in different houses, 21% moved from different county within same state. Out of people who lived in different houses, 21% moved from different state. Out of people who lived in different houses, 7% moved from abroad.
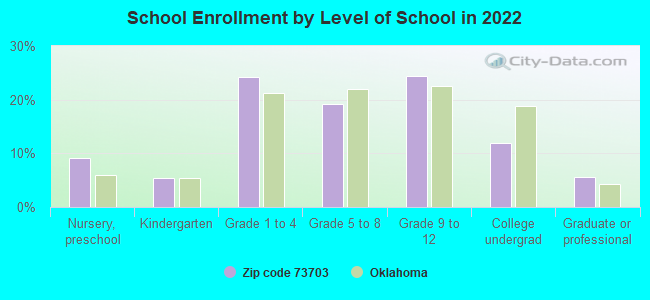
Private vs. public school enrollment:
Students in private schools in grades 1 to 8 (elementary and middle school): 607
Here:
21.6%
Oklahoma:
11.7%
Students in private schools in grades 9 to 12 (high school): 218
Here:
13.8%
Oklahoma:
11.7%
Students in private undergraduate colleges: 106
Here:
14.0%
Oklahoma:
19.3%
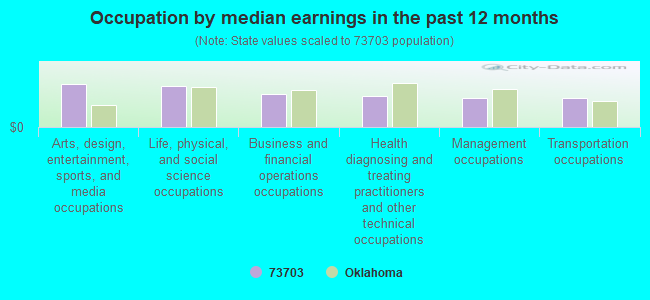
Occupation by median earnings in the past 12 months ($)
98,869Arts, design, entertainment, sports, and media occupations
95,922Life, physical, and social science occupations
76,895Business and financial operations occupations
71,411Health diagnosing and treating practitioners and other technical occupations
67,324Management occupations
67,274Transportation occupations
Companies with federal contracts located in this zip code (ENID, OK):
BLUE TEE CORP (2215 S VAN BUREN ST) : $1,384,021 in 20 contractsfrom 2000 to 2006
Contracts for Trucks and Truck Tractors, Wheeled, Maintenance, Repair and Rebuilding of Equipment -- Vehicular Equipment Components, Maintenance, Repair and Rebuilding of Equipment -- Miscellaneous, Mining, Rock Drilling, Earth Boring and Related Equipment, and moreby Geological Survey, Army, Air Force, Defense Logistics Agency, and others Signed by year:2000: $289,500; 2001: $416,000; 2002: $6,968; 2003: $73,505; 2004: $344,389; 2005: $249,721; 2006: $3,938.
Biggest contracts:
$416,000 with Geological Survey for Trucks and Truck Tractors, Wheeled. Signed on 2001-01-15. Completion date: 2001-04-15.
$322,500 with Army for Maintenance, Repair and Rebuilding of Equipment -- Vehicular Equipment Components. Taking place in ND. Signed on 2004-08-23. Completion date: 2005-02-22.
$289,500 with Air Force for Maintenance, Repair and Rebuilding of Equipment -- Miscellaneous. Taking place in MT. Signed on 2000-07-24. Completion date: 2000-07-24.
$100,000 with Army for Mining, Rock Drilling, Earth Boring and Related Equipment. Signed on 2005-03-04. Completion date: 2005-03-04.
HENSON CONSTRUCTION CO (2300 W OKLAHOMA AVE; small business) : $890,206 in 5 contractsfrom 2001 to 2006
Contracts for Maintenance, Repair or Alteration of Real Property -- Highways, Roads, Streets, Bridges, and Railways (includes resurfacing), Maintenance, Repair or Alteration of Real Property -- Office Buildings by Air Force, U.S. Fish and Wildlife Service Signed by year:2000: $0; 2001: $230,000; 2002: $0; 2003: $0; 2004: $0; 2005: $643,011; 2006: $17,195.
Biggest contracts:
$642,000 with Air Force for Maintenance, Repair or Alteration of Real Property -- Highways, Roads, Streets, Bridges, and Railways (includes resurfacing). Taking place in TX. Signed on 2005-03-03. Completion date: 2005-12-16.
$229,000 with U.S. Fish and Wildlife Service for Maintenance, Repair or Alteration of Real Property -- Office Buildings. Signed on 2001-04-15. Completion date: 2001-12-15.
$17,195 with Air Force for Maintenance, Repair or Alteration of Real Property -- Highways, Roads, Streets, Bridges, and Railways (includes resurfacing). Signed on 2006-02-28. Completion date: 2006-05-04.
$1,011, same as above.Signed on 2005-09-08. Completion date: 2006-01-02.
OKLAHOMA ENVIRONMENTAL, INC (717 S HOOVER ST; small business) : $146,410 in 4 contractsfrom 2002 to 2005
$39,040 with Navy for Maintenance, Repair and Rebuilding of Equipment -- Alarm, Signal, and Security Detection Systems. Taking place in CA. Signed on 2003-10-15. Completion date: 2004-10-14.
$39,040 with Navy for Equipment and Materials Testing -- Fire Fighting, Rescue, and Safety Equipment; and Environmental Protection Equipment and Materials. Taking place in CA. Signed on 2004-09-22. Completion date: 2005-09-30.
$39,040 with Navy for Hazard-Detecting Instruments and Apparatus. Signed on 2005-09-30. Completion date: 2006-09-30.
$29,290 with Navy for Maintenance, Repair and Rebuilding of Equipment -- Alarm, Signal, and Security Detection Systems. Taking place in CA. Signed on 2002-11-15. Completion date: 2003-10-14.
SMITH, JERRY (1018 SUNNYBROOK LANE; small business)
$74,283 with Army for Tree Thinning Services. Signed on 2003-09-17. Completion date: 2004-04-01.
ENID FORD NEW HOLLAND, INC. (3210 N. VAN BUREN; small business)
$41,004 with Air Force for Motorcycles, Motor Scooters, and Bicycles. Signed on 1999-11-29. Completion date: 2000-01-24.
VINES, SHARON (3515 N LINCOLN; small business)
$7,530 with Air Force for Floor Coverings. Taking place in KS. Signed on 2005-09-21. Completion date: 2005-10-21.
00 ENTERPRISE INC (1700 MOSHER DR APT 226; small business)
$4,967 with Army for Cameras, Motion Picture. Signed on 2003-03-18. Completion date: 2003-04-30.
SIBIT, ALBERT (802 S HAYES UNIT 9; small business) : $1,080 in 2 contractsin 2006
$4,800 with Army for Operation of Government-Owned Facilities -- Recreation Facilities (Non-Building). Signed on 2006-04-11. Completion date: 2006-02-28.
-$3,720, same as above.Signed on 2006-05-09. Completion date: 2006-02-28.
Top industries in this zip code by the number of employees in 2005:
2002 - 2018 National Fire Incident Reporting System (NFIRS) incidents
Based on the data from the years 2002 - 2018 the average number of fires per year is 63. The highest number of reported fires - 109 took place in 2011, and the least - 0 in 2010. The data has a declining trend.
When looking into fire subcategories, the most incidents belonged to: Outside Fires (50.1%), and Structure Fires (28.8%).
Fire incident types reported to NFIRS in Zip Code 73703


 Nearest zip codes: 73727, 73705, 73754, 73743, 73753, 73773.


 Based on the data from the years 2002 - 2018 the average number of fires per year is 63. The highest number of reported fires - 109 took place in 2011, and the least - 0 in 2010. The data has a declining trend.
 When looking into fire subcategories, the most incidents belonged to: Outside Fires (50.1%), and Structure Fires (28.8%).