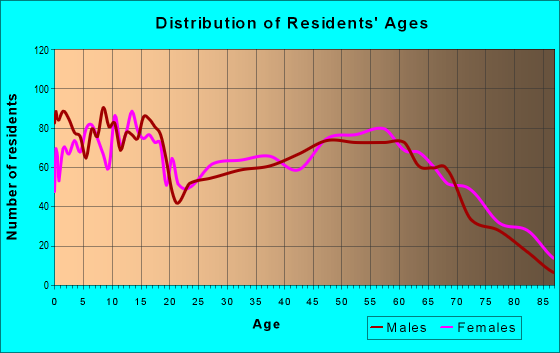
Estimated zip code population in 2022: 10,674 Zip code population in 2010: 10,501 Zip code population in 2000: 10,170
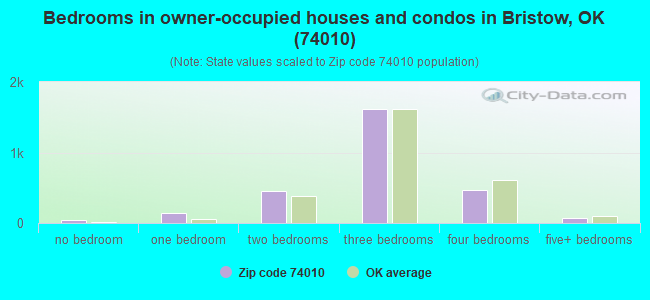
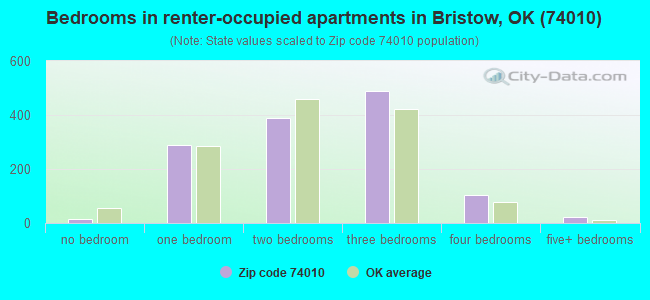
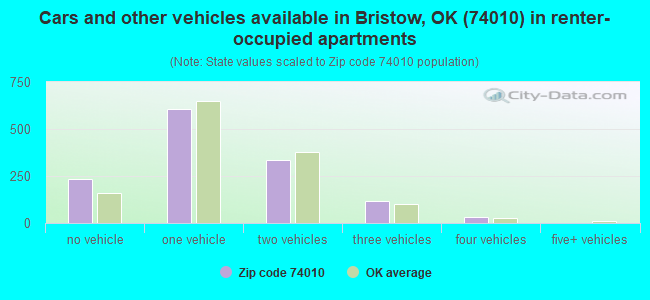
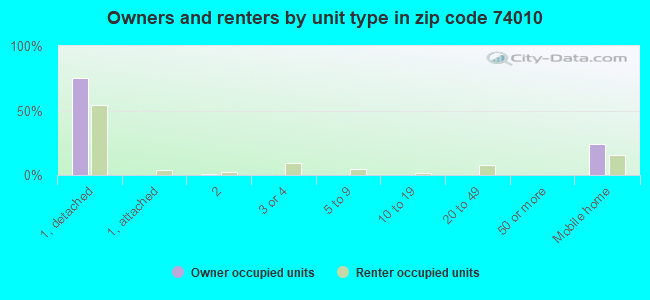
Houses and condos: 4,749 Renter-occupied apartments: 1,317
% of renters here:
32%
State:
35%
March 2022 cost of living index in zip code 74010: 79.0 (low, U.S. average is 100)
Land area: 328.7 sq. mi. Water area: 4.2 sq. mi.
Population density: 32 people per square mile
(very low).
OSM Map
General Map
Google Map
MSN Map
OSM Map
General Map
Google Map
MSN Map
OSM Map
General Map
Google Map
MSN Map
OSM Map
General Map
Google Map
MSN Map
Please wait while loading the map...
Real estate property taxes paid for housing units in 2022:
This zip code:
0.6% ($930)
Oklahoma:
0.8% ($1,501)
Median real estate property taxes paid for housing units with mortgages in 2022: $1,279 (0.7%) Median real estate property taxes paid for housing units with no mortgage in 2022: $771 (0.6%)
Averages for the 2020 tax year for zip code 74010, filed in 2021:
Average Adjusted Gross Income (AGI) in 2020: $52,311 (Individual Income Tax Returns)
Here:
$52,311
State:
$63,060
Salary/wage: $46,913 (reported on 83.1% of returns)
Here:
$46,913
State:
$52,427
(% of AGI for various income ranges: 1234.3% for AGIs below $25k, 3632.5% for AGIs $25k-50k, 6474.3% for AGIs $50k-75k, 9568.5% for AGIs $75k-100k, 16730.0% for AGIs $100k-200k, 50900.0% for AGIs over 200k)
Taxable interest for individuals: $1,112 (reported on 23.5% of returns)
This zip code:
$1,112
Oklahoma:
$1,603
(% of AGI for various income ranges: 14.8% for AGIs below $25k, 17.2% for AGIs $25k-50k, 49.1% for AGIs $50k-75k, 52.2% for AGIs $75k-100k, 90.0% for AGIs $100k-200k, 530.0% for AGIs over 200k)
Ordinary dividends: $3,302 (reported on 10.2% of returns)
Here:
$3,302
State:
$7,001
(% of AGI for various income ranges: 15.5% for AGIs below $25k, 27.7% for AGIs $25k-50k, 28.5% for AGIs $50k-75k, 58.5% for AGIs $75k-100k, 109.6% for AGIs $100k-200k, 1333.3% for AGIs over 200k)
Net capital gain/loss in AGI: +$12,854 (reported on 9.3% of returns)
Here:
+$12,854
State:
+$19,855
(% of AGI for various income ranges: 13.8% for AGIs below $25k, 33.5% for AGIs $25k-50k, 104.3% for AGIs $50k-75k, 219.3% for AGIs $75k-100k, 533.0% for AGIs $100k-200k, 6756.7% for AGIs over 200k)
Profit/loss from business: +$9,486 (reported on 17.6% of returns)
Here:
+$9,486
State:
+$9,904
(% of AGI for various income ranges: 137.0% for AGIs below $25k, 166.4% for AGIs $25k-50k, 249.6% for AGIs $50k-75k, 246.7% for AGIs $75k-100k, 457.0% for AGIs $100k-200k, 2846.7% for AGIs over 200k)
Taxable individual retirement arrangement distribution: $25,372 (reported on 6.9% of returns)
74010:
$25,372
Oklahoma:
$20,476
(% of AGI for various income ranges: 45.8% for AGIs below $25k, 82.4% for AGIs $25k-50k, 194.7% for AGIs $50k-75k, 283.7% for AGIs $75k-100k, 1628.5% for AGIs $100k-200k)
Total itemized deductions: $39,472 (reported on 4.3% of returns)
Here:
$39,472
State:
$39,736
(% of AGI for various income ranges: 62.1% for AGIs below $25k, 153.0% for AGIs $50k-75k, 273.7% for AGIs $75k-100k, 941.1% for AGIs $100k-200k, 7993.3% for AGIs over 200k)
Charity contributions: $13,587 (reported on 3.6% of returns)
Here:
$13,587
State:
$17,288
(% of AGI for various income ranges: 12.5% for AGIs below $25k, 38.9% for AGIs $50k-75k, 273.7% for AGIs $100k-200k, 3246.7% for AGIs over 200k)
Taxes paid: $6,483 (reported on 4.3% of returns)
74010:
$6,483
State:
$7,046
(% of AGI for various income ranges: 7.6% for AGIs below $25k, 16.6% for AGIs $50k-75k, 39.3% for AGIs $75k-100k, 183.3% for AGIs $100k-200k, 1336.7% for AGIs over 200k)
Earned income credit: $2,527 (reported on 22.1% of returns)
Here:
$2,527
State:
$2,435
(% of AGI for various income ranges: 122.9% for AGIs below $25k, 103.2% for AGIs $25k-50k)
Percentage of individuals using paid preparers for their 2020 taxes: 94.5%
Here:
95%
State:
94%
(% for various income ranges: 94.8% for AGIs below $25k, 93.8% for AGIs $25k-50k, 95.2% for AGIs $50k-75k, 94.7% for AGIs $75k-100k, 95.5% for AGIs $100k-200k, 88.9% for AGIs over 200k)
Averages for the 2012 tax year for zip code 74010, filed in 2013:
Average Adjusted Gross Income (AGI) in 2012: $46,498 (Individual Income Tax Returns)
Here:
$46,498
State:
$58,581
Salary/wage: $41,284 (reported on 85.7% of returns)
Here:
$41,284
State:
$45,973
(% of AGI for various income ranges: 76.2% for AGIs below $25k, 84.4% for AGIs $25k-50k, 81.8% for AGIs $50k-75k, 82.3% for AGIs $75k-100k, 78.5% for AGIs $100k-200k, 46.8% for AGIs over 200k)
Taxable interest for individuals: $1,205 (reported on 24.1% of returns)
This zip code:
$1,205
Oklahoma:
$1,625
(% of AGI for various income ranges: 1.1% for AGIs below $25k, 0.4% for AGIs $25k-50k, 0.7% for AGIs $50k-75k, 0.2% for AGIs $75k-100k, 0.4% for AGIs $100k-200k, 1.2% for AGIs over 200k)
Ordinary dividends: $2,316 (reported on 10.8% of returns)
Here:
$2,316
State:
$6,374
(% of AGI for various income ranges: 0.7% for AGIs below $25k, 0.4% for AGIs $25k-50k, 0.4% for AGIs $50k-75k, 0.6% for AGIs $75k-100k, 0.5% for AGIs $100k-200k, 0.8% for AGIs over 200k)
Net capital gain/loss in AGI: +$10,358 (reported on 8.3% of returns)
Here:
+$10,358
State:
+$24,023
(% of AGI for various income ranges: 0.6% for AGIs below $25k, 0.5% for AGIs $25k-50k, 0.1% for AGIs $50k-75k, 0.4% for AGIs $75k-100k, 1.2% for AGIs $100k-200k, 9.3% for AGIs over 200k)
Profit/loss from business: +$8,109 (reported on 16.8% of returns)
Here:
+$8,109
State:
+$11,913
(% of AGI for various income ranges: 7.6% for AGIs below $25k, 3.2% for AGIs $25k-50k, 3.2% for AGIs $50k-75k, 1.0% for AGIs $75k-100k, 2.5% for AGIs $100k-200k, 1.2% for AGIs over 200k)
Taxable individual retirement arrangement distribution: $10,884 (reported on 8.0% of returns)
74010:
$10,884
Oklahoma:
$15,242
(% of AGI for various income ranges: 2.3% for AGIs below $25k, 1.8% for AGIs $25k-50k, 2.0% for AGIs $50k-75k, 2.6% for AGIs $75k-100k, 2.4% for AGIs $100k-200k)
Total itemized deductions: $24,379 (24% of AGI, reported on 21.1% of returns)
Here:
$24,379
State:
$24,882
Here:
24.3% of AGI
State:
18.8% of AGI
(% of AGI for various income ranges: 8.2% for AGIs below $25k, 6.6% for AGIs $25k-50k, 8.0% for AGIs $50k-75k, 11.1% for AGIs $75k-100k, 13.9% for AGIs $100k-200k, 19.2% for AGIs over 200k)
Charity contributions: $6,388 (reported on 16.1% of returns)
Here:
$6,388
State:
$6,591
(% of AGI for various income ranges: 0.9% for AGIs below $25k, 1.1% for AGIs $25k-50k, 1.1% for AGIs $50k-75k, 2.2% for AGIs $75k-100k, 2.8% for AGIs $100k-200k, 5.2% for AGIs over 200k)
Taxes paid: $5,048 (reported on 20.9% of returns)
74010:
$5,048
State:
$7,196
(% of AGI for various income ranges: 1.3% for AGIs below $25k, 1.0% for AGIs $25k-50k, 1.4% for AGIs $50k-75k, 2.3% for AGIs $75k-100k, 3.7% for AGIs $100k-200k, 3.7% for AGIs over 200k)
Earned income credit: $2,331 (reported on 25.6% of returns)
Here:
$2,331
State:
$2,354
(% of AGI for various income ranges: 8.5% for AGIs below $25k, 1.7% for AGIs $25k-50k)
Percentage of individuals using paid preparers for their 2012 taxes: 67.1%
Here:
67%
State:
56%
(% for various income ranges: 63.2% for AGIs below $25k, 66.3% for AGIs $25k-50k, 71.4% for AGIs $50k-75k, 68.8% for AGIs $75k-100k, 77.4% for AGIs $100k-200k, 85.7% for AGIs over 200k)
Averages for the 2004 tax year for zip code 74010, filed in 2005:
Average Adjusted Gross Income (AGI) in 2004: $33,624 (Individual Income Tax Returns)
Here:
$33,624
State:
$41,245
Salary/wage: $30,944 (reported on 85.6% of returns)
Here:
$30,944
State:
$35,318
(% of AGI for various income ranges: 123.3% for AGIs below $10k, 79.8% for AGIs $10k-25k, 88.8% for AGIs $25k-50k, 84.0% for AGIs $50k-75k, 83.8% for AGIs $75k-100k, 52.1% for AGIs over 100k)
Taxable interest for individuals: $1,529 (reported on 32.1% of returns)
This zip code:
$1,529
Oklahoma:
$1,745
(% of AGI for various income ranges: 8.2% for AGIs below $10k, 1.6% for AGIs $10k-25k, 0.8% for AGIs $25k-50k, 1.2% for AGIs $50k-75k, 0.7% for AGIs $75k-100k, 1.9% for AGIs over 100k)
Taxable dividends: $1,506 (reported on 12.5% of returns)
Here:
$1,506
State:
$2,920
(% of AGI for various income ranges: 1.1% for AGIs below $10k, 0.7% for AGIs $10k-25k, 0.3% for AGIs $25k-50k, 0.5% for AGIs $50k-75k, 0.3% for AGIs $75k-100k, 0.9% for AGIs over 100k)
Net capital gain/loss: +$5,830 (reported on 9.7% of returns)
Here:
+$5,830
State:
+$10,653
(% of AGI for various income ranges: 3.3% for AGIs below $10k, 0.3% for AGIs $10k-25k, 0.8% for AGIs $25k-50k, 0.9% for AGIs $50k-75k, 0.5% for AGIs $75k-100k, 5.1% for AGIs over 100k)
Profit/loss from business: +$5,303 (reported on 18.1% of returns)
Here:
+$5,303
State:
+$8,532
(% of AGI for various income ranges: 0.9% for AGIs below $10k, 6.2% for AGIs $10k-25k, 2.6% for AGIs $25k-50k, 1.7% for AGIs $50k-75k, 3.2% for AGIs $75k-100k, 1.9% for AGIs over 100k)
IRA payment deduction: $3,672 (reported on 1.6% of returns)
74010:
$3,672
Oklahoma:
$3,127
Total itemized deductions: $15,020 (22% of AGI, reported on 25.8% of returns)
Here:
$15,020
State:
$17,093
Here:
21.9% of AGI
State:
20.5% of AGI
(% of AGI for various income ranges: 10.6% for AGIs below $10k, 8.0% for AGIs $10k-25k, 10.4% for AGIs $25k-50k, 13.2% for AGIs $50k-75k, 14.0% for AGIs $75k-100k, 12.4% for AGIs over 100k)
Charity contributions deductions: $3,343 (5% of AGI, reported on 21.1% of returns)
Here:
$3,343
State:
$4,240
Here:
4.6% of AGI
State:
4.8% of AGI
(% of AGI for various income ranges: 1.0% for AGIs below $10k, 1.4% for AGIs $10k-25k, 1.7% for AGIs $25k-50k, 2.3% for AGIs $50k-75k, 2.5% for AGIs $75k-100k, 2.9% for AGIs over 100k)
Total tax: $4,619 (reported on 66.7% of returns)
74010:
$4,619
State:
$6,542
(% of AGI for various income ranges: 3.7% for AGIs below $10k, 3.7% for AGIs $10k-25k, 5.4% for AGIs $25k-50k, 7.9% for AGIs $50k-75k, 10.6% for AGIs $75k-100k, 19.0% for AGIs over 100k)
Earned income credit: $1,779 (reported on 26.0% of returns)
Here:
$1,779
State:
$1,830
Percentage of individuals using paid preparers for their 2004 taxes: 71.6%
Here:
72%
State:
63%
(% for various income ranges: 67.1% for AGIs below $10k, 72.7% for AGIs $10k-25k, 73.3% for AGIs $25k-50k, 71.3% for AGIs $50k-75k, 73.3% for AGIs $75k-100k, 78.6% for AGIs over 100k)
Likely homosexual households (counted as self-reported same-sex unmarried-partner households)
Lesbian couples: 0.6% of all households
Gay men: 0.1% of all households
Household received Food Stamps/SNAP in the past 12 months: 636 Household did not receive Food Stamps/SNAP in the past 12 months: 3,473
Women who had a birth in the past 12 months: 208 (124 now married, 83 unmarried) Women who did not have a birth in the past 12 months: 2,243 (1,279 now married, 963 unmarried)
Housing units in zip code 74010 with a mortgage: 1,373 (47 second mortgage, 41 both second mortgage and home equity loan) Houses without a mortgage: 25
Median monthly owner costs for units with a mortgage: $1,252 Median monthly owner costs for units without a mortgage: $362
Residents with income below the poverty level in 2022:
This zip code:
17.3%
Whole state:
15.7%
Residents with income below 50% of the poverty level in 2022:
This zip code:
8.9%
Whole state:
8.3%
Median number of rooms in houses and condos:
Here:
5.9
State:
6.1
Median number of rooms in apartments:
Here:
4.5
State:
4.5
Notable locations in this zip code not listed on our city pages
Notable locations in zip code 74010: Herman Farms (A), Choska Church Camp (B), Welty Volunteer Fire Department (C), Creek County Emergency Ambulance Service District Station 2 (D), Slick Volunteer Fire Department (E), Bristow Fire Department (F). Display/hide their locations on the map
Churches in zip code 74010 include: Beacon Light Church (A), Bethel Church (B), Saint Joseph Catholic Church (C), Pilgrim Baptist Church (D), First Church of God (E), First Christian Church (F), First Baptist Church (G), The Church of Jesus Christ of Latter Day Saints (H), Bristow Presbyterian Church (I). Display/hide their locations on the map
Cemeteries: Wilson Cemetery (1), Falls Cemetery (2), Oak Hill Cemetery (3), Wilson Cemetery (4), Washburn Cemetery (5), Teddy Brown Cemetery (6), Tabor Cemetery (7). Display/hide their locations on the map
Lakes and reservoirs: Round Lake (A), Sawmill Lake (B), Brushy Lake (C), Flag Lake (D), Little Deep Fork Creek Site 53 Reservoir (E), Heyburn Lake (F), Oknoname 037050 Reservoir (G), Little Deep Fork Creek Site 25 Reservoir (H). Display/hide their locations on the map
Streams, rivers, and creeks: Hopper Creek (A), Turkey Creek (B), Comelys Branch (C), Clifty Creek (D), Chicken Creek (E), Skull Creek (F), Scholar Creek (G), Sandy Creek (H), Catfish Creek (I). Display/hide their locations on the map
In group quarters: 95 (-1 institutionalized population)
Size of family households: 1,321 2-persons, 572 3-persons, 499 4-persons, 261 5-persons, 92 6-persons, 75 7-or-more-persons
Size of nonfamily households: 1,144 1-person, 101 2-persons, 23 3-persons
1,515 married couples with children.
802 single-parent households (140 men, 662 women).
98.7% of residents of 74010 zip code speak English at home.
0.9% of residents speak Spanish at home (92% very well, 8% not well).
0.1% of residents speak other Indo-European language at home (100% very well).
0.2% of residents speak other language at home (100% very well).
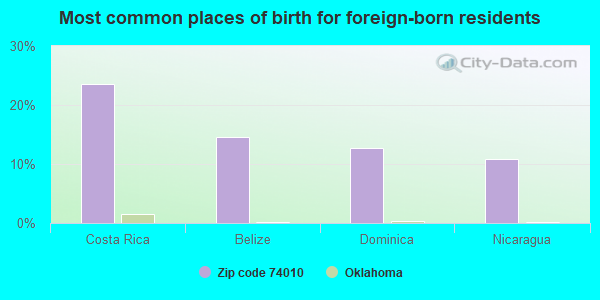
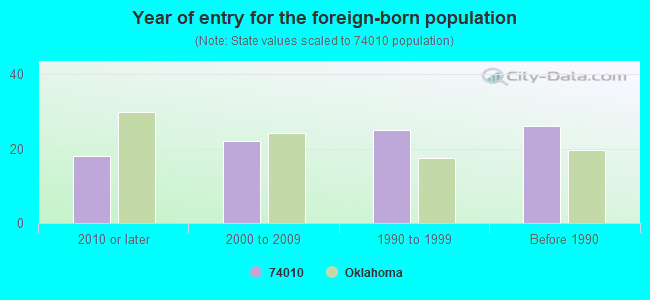
Foreign born population: 55 (0.5%) (64.4% of them are naturalized citizens)
This zip code:
0.5%
Whole state:
6.0%
24%Costa Rica
15%Belize
13%Dominica
11%Nicaragua
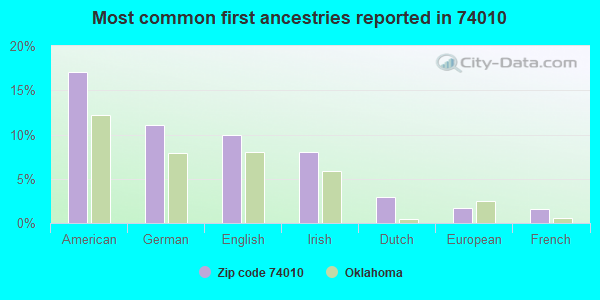
17%American
11%German
10%English
8%Irish
3%Dutch
2%European
2%French
Year of entry for the foreign-born population
182010 or later
222000 to 2009
251990 to 1999
26Before 1990
Facilities with environmental interests located in this zip code:
BEREXCO INC.: NORTH STARR LEASE WELL NO. 34 (SE/4NE/4, SECTION 8, TOWNSHIP 18 N, RANGE 7 E in BRISTOW, OK)
ENFORCEMENT/COMPLIANCE ACTIVITY (Integrated Compliance Information System) - ICIS-06-2002-4536, FORMAL ENFORCEMENT ACTION (Integrated Compliance Information System) - ICIS-06-2002-4536, FORMAL ENFORCEMENT ACTION Business SIC classification: CRUDE PETROLEUM AND NATURAL GAS
CITY OF BRISTOW (110 W 7TH in BRISTOW, OK)
STATE MASTER (Oklahoma environmental compliance activities data) National Pollutant Discharge Elimination System NON-MAJOR (Tracking pollutant discharge elimination systems) - permit COMMUNITY WATER SYSTEM (SDWIS) - ICIS-06-2005-1497, ENFORCEMENT/COMPLIANCE ACTIVITY, SDWIS-OK2001910 19376, WATER TREATMENT PLANT, SDWIS-OK2001910 20679, SDWIS-OK2001910 20680, Business SIC classification: SEWERAGE SYSTEMS Alternative names: BRISTOW, CITY OF, BRISTOW MUN AUTH
BRISTOW HS (HWY 16 AND ASH in BRISTOW, OK)
(National Center for Education Statistics) - STATE ID-19-I002-705
BRISTOW MS (10 WEATHERWOOD WAY in BRISTOW, OK)
(National Center for Education Statistics) - STATE ID-19-I002-505
COLLINS ES (811 N. ASH ST. in BRISTOW, OK)
(National Center for Education Statistics) - STATE ID-19-I002-115 Organizations: BRISTOW (SCHOOL DISTRICT)
EDISON ES (111 W. 9TH STREET in BRISTOW, OK)
(National Center for Education Statistics) - STATE ID-19-I002-110 Organizations: BRISTOW (SCHOOL DISTRICT)
2 1/2" DEEP FORK GATHERING SYS LINE (SECTION 31, T15 N, R9 E, 6 M S OF BRISTOW in BRISTOW, OK)
(Integrated Compliance Information System) - ICIS-06-1999-0823, FORMAL ENFORCEMENT ACTION Business SIC classification: PIPELINES
APAC MI INC MASTERS/PORTABLE PLT 06 (JCT OF I-44 & HWY 66 in BRISTOW, OK)
AIR MINOR (AIRS/AFS) Business SIC classification: ASPHALT PAVING MIXTURES AND BLOCKS
BRISTOW PUBLIC SCHOOLS (134 W 9TH in BRISTOW, OK)
COMPLIANCE ACTIVITY (Tracking inspections of insecticide, fungicide, and rodenticide, and toxic substances) Business SIC classification: ELEMENTARY AND SECONDARY SCHOOLS
11-17-07 (SEC. 11, T 17N, R 07E in BRISTOW, OK)
ENFORCEMENT/COMPLIANCE ACTIVITY (Integrated Compliance Information System)
BRISTOW ADVENTISE JUNIOR ACADEMY (JEFFERSON ST in BRISTOW, OK)
COMPLIANCE ACTIVITY (Tracking inspections of insecticide, fungicide, and rodenticide, and toxic substances)
BRISTOW ADVENTIST ACADEMY (PO BOX 756, SE DEAD END, HWY. 16 in BRISTOW, OK)
COMPLIANCE ACTIVITY (Tracking inspections of insecticide, fungicide, and rodenticide, and toxic substances) Business SIC classification: ELEMENTARY AND SECONDARY SCHOOLS
CREECO MILL AND ELEVATOR COMPANY (135 EAST 9TH STREET in BRISTOW, OK)
SUPERFUND (Superfund database)
Housing units lacking complete plumbing facilities: 6.4% Housing units lacking complete kitchen facilities: 4.9%
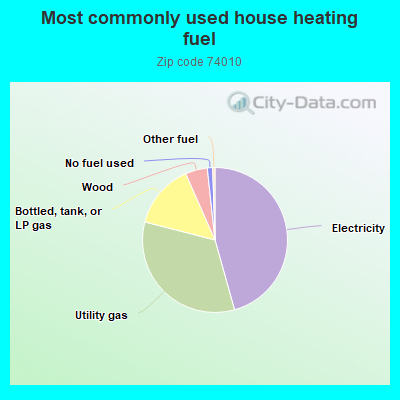
45.7%Electricity
33.4%Utility gas
14.4%Bottled, tank, or LP gas
4.9%Wood
1.2%No fuel used
0.5%Other fuel
Population in 1990: 7,361. Population change in the 1990s: +2,809 (+38.2%).
Place of birth for U.S.-born residents:
This state: 7,573
Northeast: 77
Midwest: 754
South: 1,167
West: 1,001
61% of the 74010 zip code residents lived in the same house 5 years ago. Out of people who lived in different houses, 58% lived in this county. Out of people who lived in different counties, 50% lived in Oklahoma.
92% of the 74010 zip code residents lived in the same house 1 year ago. Out of people who lived in different houses, 51% moved from this county. Out of people who lived in different houses, 37% moved from different county within same state. Out of people who lived in different houses, 11% moved from different state. Out of people who lived in different houses, 3% moved from abroad.
Private vs. public school enrollment:
Students in private schools in grades 1 to 8 (elementary and middle school): 59
Here:
5.2%
Oklahoma:
11.7%
Students in private schools in grades 9 to 12 (high school): 28
Here:
4.6%
Oklahoma:
11.7%
Students in private undergraduate colleges: 14
Here:
12.9%
Oklahoma:
19.3%
Occupation by median earnings in the past 12 months ($)
74,448Legal occupations
61,521Management occupations
59,044Fire fighting and prevention, and other protective service workers including supervisors
56,747Installation, maintenance, and repair occupations
49,643Business and financial operations occupations
46,956Life, physical, and social science occupations
Companies with federal contracts located in this zip code (BRISTOW, OK):
SHERWOOD LIFTING COMPANY, INC (116 E 7TH AVE)
$257,600 with Army for Winches, Hoists, Cranes, and Derricks. Signed on 2006-05-11. Completion date: 2006-09-29.
OKLAHOMA PLUGGING SERVICE (2 1/2 MILES W OLD HWY 66; small business) 5 employees, $250000 revenue. : $125,000 in 3 contractsin 2002
$50,000 with Bureau of Land Management for Other Natural Resources and Conservation Services. Signed on 2002-07-15. Completion date: 2002-09-15.
$47,000 with Bureau of Land Management for Other Professional Services. Signed on 2002-05-15. Completion date: 2002-08-15.
$28,000 with Bureau of Land Management for Other Natural Resources and Conservation Services. Signed on 2002-07-15. Completion date: 2002-09-15.
TIMCO (31188 S HIGHWAY 48) : $113,420 in 3 contractsfrom 2004 to 2005
$44,300 with U.S. Army Corps of Engineers - civil program financing only for Maintenance, Repair or Alteration of Real Property -- Highways, Roads, Streets, Bridges, and Railways (includes resurfacing). Taking place in KS. Signed on 2005-08-10. Completion date: 2005-10-27.
$44,300 with Army for Maintenance, Repair or Alteration of Real Property -- Highways, Roads, Streets, Bridges, and Railways (includes resurfacing). Taking place in KS. Signed on 2005-08-10. Completion date: 2005-10-27.
$24,820 with Army for Maintenance, Repair and Rebuilding of Equipment -- Aircraft Components and Accessories. Signed on 2004-08-08. Completion date: 2005-02-16.
ALBERT E AND ELIZABETH N BRA (29110 W 141ST ST SOUTH; small business) : $11,340 in 4 contractsin 2004
$5,670 with Army for Other Administrative Support Services. Signed on 2004-03-23. Completion date: 2004-03-04.
$5,670 with U.S. Army Corps of Engineers - civil program financing only for Other Administrative Support Services. Signed on 2004-03-23. Completion date: 2004-03-04.
$0 with Army for Other Administrative Support Services. Signed on 2004-03-23. Completion date: 2004-03-04.
$0 with U.S. Army Corps of Engineers - civil program financing only for Other Administrative Support Services. Signed on 2004-03-23. Completion date: 2004-03-04.
KEELING, BEVERLY JEAN (16895 S 289TH W AVE; small business) : $11,081 in 3 contractsfrom 2004 to 2006
$4,081 with Army for Operation of Government-Owned Facilities -- Recreation Facilities (Non-Building). Signed on 2006-04-04. Completion date: 2006-02-28.
$3,500 with U.S. Army Corps of Engineers - civil program financing only for Other Administrative Support Services. Signed on 2004-03-12. Completion date: 2004-03-11.
$3,500 with Army for Other Administrative Support Services. Signed on 2004-03-12. Completion date: 2004-03-11.
QUAIL RESTORATION TECH (18953 W 301ST ST S; small business)
$4,347 with Army for Dairy, Poultry, and Livestock Equipment. Signed on 2004-09-10. Completion date: 2004-10-15.
GOLDIE E WILHELM (1117 S CHESTNUT; small business) : $1,188 in 4 contractsin 2004
$8,024 with Army for Other Administrative Support Services. Signed on 2004-03-12. Completion date: 2004-03-04.
$8,024 with U.S. Army Corps of Engineers - civil program financing only for Other Administrative Support Services. Signed on 2004-03-12. Completion date: 2004-03-04.
-$7,430 with Army for Other Administrative Support Services. Signed on 2004-06-01. Completion date: 2004-03-04.
-$7,430 with U.S. Army Corps of Engineers - civil program financing only for Other Administrative Support Services. Signed on 2004-06-01. Completion date: 2004-03-04.
Top industries in this zip code by the number of employees in 2005:
2002 - 2018 National Fire Incident Reporting System (NFIRS) incidents
According to the data from the years 2002 - 2018 the average number of fires per year is 98. The highest number of reported fire incidents - 177 took place in 2011, and the least - 57 in 2014. The data has an increasing trend.
When looking into fire subcategories, the most reports belonged to: Outside Fires (64.5%), and Structure Fires (18.9%).
Fire incident types reported to NFIRS in Zip Code 74010


 Nearest zip codes: 74071, 74039, 74028, 74046, 74068, 74833.


 According to the data from the years 2002 - 2018 the average number of fires per year is 98. The highest number of reported fire incidents - 177 took place in 2011, and the least - 57 in 2014. The data has an increasing trend.
 When looking into fire subcategories, the most reports belonged to: Outside Fires (64.5%), and Structure Fires (18.9%).