Estimated zip code population in 2022: 97,180 Zip code population in 2010: 88,996 Zip code population in 2000: 56,252
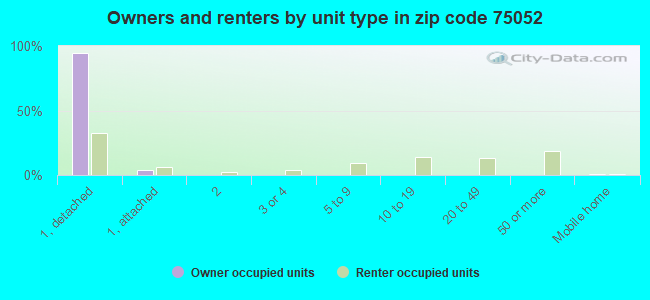
Houses and condos: 33,986 Renter-occupied apartments: 10,903
% of renters here:
33%
State:
38%
March 2022 cost of living index in zip code 75052: 95.3 (near average, U.S. average is 100)
Land area: 26.2 sq. mi. Water area: 1.9 sq. mi.
Population density: 3,715 people per square mile
(average).
OSM Map
General Map
Google Map
MSN Map
OSM Map
General Map
Google Map
MSN Map
OSM Map
General Map
Google Map
MSN Map
OSM Map
General Map
Google Map
MSN Map
Please wait while loading the map...
Real estate property taxes paid for housing units in 2022:
This zip code:
1.8% ($5,238)
Texas:
1.5% ($4,050)
Median real estate property taxes paid for housing units with mortgages in 2022: $5,514 (1.8%) Median real estate property taxes paid for housing units with no mortgage in 2022: $4,846 (1.8%)
Estimated median house/condo value in 2022: $291,600
75052:
$291,600
Texas:
$275,400
According to our research of Texas and other state lists, there were 96 registered sex offenders living in 75052 zip code as of April 27, 2024. The ratio of all residents to sex offenders in zip code 75052 is 978 to 1. The ratio of registered sex offenders to all residents in this zip code is lower than the state average.
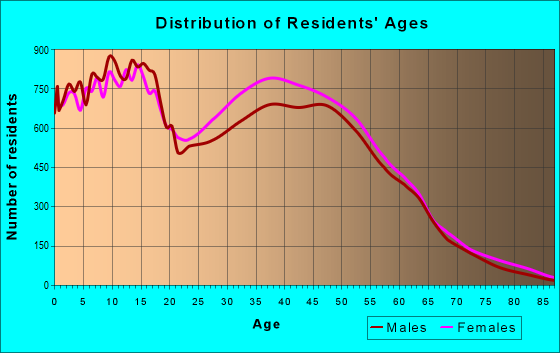
Median resident age:
This zip code:
35.2 years
Texas median age:
35.6 years
Average household size:
This zip code:
3.0 people
Texas:
2.6 people
Averages for the 2020 tax year for zip code 75052, filed in 2021:
Average Adjusted Gross Income (AGI) in 2020: $54,096 (Individual Income Tax Returns)
Here:
$54,096
State:
$77,054
Salary/wage: $51,222 (reported on 86.1% of returns)
Here:
$51,222
State:
$62,766
(% of AGI for various income ranges: 1229.2% for AGIs below $25k, 3802.0% for AGIs $25k-50k, 6828.5% for AGIs $50k-75k, 10183.6% for AGIs $75k-100k, 17840.1% for AGIs $100k-200k, 60404.5% for AGIs over 200k)
Taxable interest for individuals: $914 (reported on 14.6% of returns)
This zip code:
$914
Texas:
$2,665
(% of AGI for various income ranges: 4.8% for AGIs below $25k, 5.4% for AGIs $25k-50k, 14.1% for AGIs $50k-75k, 23.7% for AGIs $75k-100k, 49.9% for AGIs $100k-200k, 612.4% for AGIs over 200k)
Ordinary dividends: $2,609 (reported on 8.4% of returns)
Here:
$2,609
State:
$10,044
(% of AGI for various income ranges: 5.0% for AGIs below $25k, 7.4% for AGIs $25k-50k, 20.4% for AGIs $50k-75k, 36.7% for AGIs $75k-100k, 74.4% for AGIs $100k-200k, 1354.8% for AGIs over 200k)
Net capital gain/loss in AGI: +$7,249 (reported on 8.6% of returns)
Here:
+$7,249
State:
+$39,590
(% of AGI for various income ranges: 3.4% for AGIs below $25k, 11.3% for AGIs $25k-50k, 36.9% for AGIs $50k-75k, 65.0% for AGIs $75k-100k, 297.0% for AGIs $100k-200k, 4502.4% for AGIs over 200k)
Profit/loss from business: +$3,515 (reported on 24.6% of returns)
Here:
+$3,515
State:
+$10,888
(% of AGI for various income ranges: 101.9% for AGIs below $25k, 27.1% for AGIs $25k-50k, 93.1% for AGIs $50k-75k, 155.3% for AGIs $75k-100k, 248.8% for AGIs $100k-200k, 2110.7% for AGIs over 200k)
Taxable individual retirement arrangement distribution: $15,918 (reported on 4.5% of returns)
75052:
$15,918
Texas:
$24,740
(% of AGI for various income ranges: 23.7% for AGIs below $25k, 44.9% for AGIs $25k-50k, 85.7% for AGIs $50k-75k, 194.3% for AGIs $75k-100k, 335.1% for AGIs $100k-200k, 1158.3% for AGIs over 200k)
Self-employed (Keogh) retirement plans: $19,075 (reported on 0.1% of returns)
75052:
$19,075
Texas:
$29,298
(% of AGI for various income ranges: 21.8% for AGIs $100k-200k)
Total itemized deductions: $28,783 (reported on 7.6% of returns)
Here:
$28,783
State:
$40,428
(% of AGI for various income ranges: 29.7% for AGIs below $25k, 139.3% for AGIs $25k-50k, 355.6% for AGIs $50k-75k, 580.5% for AGIs $75k-100k, 949.4% for AGIs $100k-200k, 4330.7% for AGIs over 200k)
Charity contributions: $11,389 (reported on 6.4% of returns)
Here:
$11,389
State:
$18,201
(% of AGI for various income ranges: 4.4% for AGIs below $25k, 39.3% for AGIs $25k-50k, 111.8% for AGIs $50k-75k, 171.9% for AGIs $75k-100k, 362.2% for AGIs $100k-200k, 1681.0% for AGIs over 200k)
Taxes paid: $7,081 (reported on 7.4% of returns)
75052:
$7,081
State:
$7,821
(% of AGI for various income ranges: 6.3% for AGIs below $25k, 33.3% for AGIs $25k-50k, 87.7% for AGIs $50k-75k, 155.2% for AGIs $75k-100k, 233.6% for AGIs $100k-200k, 761.4% for AGIs over 200k)
Earned income credit: $2,466 (reported on 20.0% of returns)
Here:
$2,466
State:
$2,584
(% of AGI for various income ranges: 116.3% for AGIs below $25k, 81.4% for AGIs $25k-50k, 1.2% for AGIs $50k-75k)
Percentage of individuals using paid preparers for their 2020 taxes: 92.4%
Here:
92%
State:
92%
(% for various income ranges: 91.7% for AGIs below $25k, 93.4% for AGIs $25k-50k, 93.0% for AGIs $50k-75k, 92.7% for AGIs $75k-100k, 91.6% for AGIs $100k-200k, 90.6% for AGIs over 200k)
Averages for the 2012 tax year for zip code 75052, filed in 2013:
Average Adjusted Gross Income (AGI) in 2012: $49,282 (Individual Income Tax Returns)
Here:
$49,282
State:
$65,384
Salary/wage: $47,449 (reported on 89.2% of returns)
Here:
$47,449
State:
$52,524
(% of AGI for various income ranges: 82.2% for AGIs below $25k, 89.9% for AGIs $25k-50k, 88.0% for AGIs $50k-75k, 87.3% for AGIs $75k-100k, 87.0% for AGIs $100k-200k, 66.3% for AGIs over 200k)
Taxable interest for individuals: $690 (reported on 18.7% of returns)
This zip code:
$690
Texas:
$2,372
(% of AGI for various income ranges: 0.3% for AGIs below $25k, 0.2% for AGIs $25k-50k, 0.2% for AGIs $50k-75k, 0.2% for AGIs $75k-100k, 0.2% for AGIs $100k-200k, 0.6% for AGIs over 200k)
Ordinary dividends: $2,192 (reported on 8.6% of returns)
Here:
$2,192
State:
$9,721
(% of AGI for various income ranges: 0.6% for AGIs below $25k, 0.3% for AGIs $25k-50k, 0.2% for AGIs $50k-75k, 0.2% for AGIs $75k-100k, 0.4% for AGIs $100k-200k, 1.1% for AGIs over 200k)
Net capital gain/loss in AGI: +$2,629 (reported on 6.4% of returns)
Here:
+$2,629
State:
+$35,319
(% of AGI for various income ranges: 0.4% for AGIs $100k-200k, 3.1% for AGIs over 200k)
Profit/loss from business: +$5,693 (reported on 21.4% of returns)
Here:
+$5,693
State:
+$13,732
(% of AGI for various income ranges: 8.8% for AGIs below $25k, 1.8% for AGIs $25k-50k, 1.6% for AGIs $50k-75k, 1.6% for AGIs $75k-100k, 1.5% for AGIs $100k-200k, 3.8% for AGIs over 200k)
Taxable individual retirement arrangement distribution: $13,500 (reported on 5.1% of returns)
75052:
$13,500
Texas:
$19,511
(% of AGI for various income ranges: 1.4% for AGIs below $25k, 1.2% for AGIs $25k-50k, 1.3% for AGIs $50k-75k, 1.7% for AGIs $75k-100k, 1.5% for AGIs $100k-200k, 1.2% for AGIs over 200k)
Self-employment retirement plans: $14,940 (reported on 0.1% of returns)
75052:
$14,940
Texas:
$23,938
Total itemized deductions: $19,168 (23% of AGI, reported on 30.4% of returns)
Here:
$19,168
State:
$24,724
Here:
23.4% of AGI
State:
15.9% of AGI
(% of AGI for various income ranges: 7.7% for AGIs below $25k, 11.5% for AGIs $25k-50k, 13.2% for AGIs $50k-75k, 12.8% for AGIs $75k-100k, 12.6% for AGIs $100k-200k, 9.2% for AGIs over 200k)
Charity contributions: $4,822 (reported on 24.1% of returns)
Here:
$4,822
State:
$6,808
(% of AGI for various income ranges: 0.8% for AGIs below $25k, 1.9% for AGIs $25k-50k, 2.4% for AGIs $50k-75k, 2.6% for AGIs $75k-100k, 3.1% for AGIs $100k-200k, 2.2% for AGIs over 200k)
Taxes paid: $5,079 (reported on 29.7% of returns)
75052:
$5,079
State:
$6,921
(% of AGI for various income ranges: 1.6% for AGIs below $25k, 2.7% for AGIs $25k-50k, 3.3% for AGIs $50k-75k, 3.4% for AGIs $75k-100k, 3.5% for AGIs $100k-200k, 2.9% for AGIs over 200k)
Earned income credit: $2,502 (reported on 23.4% of returns)
Here:
$2,502
State:
$2,570
(% of AGI for various income ranges: 9.1% for AGIs below $25k, 1.6% for AGIs $25k-50k)
Percentage of individuals using paid preparers for their 2012 taxes: 51.5%
Here:
51%
State:
51%
(% for various income ranges: 53.1% for AGIs below $25k, 52.3% for AGIs $25k-50k, 50.0% for AGIs $50k-75k, 48.5% for AGIs $75k-100k, 47.1% for AGIs $100k-200k, 63.4% for AGIs over 200k)
Averages for the 2004 tax year for zip code 75052, filed in 2005:
Average Adjusted Gross Income (AGI) in 2004: $45,392 (Individual Income Tax Returns)
Here:
$45,392
State:
$47,881
Salary/wage: $44,244 (reported on 91.6% of returns)
Here:
$44,244
State:
$41,947
(% of AGI for various income ranges: 107.4% for AGIs below $10k, 87.4% for AGIs $10k-25k, 92.2% for AGIs $25k-50k, 92.2% for AGIs $50k-75k, 90.9% for AGIs $75k-100k, 82.6% for AGIs over 100k)
Taxable interest for individuals: $752 (reported on 30.0% of returns)
This zip code:
$752
Texas:
$2,255
(% of AGI for various income ranges: 1.4% for AGIs below $10k, 0.7% for AGIs $10k-25k, 0.5% for AGIs $25k-50k, 0.4% for AGIs $50k-75k, 0.5% for AGIs $75k-100k, 0.5% for AGIs over 100k)
Taxable dividends: $1,070 (reported on 12.4% of returns)
Here:
$1,070
State:
$4,261
(% of AGI for various income ranges: 0.8% for AGIs below $10k, 0.3% for AGIs $10k-25k, 0.2% for AGIs $25k-50k, 0.2% for AGIs $50k-75k, 0.2% for AGIs $75k-100k, 0.5% for AGIs over 100k)
Net capital gain/loss: +$4,581 (reported on 10.1% of returns)
Here:
+$4,581
State:
+$16,110
(% of AGI for various income ranges: -0.6% for AGIs below $10k, -0.1% for AGIs $10k-25k, 0.1% for AGIs $25k-50k, 0.1% for AGIs $50k-75k, 0.4% for AGIs $75k-100k, 3.5% for AGIs over 100k)
Profit/loss from business: +$5,806 (reported on 18.0% of returns)
Here:
+$5,806
State:
+$11,013
(% of AGI for various income ranges: 4.3% for AGIs below $10k, 5.3% for AGIs $10k-25k, 1.5% for AGIs $25k-50k, 1.4% for AGIs $50k-75k, 1.7% for AGIs $75k-100k, 3.2% for AGIs over 100k)
IRA payment deduction: $2,777 (reported on 1.6% of returns)
75052:
$2,777
Texas:
$3,120
(% of AGI for various income ranges: 0.1% for AGIs $10k-25k, 0.1% for AGIs $25k-50k, 0.1% for AGIs $50k-75k, 0.1% for AGIs $75k-100k, 0.1% for AGIs over 100k)
Self-employed pension: $10,827 (reported on 0.3% of returns)
Here:
$10,827
Texas:
$16,401
(% of AGI for various income ranges: 0.0% for AGIs $25k-50k, 0.0% for AGIs $50k-75k, 0.0% for AGIs $75k-100k, 0.2% for AGIs over 100k)
Total itemized deductions: $16,567 (24% of AGI, reported on 39.3% of returns)
Here:
$16,567
State:
$19,631
Here:
23.6% of AGI
State:
18.9% of AGI
(% of AGI for various income ranges: 10.6% for AGIs below $10k, 9.6% for AGIs $10k-25k, 15.1% for AGIs $25k-50k, 16.0% for AGIs $50k-75k, 15.4% for AGIs $75k-100k, 13.3% for AGIs over 100k)
Charity contributions deductions: $3,614 (5% of AGI, reported on 33.0% of returns)
Here:
$3,614
State:
$4,753
Here:
4.9% of AGI
State:
4.2% of AGI
(% of AGI for various income ranges: 0.8% for AGIs below $10k, 1.2% for AGIs $10k-25k, 2.2% for AGIs $25k-50k, 2.7% for AGIs $50k-75k, 2.9% for AGIs $75k-100k, 3.2% for AGIs over 100k)
Total tax: $5,862 (reported on 74.7% of returns)
75052:
$5,862
State:
$9,058
(% of AGI for various income ranges: 3.8% for AGIs below $10k, 3.9% for AGIs $10k-25k, 5.8% for AGIs $25k-50k, 8.3% for AGIs $50k-75k, 10.1% for AGIs $75k-100k, 15.9% for AGIs over 100k)
Earned income credit: $1,856 (reported on 18.1% of returns)
Here:
$1,856
State:
$2,024
Percentage of individuals using paid preparers for their 2004 taxes: 52.8%
Here:
53%
State:
57%
(% for various income ranges: 44.5% for AGIs below $10k, 59.7% for AGIs $10k-25k, 56.0% for AGIs $25k-50k, 51.9% for AGIs $50k-75k, 46.9% for AGIs $75k-100k, 49.6% for AGIs over 100k)
Likely homosexual households (counted as self-reported same-sex unmarried-partner households)
Lesbian couples: 0.1% of all households
Gay men: 0.0% of all households
Household received Food Stamps/SNAP in the past 12 months: 3,176 Household did not receive Food Stamps/SNAP in the past 12 months: 29,547
Women who had a birth in the past 12 months: 1,091 (732 now married, 358 unmarried) Women who did not have a birth in the past 12 months: 24,237 (10,573 now married, 13,666 unmarried)
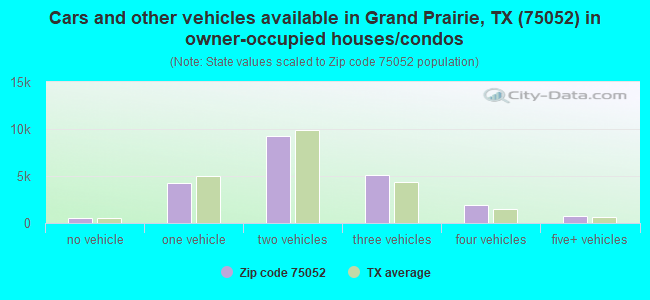
Housing units in zip code 75052 with a mortgage: 14,060 (608 second mortgage, 567 both second mortgage and home equity loan) Houses without a mortgage: 122
Median monthly owner costs for units with a mortgage: $1,897 Median monthly owner costs for units without a mortgage: $800
Residents with income below the poverty level in 2022:
This zip code:
8.1%
Whole state:
14.0%
Residents with income below 50% of the poverty level in 2022:
This zip code:
3.7%
Whole state:
7.4%
Median number of rooms in houses and condos:
Here:
6.6
State:
6.3
Median number of rooms in apartments:
Here:
4.0
State:
4.0
Notable locations in this zip code not listed on our city pages
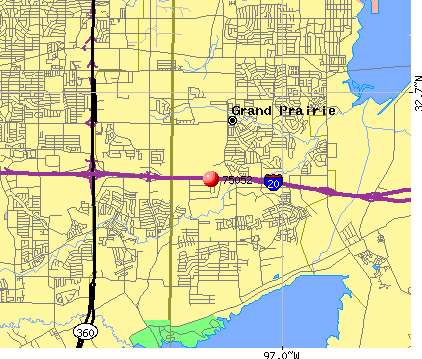
Notable locations in zip code 75052: Grand Prairie Fire Department Station 5 (A), Grand Prairie Fire Department Station 9 (B), Grand Prairie Fire Department Station 6 (C), Grand Prairie Fire Department Station 7 (D). Display/hide their locations on the map
Churches in zip code 75052 include: Church of Christ in Forum Terrace (A), Our Redeemer Lutheran Church (B), Abundant Life Assembly of God Church (C), Faith Fellowship Missionary Baptist Church (D), Bible Missionary Church (E), Matthew Road Baptist Church (F), Open Door Baptist Church (G), Fellowship Baptist Church (H). Display/hide their locations on the map
Parks in zip code 75052 include: Kirby Creek Park (1), Parkhill Park (2), Mountain Creek Lake Park (3), Lyndon Baines Johnson Park (4), Lynn Creek Park (5), Winsom Park (6), Valley Park (7), Sycamore Park (8), Freedom Park (9). Display/hide their locations on the map
16,953 married couples with children.
5,498 single-parent households (1,020 men, 4,478 women).
61.7% of residents of 75052 zip code speak English at home.
26.3% of residents speak Spanish at home (62% very well, 23% well, 11% not well, 5% not at all).
1.1% of residents speak other Indo-European language at home (88% very well, 6% well, 5% not well, 1% not at all).
7.4% of residents speak Asian or Pacific Island language at home (48% very well, 29% well, 20% not well, 3% not at all).
3.2% of residents speak other language at home (86% very well, 13% well, 1% not well).
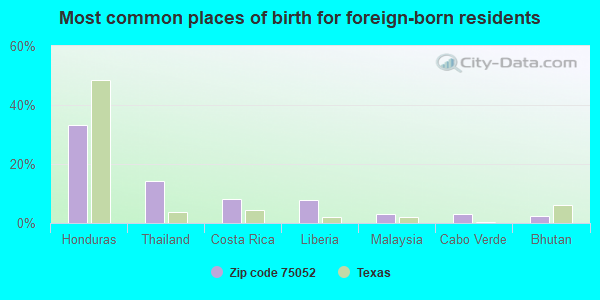
Foreign born population: 21,066 (21.7%) (63.1% of them are naturalized citizens)
Facilities with environmental interests located in this zip code:
AMERICAN EUROCOPTER CORPORATION (2701 FORUM DR in GRAND PRAIRIE, TX)
AIR MINOR (AIRS/AFS) HAZARDOUS WASTE BIENNIAL REPORTER (Resource Conservation and Recovery Act (tracking hazardous waste)) Large Quantity Generators, more that 1000 kg of hazardous waste/month (Resource Conservation and Recovery Act (tracking hazardous waste)) - notification Business SIC and NAICS classification: AIRCRAFT Organizations: AMERICAN EUROCOPTER LLC (CONTACT/OPERATOR)
BARBARA BUSH EL (511 E SPRINGDALE in GRAND PRAIRIE, TX)
(National Center for Education Statistics) - STATE ID-057910122 Organizations: GRAND PRAIRIE ISD (SCHOOL DISTRICT)
AEROSPATIALE GENERAL AVIATION (2701 FORUM DR HANGAR H in GRAND PRAIRIE, TX)
(Resource Conservation and Recovery Act (tracking hazardous waste)) Business NAICS classification: OTHER AIRPORT OPERATIONS.
ARLINGTON AUTOMATICS INC (2413 ARKANSAS LANE in GRAND PRAIRIE, TX)
(Resource Conservation and Recovery Act (tracking hazardous waste)) Business NAICS classification: OIL AND GAS FIELD MACHINERY AND EQUIPMENT MANUFACTURING. Alternative names: ARLINGTON AUTOMOTIVE INC
Housing units lacking complete plumbing facilities: 0.6% Housing units lacking complete kitchen facilities: 1.0%
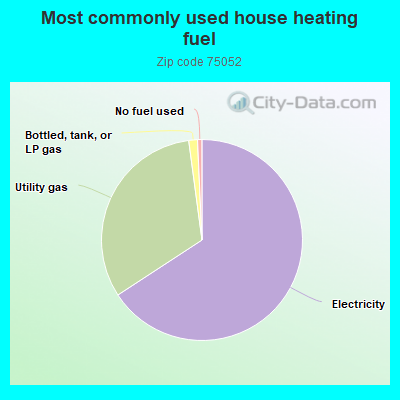
65.6%Electricity
32.0%Utility gas
1.4%Bottled, tank, or LP gas
0.7%No fuel used
Population in 1990: 15,850. Population change in the 1990s: +40,402 (+254.9%).
Place of birth for U.S.-born residents:
This state: 53,233
Northeast: 2,744
Midwest: 5,726
South: 7,822
West: 5,476
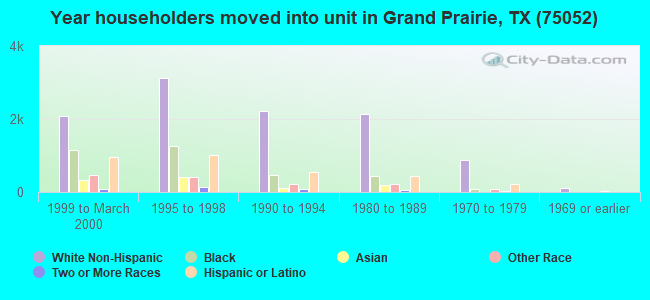
50% of the 75052 zip code residents lived in the same house 5 years ago. Out of people who lived in different houses, 53% lived in this county. Out of people who lived in different counties, 50% lived in Texas.
88% of the 75052 zip code residents lived in the same house 1 year ago. Out of people who lived in different houses, 40% moved from this county. Out of people who lived in different houses, 44% moved from different county within same state. Out of people who lived in different houses, 13% moved from different state. Out of people who lived in different houses, 5% moved from abroad.
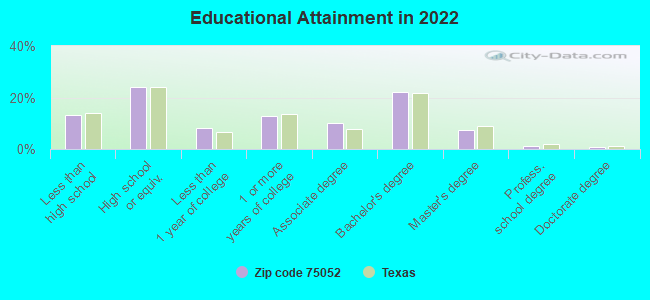
Private vs. public school enrollment:
Students in private schools in grades 1 to 8 (elementary and middle school): 1,183
Here:
10.3%
Texas:
8.8%
Students in private schools in grades 9 to 12 (high school): 356
Here:
4.9%
Texas:
8.0%
Students in private undergraduate colleges: 1,014
Here:
18.8%
Texas:
16.2%
Occupation by median earnings in the past 12 months ($)
122,579Legal occupations
86,283Architecture and engineering occupations
84,430Life, physical, and social science occupations
81,088Health diagnosing and treating practitioners and other technical occupations
80,319Computer and mathematical occupations
78,935Law enforcement workers including supervisors
Companies with biggest federal contracts located in this zip code (GRAND PRAIRIE, TX):
MICROTURBO, INC (2709 FORUM DR) : $6,010,444 in 43 contractsfrom 2000 to 2006
Contracts for Gas Turbines and Jet Engines, Aircraft; Prime Moving, and Components, Power and Hand Pumps, Generators and Generators Sets, Electrical, Maintenance, Repair and Rebuilding of Equipment -- Engine Accessories, and moreby Army, Air Force Signed by year:2000: $3,379,396; 2001: $319,069; 2002: $1,553,101; 2003: $138,542; 2004: $428,659; 2005: $186,509; 2006: $5,168.
Biggest contracts:
$2,417,404 with Army for Gas Turbines and Jet Engines, Aircraft; Prime Moving, and Components. Signed on 2000-01-25. Completion date: 2000-04-01.
$1,170,500, same as above.Signed on 2002-07-19. Completion date: 2003-07-31.
$293,806 with Army for Power and Hand Pumps. Signed on 2000-06-20. Completion date: 2005-06-05.
$270,341 with Army for Gas Turbines and Jet Engines, Aircraft; Prime Moving, and Components. Signed on 2000-07-13. Completion date: 2001-04-08.
APACHE ENTERPRISES, INC (2985 RED HAWK DR; small business) : $3,957,485 in 213 contractsfrom 1999 to 2006
Contracts for Miscellaneous Aircraft Accessories and Components, Miscellaneous Power Transmission Equipment, Optical Instruments, Test Equipment, Components and Accessories, Bearings, Mounted, and moreby Army, Air Force, Defense Logistics Agency, Navy, and others Signed by year:2000: $257,797; 2001: $227,991; 2002: $590,941; 2003: $316,696; 2004: $841,198; 2005: $1,130,819; 2006: $529,272.
Biggest contracts:
$272,547 with Army for Miscellaneous Aircraft Accessories and Components. Signed on 2004-01-15. Completion date: 2004-08-18.
$184,948 with Air Force for Miscellaneous Aircraft Accessories and Components. Signed on 2003-09-17. Completion date: 2003-10-30.
$139,047 with Army for Miscellaneous Power Transmission Equipment. Signed on 2005-08-24. Completion date: 2006-09-01.
$105,788, same as above.Signed on 2005-03-28. Completion date: 2010-03-31.
PENTACON AEROSPACE GROUP INC (3017 RED HAWK DR) : $2,798,283 in 103 contractsfrom 2001 to 2006
Contracts for Nuts and Washers, Bolts, Fastening Device, Bushings, Rings, Shims, and Spacers, and moreby Defense Logistics Agency Signed by year:2000: $0; 2001: $77,340; 2002: $0; 2003: $99,240; 2004: $1,695,104; 2005: $663,879; 2006: $262,720.
Biggest contracts:
$129,792 with Defense Logistics Agency for Nuts and Washers. Signed on 2004-05-20. Completion date: 2004-09-30.
$114,480, same as above.Signed on 2004-04-30. Completion date: 2004-09-27.
$113,652, same as above.Signed on 2004-09-07. Completion date: 2005-01-22.
$104,900, same as above.Signed on 2004-10-06. Completion date: 2005-02-23.
ACE GRINDING & MFG OF TX (2610 AERO DRIVE; small business) : $1,269,734 in 110 contractsfrom 2000 to 2006
Contracts for Airframe Structural Components, Nuts and Washers, Bolts, Nails, Machine Keys, and Pins, and moreby Defense Logistics Agency Signed by year:2000: $52,462; 2001: $164,124; 2002: $51,964; 2003: $38,469; 2004: $305,866; 2005: $395,875; 2006: $260,974.
Biggest contracts:
$64,595 with Defense Logistics Agency for Airframe Structural Components. Signed on 2001-03-27. Completion date: 2001-12-22.
$63,200 with Defense Logistics Agency for Nuts and Washers. Signed on 2006-05-02. Completion date: 2006-06-16.
$52,462 with Defense Logistics Agency for Bolts. Signed on 2000-09-09. Completion date: 2000-12-31.
$51,964 with Defense Logistics Agency for Nails, Machine Keys, and Pins. Signed on 2002-03-12. Completion date: 2002-03-12.
BILL EDMISTON INC. (2707 SOUTH GREAT SOUTHWEST; small business) : $275,244 in 2 contractsin 1999
$184,314 with Defense Logistics Agency for Aircraft Hydraulic, Vacuum, and De-icing System Components. Signed on 1999-10-15. Completion date: 2000-04-02.
$90,930 with Defense Logistics Agency for Bearings, Plain, Unmounted. Signed on 1999-10-08. Completion date: 2000-04-25.
GREAT LAKES PROCUREMENT (2606 B AVIATION PKWY; small business) : $272,758 in 35 contractsfrom 2004 to 2006
Contracts for Vehicular Power Transmission Components, Screws, Packing and Gasket Materials, Hardware, Commercial, and moreby Defense Logistics Agency Signed by year:2000: $0; 2001: $0; 2002: $0; 2003: $0; 2004: $9,086; 2005: $234,132; 2006: $29,540.
Biggest contracts:
$32,864 with Defense Logistics Agency for Vehicular Power Transmission Components. Signed on 2005-12-26. Completion date: 2006-03-11.
$24,142 with Defense Logistics Agency for Screws. Signed on 2005-03-14. Completion date: 2005-06-20.
$21,675 with Defense Logistics Agency for Packing and Gasket Materials. Signed on 2005-03-22. Completion date: 2005-05-31.
$21,434 with Defense Logistics Agency for Hardware, Commercial. Signed on 2005-02-15. Completion date: 2005-05-12.
TEXAS STARWARES, INC (2606A AVIATION PKWY; small business) 50 employees, $0 revenue. Woman Owned Business: $201,584 in 12 contractsfrom 2004 to 2006
Contracts for Screws, Bolts, Hardware, Commercial, Studs, and moreby Defense Logistics Agency, Navy, Air Force, Army, and others Signed by year:2000: $0; 2001: $0; 2002: $0; 2003: $0; 2004: $52,338; 2005: $128,743; 2006: $20,503.
Biggest contracts:
$64,174 with Defense Logistics Agency for Screws. Signed on 2005-01-11. Completion date: 2005-02-28.
$64,174, same as above.Signed on 2005-01-11. Completion date: 2005-07-10.
$31,713, same as above.Signed on 2004-09-23. Completion date: 2004-11-10.
$19,800, same as above.Signed on 2004-12-17. Completion date: 2005-02-03.
PBR-PRECISION PARTS MFG INC (2621 AERO DRIVE; small business) : $64,350 in 3 contractsfrom 2004 to 2005
$32,890 with Defense Logistics Agency for Airfield Specialized Trucks and Trailers. Signed on 2004-12-25. Completion date: 2005-04-29.
$20,735, same as above.Signed on 2005-02-28. Completion date: 2005-07-04.
$10,725, same as above.Signed on 2005-07-08. Completion date: 2005-11-13.
ALEXANDER MANUFACTURING COMPAN (2402 ARKANSAS LN; small business) : $37,106 in 5 contractsfrom 2004 to 2006
Contracts for Bearings, Mounted, Aircraft Landing Gear Components, Packing and Gasket Materials, Sets, Kits, and Outfits of Measuring Tools by Defense Logistics Agency, Air Force Signed by year:2000: $0; 2001: $0; 2002: $0; 2003: $0; 2004: $27,494; 2005: $6,290; 2006: $3,322.
Biggest contracts:
$27,494 with Defense Logistics Agency for Bearings, Mounted. Signed on 2004-12-28. Completion date: 2005-04-05.
$4,715 with Defense Logistics Agency for Aircraft Landing Gear Components. Signed on 2005-08-04. Completion date: 2005-10-16.
$3,322 with Defense Logistics Agency for Packing and Gasket Materials. Signed on 2006-05-11. Completion date: 2006-09-01.
$1,575 with Air Force for Sets, Kits, and Outfits of Measuring Tools. Signed on 2005-04-13. Completion date: 2005-06-30.
WH SCHAEFER (1505 RANCH ROAD; small business) : $31,918 in 9 contractsfrom 2004 to 2006
Contracts for Custodial Janitorial Services, Landscaping/Groundskeeping Services by Army, U.S. Army Corps of Engineers - civil program financing only Signed by year:2000: $0; 2001: $0; 2002: $0; 2003: $0; 2004: $12,634; 2005: $17,270; 2006: $2,014.
Biggest contracts:
$12,634 with Army for Custodial Janitorial Services. Signed on 2004-02-05. Completion date: 2003-09-30.
$11,640 with U.S. Army Corps of Engineers - civil program financing only for Landscaping/Groundskeeping Services. Signed on 2005-02-25. Completion date: 2004-02-29.
$2,200 with U.S. Army Corps of Engineers - civil program financing only for Custodial Janitorial Services. Signed on 2005-02-23. Completion date: 2003-09-30.
$2,200 with Army for Custodial Janitorial Services. Signed on 2005-02-23. Completion date: 2003-09-30.
Top industries in this zip code by the number of employees in 2005:
2002 - 2018 National Fire Incident Reporting System (NFIRS) incidents
According to the data from the years 2002 - 2018 the average number of fire incidents per year is 100. The highest number of fire incidents - 216 took place in 2011, and the least - 0 in 2004. The data has an increasing trend.
When looking into fire subcategories, the most incidents belonged to: Outside Fires (37.8%), and Structure Fires (33.6%).
Fire incident types reported to NFIRS in Zip Code 75052
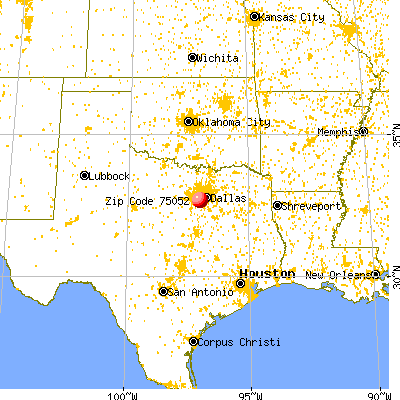


 Nearest zip codes: 75249, 76014, 75051, 76018, 75054, 76010.


 According to the data from the years 2002 - 2018 the average number of fire incidents per year is 100. The highest number of fire incidents - 216 took place in 2011, and the least - 0 in 2004. The data has an increasing trend.
 When looking into fire subcategories, the most incidents belonged to: Outside Fires (37.8%), and Structure Fires (33.6%).