Estimated zip code population in 2022: 16,812 Zip code population in 2010: 12,851 Zip code population in 2000: 11,303
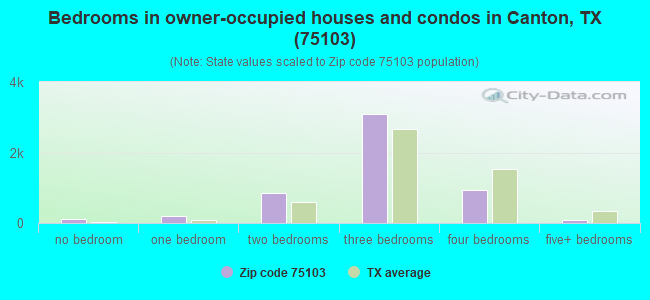
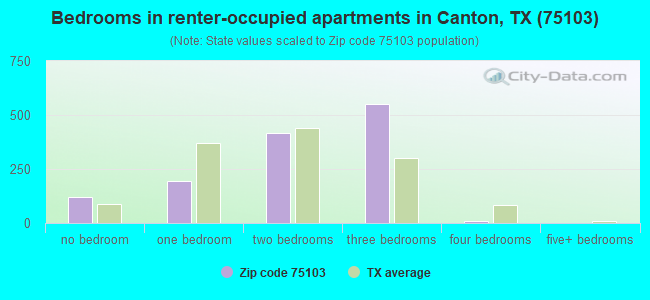
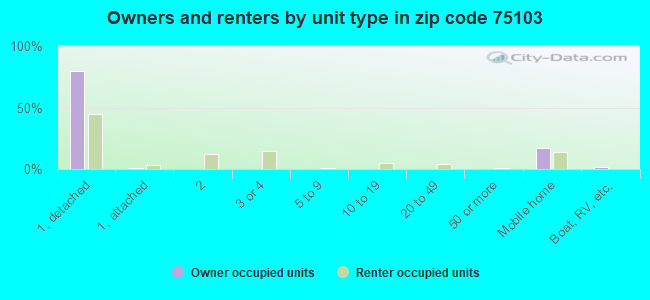
Houses and condos: 7,285 Renter-occupied apartments: 1,291
% of renters here:
20%
State:
38%
March 2022 cost of living index in zip code 75103: 80.6 (low, U.S. average is 100)
Land area: 199.5 sq. mi. Water area: 3.2 sq. mi.
Population density: 84 people per square mile
(very low).
OSM Map
General Map
Google Map
MSN Map
OSM Map
General Map
Google Map
MSN Map
OSM Map
General Map
Google Map
MSN Map
OSM Map
General Map
Google Map
MSN Map
Please wait while loading the map...
Real estate property taxes paid for housing units in 2022:
This zip code:
1.1% ($2,627)
Texas:
1.5% ($4,050)
Median real estate property taxes paid for housing units with mortgages in 2022: $2,897 (1.2%) Median real estate property taxes paid for housing units with no mortgage in 2022: $2,490 (1.0%)
Averages for the 2020 tax year for zip code 75103, filed in 2021:
Average Adjusted Gross Income (AGI) in 2020: $65,335 (Individual Income Tax Returns)
Here:
$65,335
State:
$77,054
Salary/wage: $55,851 (reported on 78.2% of returns)
Here:
$55,851
State:
$62,766
(% of AGI for various income ranges: 1098.7% for AGIs below $25k, 3586.7% for AGIs $25k-50k, 6137.1% for AGIs $50k-75k, 9146.0% for AGIs $75k-100k, 16227.1% for AGIs $100k-200k, 48756.7% for AGIs over 200k)
Taxable interest for individuals: $1,607 (reported on 25.9% of returns)
This zip code:
$1,607
Texas:
$2,665
(% of AGI for various income ranges: 15.7% for AGIs below $25k, 27.5% for AGIs $25k-50k, 42.8% for AGIs $50k-75k, 72.3% for AGIs $75k-100k, 94.2% for AGIs $100k-200k, 1048.9% for AGIs over 200k)
Ordinary dividends: $4,214 (reported on 14.7% of returns)
Here:
$4,214
State:
$10,044
(% of AGI for various income ranges: 21.0% for AGIs below $25k, 40.0% for AGIs $25k-50k, 76.9% for AGIs $50k-75k, 81.6% for AGIs $75k-100k, 175.9% for AGIs $100k-200k, 1394.4% for AGIs over 200k)
Net capital gain/loss in AGI: +$16,976 (reported on 14.5% of returns)
Here:
+$16,976
State:
+$39,590
(% of AGI for various income ranges: 11.4% for AGIs below $25k, 33.1% for AGIs $25k-50k, 140.4% for AGIs $50k-75k, 106.5% for AGIs $75k-100k, 565.3% for AGIs $100k-200k, 11640.0% for AGIs over 200k)
Profit/loss from business: +$12,645 (reported on 22.0% of returns)
Here:
+$12,645
State:
+$10,888
(% of AGI for various income ranges: 176.4% for AGIs below $25k, 210.6% for AGIs $25k-50k, 302.9% for AGIs $50k-75k, 339.1% for AGIs $75k-100k, 929.2% for AGIs $100k-200k, 4051.1% for AGIs over 200k)
Taxable individual retirement arrangement distribution: $19,558 (reported on 8.6% of returns)
75103:
$19,558
Texas:
$24,740
(% of AGI for various income ranges: 47.1% for AGIs below $25k, 111.4% for AGIs $25k-50k, 299.6% for AGIs $50k-75k, 412.1% for AGIs $75k-100k, 552.7% for AGIs $100k-200k, 1835.6% for AGIs over 200k)
Total itemized deductions: $39,251 (reported on 6.7% of returns)
Here:
$39,251
State:
$40,428
(% of AGI for various income ranges: 54.7% for AGIs below $25k, 160.1% for AGIs $25k-50k, 245.7% for AGIs $50k-75k, 315.1% for AGIs $75k-100k, 809.7% for AGIs $100k-200k, 7054.4% for AGIs over 200k)
Charity contributions: $14,634 (reported on 5.5% of returns)
Here:
$14,634
State:
$18,201
(% of AGI for various income ranges: 5.4% for AGIs below $25k, 22.9% for AGIs $25k-50k, 56.9% for AGIs $50k-75k, 65.6% for AGIs $75k-100k, 285.9% for AGIs $100k-200k, 2681.1% for AGIs over 200k)
Taxes paid: $6,793 (reported on 6.4% of returns)
75103:
$6,793
State:
$7,821
(% of AGI for various income ranges: 10.1% for AGIs below $25k, 31.7% for AGIs $25k-50k, 40.1% for AGIs $50k-75k, 61.6% for AGIs $75k-100k, 169.2% for AGIs $100k-200k, 800.0% for AGIs over 200k)
Earned income credit: $2,401 (reported on 17.0% of returns)
Here:
$2,401
State:
$2,584
(% of AGI for various income ranges: 106.4% for AGIs below $25k, 82.5% for AGIs $25k-50k, 2.4% for AGIs $50k-75k)
Percentage of individuals using paid preparers for their 2020 taxes: 92.2%
Here:
92%
State:
92%
(% for various income ranges: 91.5% for AGIs below $25k, 90.4% for AGIs $25k-50k, 93.6% for AGIs $50k-75k, 93.4% for AGIs $75k-100k, 93.8% for AGIs $100k-200k, 95.7% for AGIs over 200k)
Averages for the 2012 tax year for zip code 75103, filed in 2013:
Average Adjusted Gross Income (AGI) in 2012: $52,992 (Individual Income Tax Returns)
Here:
$52,992
State:
$65,384
Salary/wage: $45,246 (reported on 78.6% of returns)
Here:
$45,246
State:
$52,524
(% of AGI for various income ranges: 69.7% for AGIs below $25k, 74.5% for AGIs $25k-50k, 74.6% for AGIs $50k-75k, 77.1% for AGIs $75k-100k, 70.8% for AGIs $100k-200k, 37.5% for AGIs over 200k)
Taxable interest for individuals: $1,642 (reported on 29.9% of returns)
This zip code:
$1,642
Texas:
$2,372
(% of AGI for various income ranges: 1.7% for AGIs below $25k, 1.0% for AGIs $25k-50k, 0.7% for AGIs $50k-75k, 0.6% for AGIs $75k-100k, 0.5% for AGIs $100k-200k, 1.5% for AGIs over 200k)
Ordinary dividends: $5,037 (reported on 14.4% of returns)
Here:
$5,037
State:
$9,721
(% of AGI for various income ranges: 1.7% for AGIs below $25k, 0.6% for AGIs $25k-50k, 0.7% for AGIs $50k-75k, 0.6% for AGIs $75k-100k, 1.3% for AGIs $100k-200k, 3.3% for AGIs over 200k)
Net capital gain/loss in AGI: +$22,626 (reported on 13.3% of returns)
Here:
+$22,626
State:
+$35,319
(% of AGI for various income ranges: 0.5% for AGIs $25k-50k, 0.6% for AGIs $50k-75k, 0.9% for AGIs $75k-100k, 3.5% for AGIs $100k-200k, 25.8% for AGIs over 200k)
Profit/loss from business: +$13,384 (reported on 21.2% of returns)
Here:
+$13,384
State:
+$13,732
(% of AGI for various income ranges: 10.8% for AGIs below $25k, 4.6% for AGIs $25k-50k, 4.5% for AGIs $50k-75k, 3.5% for AGIs $75k-100k, 6.0% for AGIs $100k-200k, 4.8% for AGIs over 200k)
Taxable individual retirement arrangement distribution: $14,210 (reported on 10.7% of returns)
75103:
$14,210
Texas:
$19,511
(% of AGI for various income ranges: 3.9% for AGIs below $25k, 2.9% for AGIs $25k-50k, 3.3% for AGIs $50k-75k, 2.7% for AGIs $75k-100k, 4.2% for AGIs $100k-200k)
Total itemized deductions: $22,176 (22% of AGI, reported on 24.2% of returns)
Here:
$22,176
State:
$24,724
Here:
21.7% of AGI
State:
15.9% of AGI
(% of AGI for various income ranges: 9.3% for AGIs below $25k, 9.0% for AGIs $25k-50k, 10.2% for AGIs $50k-75k, 10.7% for AGIs $75k-100k, 10.9% for AGIs $100k-200k, 9.7% for AGIs over 200k)
Charity contributions: $5,946 (reported on 17.7% of returns)
Here:
$5,946
State:
$6,808
(% of AGI for various income ranges: 0.9% for AGIs below $25k, 1.5% for AGIs $25k-50k, 1.6% for AGIs $50k-75k, 2.1% for AGIs $75k-100k, 2.7% for AGIs $100k-200k, 2.3% for AGIs over 200k)
Taxes paid: $4,706 (reported on 23.8% of returns)
75103:
$4,706
State:
$6,921
(% of AGI for various income ranges: 1.4% for AGIs below $25k, 1.6% for AGIs $25k-50k, 2.0% for AGIs $50k-75k, 2.4% for AGIs $75k-100k, 2.7% for AGIs $100k-200k, 2.0% for AGIs over 200k)
Earned income credit: $2,332 (reported on 20.3% of returns)
Here:
$2,332
State:
$2,570
(% of AGI for various income ranges: 7.3% for AGIs below $25k, 1.3% for AGIs $25k-50k)
Percentage of individuals using paid preparers for their 2012 taxes: 60.1%
Here:
60%
State:
51%
(% for various income ranges: 54.1% for AGIs below $25k, 59.8% for AGIs $25k-50k, 63.2% for AGIs $50k-75k, 65.4% for AGIs $75k-100k, 69.6% for AGIs $100k-200k, 90.9% for AGIs over 200k)
Averages for the 2004 tax year for zip code 75103, filed in 2005:
Average Adjusted Gross Income (AGI) in 2004: $38,486 (Individual Income Tax Returns)
Here:
$38,486
State:
$47,881
Salary/wage: $36,022 (reported on 77.5% of returns)
Here:
$36,022
State:
$41,947
(% of AGI for various income ranges: 330.6% for AGIs below $10k, 70.7% for AGIs $10k-25k, 76.7% for AGIs $25k-50k, 76.1% for AGIs $50k-75k, 79.0% for AGIs $75k-100k, 55.4% for AGIs over 100k)
Taxable interest for individuals: $2,285 (reported on 37.2% of returns)
This zip code:
$2,285
Texas:
$2,255
(% of AGI for various income ranges: 35.0% for AGIs below $10k, 3.0% for AGIs $10k-25k, 2.0% for AGIs $25k-50k, 1.3% for AGIs $50k-75k, 1.6% for AGIs $75k-100k, 2.3% for AGIs over 100k)
Taxable dividends: $2,523 (reported on 18.4% of returns)
Here:
$2,523
State:
$4,261
(% of AGI for various income ranges: 15.3% for AGIs below $10k, 1.0% for AGIs $10k-25k, 0.7% for AGIs $25k-50k, 0.8% for AGIs $50k-75k, 0.8% for AGIs $75k-100k, 2.0% for AGIs over 100k)
Net capital gain/loss: +$10,496 (reported on 17.5% of returns)
Here:
+$10,496
State:
+$16,110
(% of AGI for various income ranges: 7.5% for AGIs below $10k, 1.6% for AGIs $10k-25k, 0.9% for AGIs $25k-50k, 2.0% for AGIs $50k-75k, 1.5% for AGIs $75k-100k, 13.9% for AGIs over 100k)
Profit/loss from business: +$10,037 (reported on 23.3% of returns)
Here:
+$10,037
State:
+$11,013
(% of AGI for various income ranges: 46.2% for AGIs below $10k, 10.4% for AGIs $10k-25k, 4.5% for AGIs $25k-50k, 4.0% for AGIs $50k-75k, 4.4% for AGIs $75k-100k, 7.3% for AGIs over 100k)
IRA payment deduction: $3,724 (reported on 2.0% of returns)
75103:
$3,724
Texas:
$3,120
(% of AGI for various income ranges: 0.2% for AGIs $10k-25k, 0.3% for AGIs $25k-50k, 0.1% for AGIs $50k-75k, 0.3% for AGIs $75k-100k, 0.1% for AGIs over 100k)
Total itemized deductions: $17,842 (24% of AGI, reported on 21.5% of returns)
Here:
$17,842
State:
$19,631
Here:
23.9% of AGI
State:
18.9% of AGI
(% of AGI for various income ranges: 42.1% for AGIs below $10k, 7.6% for AGIs $10k-25k, 8.5% for AGIs $25k-50k, 9.8% for AGIs $50k-75k, 10.6% for AGIs $75k-100k, 11.2% for AGIs over 100k)
Charity contributions deductions: $4,854 (6% of AGI, reported on 17.0% of returns)
Here:
$4,854
State:
$4,753
Here:
6.2% of AGI
State:
4.2% of AGI
(% of AGI for various income ranges: 2.6% for AGIs below $10k, 1.2% for AGIs $10k-25k, 1.4% for AGIs $25k-50k, 1.8% for AGIs $50k-75k, 2.2% for AGIs $75k-100k, 3.5% for AGIs over 100k)
Total tax: $5,560 (reported on 71.9% of returns)
75103:
$5,560
State:
$9,058
(% of AGI for various income ranges: 14.7% for AGIs below $10k, 4.2% for AGIs $10k-25k, 6.4% for AGIs $25k-50k, 8.6% for AGIs $50k-75k, 10.9% for AGIs $75k-100k, 17.7% for AGIs over 100k)
Earned income credit: $1,782 (reported on 18.7% of returns)
Here:
$1,782
State:
$2,024
Percentage of individuals using paid preparers for their 2004 taxes: 65.8%
Here:
66%
State:
57%
(% for various income ranges: 57.8% for AGIs below $10k, 66.6% for AGIs $10k-25k, 65.0% for AGIs $25k-50k, 71.0% for AGIs $50k-75k, 68.9% for AGIs $75k-100k, 80.6% for AGIs over 100k)
Likely homosexual households (counted as self-reported same-sex unmarried-partner households)
Lesbian couples: 0.2% of all households
Gay men: 0.0% of all households
Household received Food Stamps/SNAP in the past 12 months: 589 Household did not receive Food Stamps/SNAP in the past 12 months: 5,959
Women who had a birth in the past 12 months: 227 (159 now married, 68 unmarried) Women who did not have a birth in the past 12 months: 3,004 (1,644 now married, 1,349 unmarried)
Housing units in zip code 75103 with a mortgage: 2,205 (64 second mortgage, 69 both second mortgage and home equity loan) Houses without a mortgage: 54
Median monthly owner costs for units with a mortgage: $1,431 Median monthly owner costs for units without a mortgage: $580
Residents with income below the poverty level in 2022:
This zip code:
8.4%
Whole state:
14.0%
Residents with income below 50% of the poverty level in 2022:
This zip code:
3.7%
Whole state:
7.4%
Median number of rooms in houses and condos:
Here:
6.0
State:
6.3
Median number of rooms in apartments:
Here:
4.9
State:
4.0
Notable locations in this zip code not listed on our city pages
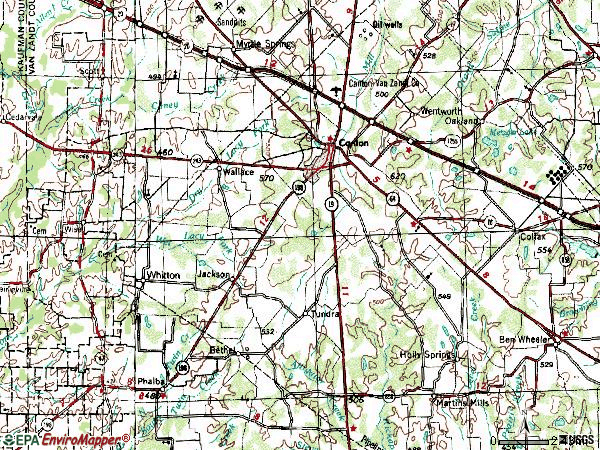
Notable locations in zip code 75103: Little Hope-Moore Community Center (A), Whitton Rural Volunteer Fire (B), Canton Volunteer Fire Department (C), South Van Zandt Volunteer Fire Department Station 3 (D). Display/hide their locations on the map
Churches in zip code 75103 include: Starr Church (A), Teel Church (B), Walnut Spring Church (C), Bethel Church (D), Big Rock Church (E), Saint Justins Episcopal Church (F), Church of Christ on Big Rock (G), Oak Grove Baptist Church (H), Cool Springs Church (I). Display/hide their locations on the map
Cemeteries: Morris Chapel Cemetery (1), Carter Cemetery (2), Wesley Chapel Cemetery (3), Cox Cemetery (4), Oakland Cemetery (5), Haven of Memories Cemetery (6), Traver Cemetery (7). Display/hide their locations on the map
Reservoirs: Spring Lake (A), Lake Phalba (B), Metzger Lake (C), Club Twenty Lake (D), City Lake (E), Alexander Lake (F), Charles Napper Lake (G), Dubose Lake (H). Display/hide their locations on the map
Streams, rivers, and creeks: Willow Branch (A), Sandy Creek (B), Sandy Branch (C), Sand Branch (D), Rats Branch (E), Pole Branch (F), Myrtle Branch (G), Mustang Creek (H), Dry Lacy Fork (I). Display/hide their locations on the map
2,056 married couples with children.
553 single-parent households (173 men, 380 women).
94.2% of residents of 75103 zip code speak English at home.
4.9% of residents speak Spanish at home (68% very well, 15% well, 10% not well, 7% not at all).
0.8% of residents speak other Indo-European language at home (100% very well).
0.3% of residents speak Asian or Pacific Island language at home (59% very well, 20% well, 22% not well).
0.1% of residents speak other language at home (100% very well).
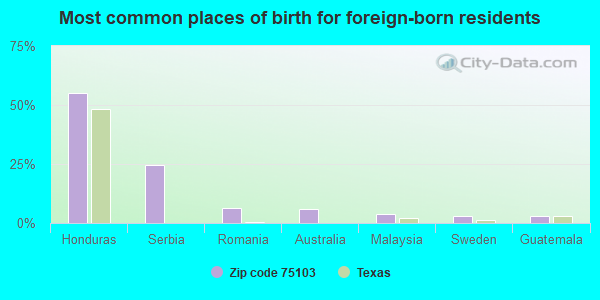
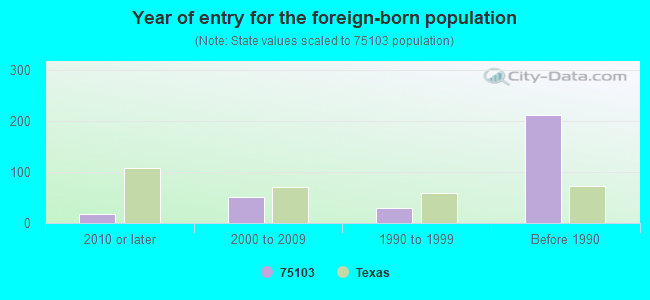
Foreign born population: 272 (1.6%) (54.6% of them are naturalized citizens)
This zip code:
1.6%
Whole state:
17.2%
55%Honduras
25%Serbia
6%Romania
6%Australia
4%Malaysia
3%Sweden
3%Guatemala
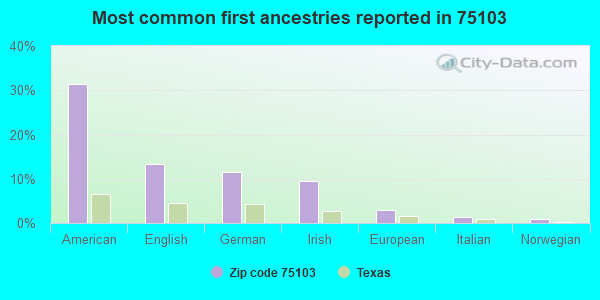
31%American
13%English
11%German
9%Irish
3%European
1%Italian
1%Norwegian
Year of entry for the foreign-born population
182010 or later
522000 to 2009
291990 to 1999
212Before 1990
Facilities with environmental interests located in this zip code:
ACE CLEANERS (240 SOUTH TRADE DAY BLVD in CANTON, TX)
AIR MINOR (AIRS/AFS) Business SIC classification: DRYCLEANING PLANTS, EXCEPT RUG CLEANING
Housing units lacking complete plumbing facilities: 1.7% Housing units lacking complete kitchen facilities: 2.4%
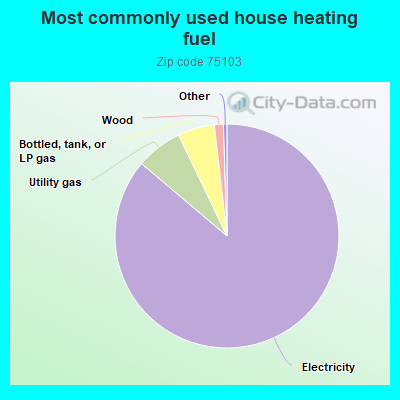
86.2%Electricity
6.7%Utility gas
5.3%Bottled, tank, or LP gas
1.3%Wood
Population in 1990: 12,281.
Place of birth for U.S.-born residents:
This state: 12,367
Northeast: 347
Midwest: 1,135
South: 1,329
West: 1,234
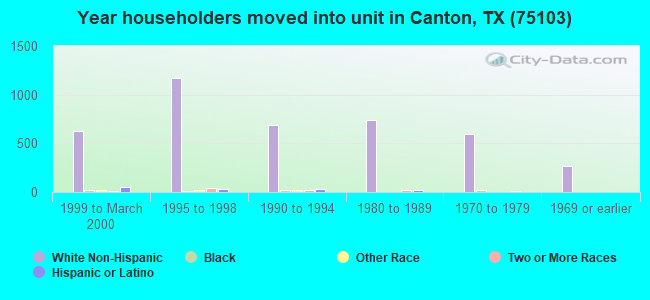
60% of the 75103 zip code residents lived in the same house 5 years ago. Out of people who lived in different houses, 44% lived in this county. Out of people who lived in different counties, 50% lived in Texas.
86% of the 75103 zip code residents lived in the same house 1 year ago. Out of people who lived in different houses, 28% moved from this county. Out of people who lived in different houses, 52% moved from different county within same state. Out of people who lived in different houses, 5% moved from different state. Out of people who lived in different houses, 17% moved from abroad.
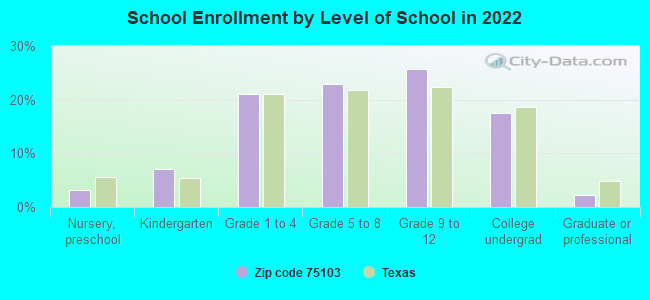
Private vs. public school enrollment:
Students in private schools in grades 1 to 8 (elementary and middle school): 142
Here:
9.8%
Texas:
8.8%
Students in private schools in grades 9 to 12 (high school): 68
Here:
8.1%
Texas:
8.0%
Students in private undergraduate colleges: 131
Here:
22.5%
Texas:
16.2%
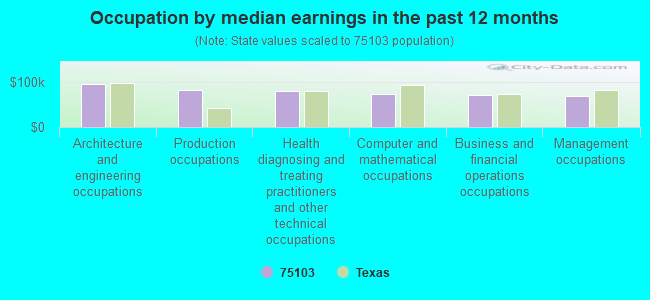
Occupation by median earnings in the past 12 months ($)
95,089Architecture and engineering occupations
83,092Production occupations
79,311Health diagnosing and treating practitioners and other technical occupations
72,595Computer and mathematical occupations
71,265Business and financial operations occupations
68,128Management occupations
Companies with federal contracts located in this zip code:
SMITH, MICHAEL (412 VAN ZANDT COUNTY RD 41 in CANTON, TX; small business) : $29,300 in 6 contractsfrom 2004 to 2005
Contracts for Reserve Training (Military) by Army Signed by year:2000: $0; 2001: $0; 2002: $0; 2003: $0; 2004: $39,800; 2005: -$10,500; 2006: $0.
Biggest contracts:
$18,300 with Army for Reserve Training (Military). Signed on 2004-10-01. Completion date: 2004-09-30.
$9,000, same as above.Signed on 2004-09-01. Completion date: 2004-09-30.
$6,600, same as above.Signed on 2004-08-09. Completion date: 2004-08-31.
$3,600, same as above.Signed on 2004-12-15. Completion date: 2004-09-30.
KENDRICK TRAILER SALES INC (17999 INTERSTATE 20 in CANTON, TX; small business)
$7,975 with Army for Trailers. Signed on 2006-06-23. Completion date: 2006-07-21.
Top industries in this zip code by the number of employees in 2005:
Administrative and Support and Waste Management and Remediation Services: Telemarketing Bureaus (250-499 employees: 1 establishment)
Health Care and Social Assistance: Residential Mental Health and Substance Abuse Facilities (100-249: 1)
Health Care and Social Assistance: Nursing Care Facilities (50-99: 2)
Other Services (except Public Administration): Religious Organizations (20-49: 2, 10-19: 1, 5-9: 2, 1-4: 9)
People in group quarters in 2010:
134 people in local jails and other municipal confinement facilities
122 people in nursing facilities/skilled-nursing facilities
64 people in mental (psychiatric) hospitals and psychiatric units in other hospitals
19 people in group homes intended for adults
People in group quarters in 2000:
167 people in nursing homes
87 people in local jails and other confinement facilities (including police lockups)
50 people in hospitals or wards for drug/alcohol abuse
46 people in homes for the mentally retarded
11 people in other noninstitutional group quarters
Fatal accident statistics in 2014:
Fatal accident count: 1
Vehicles involved in fatal accidents: 2
Fatal accidents caused by drunken drivers: 0
Fatalities: 1
Persons involved in fatal accidents: 2
Pedestrians involved in fatal accidents: 0
Fatal accident statistics in 2013:
Fatal accident count: 4
Vehicles involved in fatal accidents: 7
Fatal accidents caused by drunken drivers: 0
Fatalities: 5
Persons involved in fatal accidents: 9
Pedestrians involved in fatal accidents: 0
2002 - 2018 National Fire Incident Reporting System (NFIRS) incidents
According to the data from the years 2002 - 2018 the average number of fire incidents per year is 198. The highest number of reported fire incidents - 306 took place in 2006, and the least - 137 in 2012. The data has a growing trend.
When looking into fire subcategories, the most reports belonged to: Outside Fires (65.9%), and Structure Fires (19.7%).
Fire incident types reported to NFIRS in Zip Code 75103

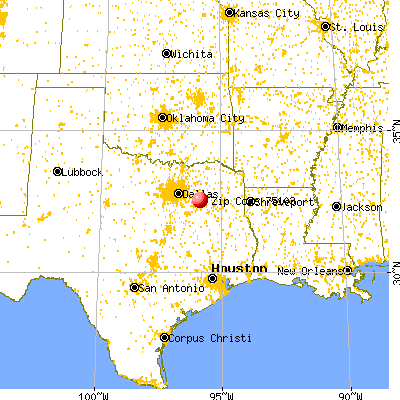


 Nearest zip codes: 75127, 75117, 75124, 75147, 75169, 75140.


 According to the data from the years 2002 - 2018 the average number of fire incidents per year is 198. The highest number of reported fire incidents - 306 took place in 2006, and the least - 137 in 2012. The data has a growing trend.
 When looking into fire subcategories, the most reports belonged to: Outside Fires (65.9%), and Structure Fires (19.7%).