Estimated zip code population in 2022: 5,978 Zip code population in 2010: 4,446 Zip code population in 2000: 4,036
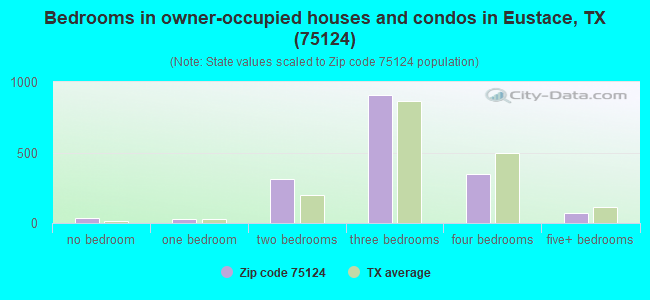
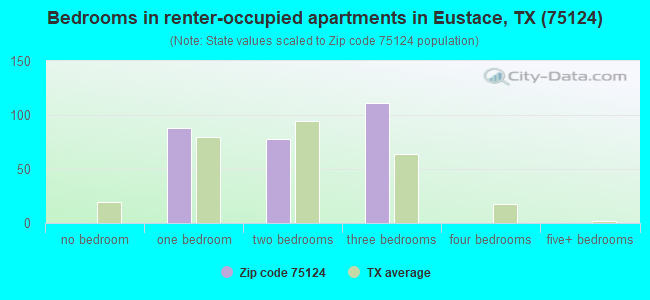
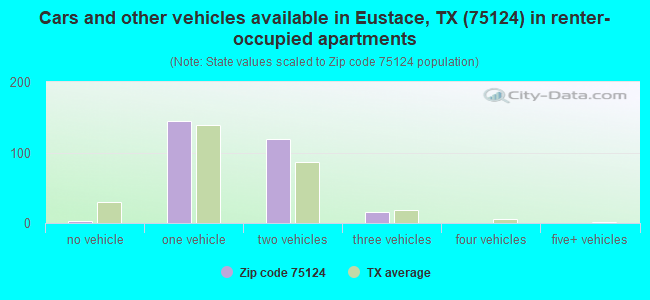
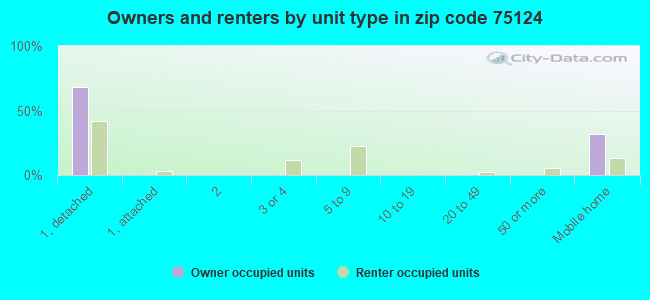
Houses and condos: 2,389 Renter-occupied apartments: 282
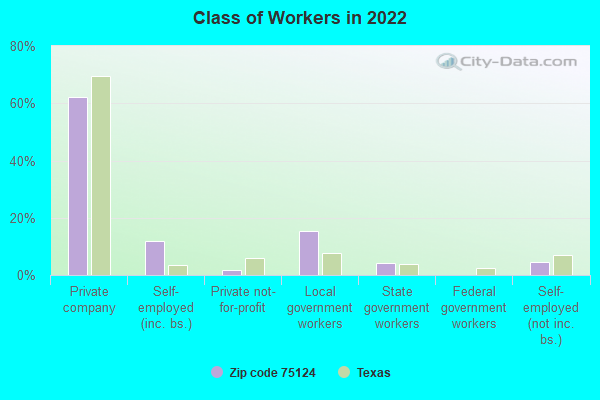
% of renters here:
14%
State:
38%
March 2022 cost of living index in zip code 75124: 83.5 (less than average, U.S. average is 100)
Land area: 93.0 sq. mi. Water area: 2.0 sq. mi.
Population density: 64 people per square mile
(very low).
OSM Map
General Map
Google Map
MSN Map
OSM Map
General Map
Google Map
MSN Map
OSM Map
General Map
Google Map
MSN Map
OSM Map
General Map
Google Map
MSN Map
Please wait while loading the map...
Real estate property taxes paid for housing units in 2022:
This zip code:
0.9% ($1,603)
Texas:
1.5% ($4,050)
Median real estate property taxes paid for housing units with mortgages in 2022: $1,880 (1.0%) Median real estate property taxes paid for housing units with no mortgage in 2022: $1,221 (0.8%)
Business Search- 14 Million verified businesses
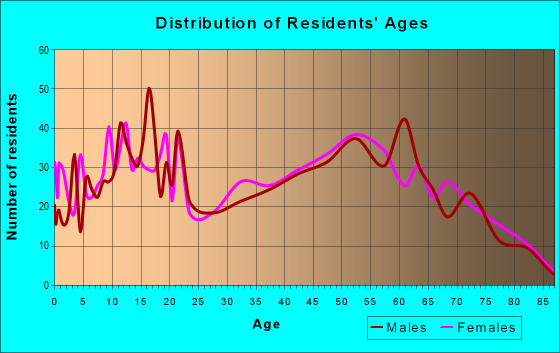
Males: 2,868
(48.0%)
Females: 3,109
(52.0%)
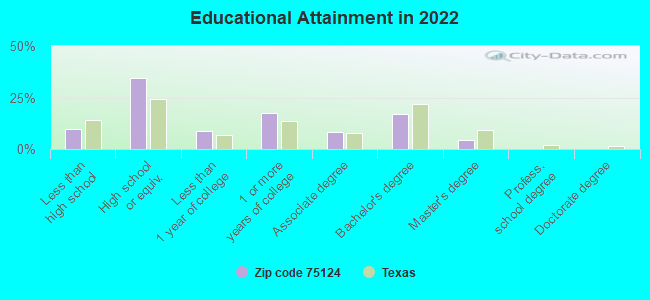
For population 25 years and over in 75124:
High school or higher: 89.3%
Bachelor's degree or higher: 21.2%
Graduate or professional degree: 4.4%
Unemployed: 4.1%
Mean travel time to work (commute): 33.6 minutes
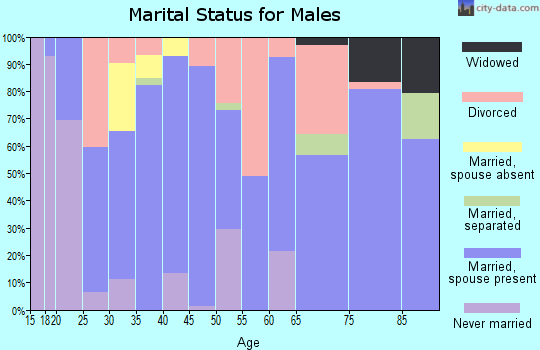
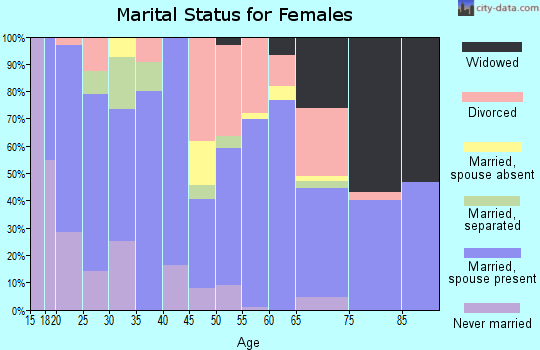
For population 15 years and over in 75124:
Never married: 27.6%
Now married: 55.0%
Separated: 2.0%
Widowed: 7.2%
Divorced: 8.3%
Zip code 75124 compared to state average:
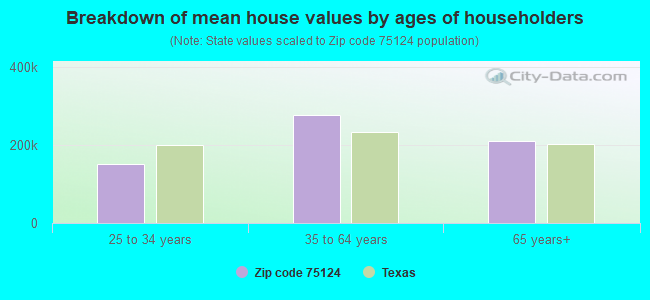
Median house value below state average.
Black race population percentage significantly below state average.
Hispanic race population percentage significantly below state average.
Median age above state average.
Foreign-born population percentage significantly below state average.
Renting percentage significantly below state average.
Length of stay since moving in significantly above state average.
House age below state average.
Number of college students below state average.
Percentage of population with a bachelor's degree or higher below state average.
Averages for the 2020 tax year for zip code 75124, filed in 2021:
Average Adjusted Gross Income (AGI) in 2020: $56,149 (Individual Income Tax Returns)
Here:
$56,149
State:
$77,054
Salary/wage: $50,507 (reported on 78.2% of returns)
Here:
$50,507
State:
$62,766
(% of AGI for various income ranges: 1118.1% for AGIs below $25k, 3449.2% for AGIs $25k-50k, 5873.9% for AGIs $50k-75k, 8522.4% for AGIs $75k-100k, 15298.1% for AGIs $100k-200k, 52895.0% for AGIs over 200k)
Taxable interest for individuals: $1,075 (reported on 20.9% of returns)
This zip code:
$1,075
Texas:
$2,665
(% of AGI for various income ranges: 17.2% for AGIs below $25k, 29.5% for AGIs $25k-50k, 30.0% for AGIs $50k-75k, 40.6% for AGIs $75k-100k, 16.9% for AGIs $100k-200k, 450.0% for AGIs over 200k)
Ordinary dividends: $4,029 (reported on 10.0% of returns)
Here:
$4,029
State:
$10,044
(% of AGI for various income ranges: 11.2% for AGIs below $25k, 38.5% for AGIs $25k-50k, 28.7% for AGIs $50k-75k, 72.4% for AGIs $75k-100k, 135.6% for AGIs $100k-200k, 1105.0% for AGIs over 200k)
Net capital gain/loss in AGI: +$12,624 (reported on 10.0% of returns)
Here:
+$12,624
State:
+$39,590
(% of AGI for various income ranges: 4.0% for AGIs below $25k, 26.5% for AGIs $25k-50k, 60.4% for AGIs $50k-75k, 60.0% for AGIs $75k-100k, 313.1% for AGIs $100k-200k, 8900.0% for AGIs over 200k)
Profit/loss from business: +$9,673 (reported on 21.3% of returns)
Here:
+$9,673
State:
+$10,888
(% of AGI for various income ranges: 179.5% for AGIs below $25k, 175.0% for AGIs $25k-50k, 263.0% for AGIs $50k-75k, 349.4% for AGIs $75k-100k, 883.1% for AGIs $100k-200k)
Taxable individual retirement arrangement distribution: $25,200 (reported on 8.1% of returns)
75124:
$25,200
Texas:
$24,740
(% of AGI for various income ranges: 58.3% for AGIs below $25k, 104.0% for AGIs $25k-50k, 174.3% for AGIs $50k-75k, 298.2% for AGIs $75k-100k, 1638.8% for AGIs $100k-200k)
Total itemized deductions: $38,010 (reported on 4.7% of returns)
Here:
$38,010
State:
$40,428
(% of AGI for various income ranges: 681.3% for AGIs $50k-75k, 638.1% for AGIs $100k-200k, 6065.0% for AGIs over 200k)
Charity contributions: $14,550 (reported on 3.8% of returns)
Here:
$14,550
State:
$18,201
(% of AGI for various income ranges: 137.4% for AGIs $50k-75k, 530.0% for AGIs $100k-200k)
Taxes paid: $6,010 (reported on 4.7% of returns)
75124:
$6,010
State:
$7,821
(% of AGI for various income ranges: 101.7% for AGIs $50k-75k, 123.8% for AGIs $100k-200k, 845.0% for AGIs over 200k)
Earned income credit: $2,667 (reported on 21.3% of returns)
Here:
$2,667
State:
$2,584
(% of AGI for various income ranges: 135.5% for AGIs below $25k, 103.5% for AGIs $25k-50k)
Percentage of individuals using paid preparers for their 2020 taxes: 93.4%
Here:
93%
State:
92%
(% for various income ranges: 93.4% for AGIs below $25k, 92.3% for AGIs $25k-50k, 93.3% for AGIs $50k-75k, 95.5% for AGIs $75k-100k, 96.0% for AGIs $100k-200k, 83.3% for AGIs over 200k)
Averages for the 2012 tax year for zip code 75124, filed in 2013:
Average Adjusted Gross Income (AGI) in 2012: $42,868 (Individual Income Tax Returns)
Here:
$42,868
State:
$65,384
Salary/wage: $40,052 (reported on 80.6% of returns)
Here:
$40,052
State:
$52,524
(% of AGI for various income ranges: 71.0% for AGIs below $25k, 77.7% for AGIs $25k-50k, 78.5% for AGIs $50k-75k, 75.5% for AGIs $75k-100k, 104.0% for AGIs $100k-200k)
Taxable interest for individuals: $883 (reported on 22.8% of returns)
This zip code:
$883
Texas:
$2,372
(% of AGI for various income ranges: 1.1% for AGIs below $25k, 0.8% for AGIs $25k-50k, 0.3% for AGIs $50k-75k, 0.4% for AGIs $75k-100k, 0.2% for AGIs $100k-200k)
Ordinary dividends: $3,124 (reported on 11.7% of returns)
Here:
$3,124
State:
$9,721
(% of AGI for various income ranges: 1.4% for AGIs below $25k, 0.9% for AGIs $25k-50k, 0.5% for AGIs $50k-75k, 1.6% for AGIs $75k-100k, 0.6% for AGIs $100k-200k)
Net capital gain/loss in AGI: +$2,247 (reported on 8.3% of returns)
Here:
+$2,247
State:
+$35,319
(% of AGI for various income ranges: 0.4% for AGIs below $25k, 0.1% for AGIs $25k-50k, 0.4% for AGIs $50k-75k, 1.3% for AGIs $75k-100k, 0.3% for AGIs $100k-200k)
Profit/loss from business: +$7,562 (reported on 21.7% of returns)
Here:
+$7,562
State:
+$13,732
(% of AGI for various income ranges: 13.8% for AGIs below $25k, 5.4% for AGIs $25k-50k, 1.0% for AGIs $50k-75k, 2.4% for AGIs $75k-100k, 1.5% for AGIs $100k-200k)
Taxable individual retirement arrangement distribution: $15,980 (reported on 8.3% of returns)
75124:
$15,980
Texas:
$19,511
(% of AGI for various income ranges: 2.8% for AGIs below $25k, 1.7% for AGIs $25k-50k, 3.7% for AGIs $50k-75k, 9.5% for AGIs $75k-100k)
Total itemized deductions: $21,159 (25% of AGI, reported on 17.8% of returns)
Here:
$21,159
State:
$24,724
Here:
25.2% of AGI
State:
15.9% of AGI
(% of AGI for various income ranges: 5.8% for AGIs below $25k, 6.6% for AGIs $25k-50k, 9.5% for AGIs $50k-75k, 10.6% for AGIs $75k-100k, 14.2% for AGIs $100k-200k)
Charity contributions: $4,558 (reported on 13.3% of returns)
Here:
$4,558
State:
$6,808
(% of AGI for various income ranges: 0.6% for AGIs below $25k, 0.8% for AGIs $25k-50k, 1.9% for AGIs $50k-75k, 1.5% for AGIs $75k-100k, 2.6% for AGIs $100k-200k)
Taxes paid: $4,378 (reported on 17.8% of returns)
75124:
$4,378
State:
$6,921
(% of AGI for various income ranges: 0.7% for AGIs below $25k, 1.0% for AGIs $25k-50k, 1.7% for AGIs $50k-75k, 2.4% for AGIs $75k-100k, 3.6% for AGIs $100k-200k)
Earned income credit: $2,356 (reported on 26.7% of returns)
Here:
$2,356
State:
$2,570
(% of AGI for various income ranges: 8.6% for AGIs below $25k, 1.7% for AGIs $25k-50k)
Percentage of individuals using paid preparers for their 2012 taxes: 56.7%
Here:
57%
State:
51%
(% for various income ranges: 53.1% for AGIs below $25k, 54.5% for AGIs $25k-50k, 64.0% for AGIs $50k-75k, 62.5% for AGIs $75k-100k, 75.0% for AGIs $100k-200k)
Averages for the 2004 tax year for zip code 75124, filed in 2005:
Average Adjusted Gross Income (AGI) in 2004: $32,191 (Individual Income Tax Returns)
Here:
$32,191
State:
$47,881
Salary/wage: $31,415 (reported on 81.1% of returns)
Here:
$31,415
State:
$41,947
(% of AGI for various income ranges: 142.7% for AGIs below $10k, 73.0% for AGIs $10k-25k, 83.4% for AGIs $25k-50k, 83.2% for AGIs $50k-75k, 77.5% for AGIs $75k-100k, 64.0% for AGIs over 100k)
Taxable interest for individuals: $1,377 (reported on 29.5% of returns)
This zip code:
$1,377
Texas:
$2,255
(% of AGI for various income ranges: 8.2% for AGIs below $10k, 2.7% for AGIs $10k-25k, 0.7% for AGIs $25k-50k, 1.0% for AGIs $50k-75k, 1.1% for AGIs $75k-100k, 0.5% for AGIs over 100k)
Taxable dividends: $1,196 (reported on 14.1% of returns)
Here:
$1,196
State:
$4,261
(% of AGI for various income ranges: 1.9% for AGIs below $10k, 0.7% for AGIs $10k-25k, 0.4% for AGIs $25k-50k, 0.4% for AGIs $50k-75k, 0.3% for AGIs $75k-100k, 0.7% for AGIs over 100k)
Net capital gain/loss: +$4,966 (reported on 12.1% of returns)
Here:
+$4,966
State:
+$16,110
(% of AGI for various income ranges: -2.0% for AGIs below $10k, 0.9% for AGIs $10k-25k, 0.2% for AGIs $25k-50k, 1.5% for AGIs $50k-75k, 3.8% for AGIs $75k-100k, 4.9% for AGIs over 100k)
Profit/loss from business: +$5,834 (reported on 23.3% of returns)
Here:
+$5,834
State:
+$11,013
(% of AGI for various income ranges: 10.6% for AGIs below $10k, 12.8% for AGIs $10k-25k, 3.8% for AGIs $25k-50k, 3.0% for AGIs $50k-75k, 0.7% for AGIs $75k-100k, 1.5% for AGIs over 100k)
IRA payment deduction: $3,065 (reported on 1.8% of returns)
75124:
$3,065
Texas:
$3,120
Total itemized deductions: $16,432 (27% of AGI, reported on 17.6% of returns)
Here:
$16,432
State:
$19,631
Here:
26.8% of AGI
State:
18.9% of AGI
(% of AGI for various income ranges: 8.6% for AGIs below $10k, 6.8% for AGIs $10k-25k, 9.6% for AGIs $25k-50k, 9.1% for AGIs $50k-75k, 9.6% for AGIs $75k-100k, 9.4% for AGIs over 100k)
Charity contributions deductions: $3,251 (5% of AGI, reported on 14.0% of returns)
Here:
$3,251
State:
$4,753
Here:
5.0% of AGI
State:
4.2% of AGI
(% of AGI for various income ranges: 0.9% for AGIs $10k-25k, 1.1% for AGIs $25k-50k, 1.4% for AGIs $50k-75k, 2.1% for AGIs $75k-100k, 1.9% for AGIs over 100k)
Total tax: $4,042 (reported on 68.3% of returns)
75124:
$4,042
State:
$9,058
(% of AGI for various income ranges: 5.7% for AGIs below $10k, 4.6% for AGIs $10k-25k, 5.7% for AGIs $25k-50k, 8.0% for AGIs $50k-75k, 10.7% for AGIs $75k-100k, 16.2% for AGIs over 100k)
Earned income credit: $2,099 (reported on 24.4% of returns)
Here:
$2,099
State:
$2,024
Percentage of individuals using paid preparers for their 2004 taxes: 62.5%
Here:
62%
State:
57%
(% for various income ranges: 53.0% for AGIs below $10k, 67.9% for AGIs $10k-25k, 62.4% for AGIs $25k-50k, 68.5% for AGIs $50k-75k, 65.1% for AGIs $75k-100k, 64.3% for AGIs over 100k)
Household received Food Stamps/SNAP in the past 12 months: 329 Household did not receive Food Stamps/SNAP in the past 12 months: 1,664
Women who had a birth in the past 12 months: 61 (42 now married, 18 unmarried) Women who did not have a birth in the past 12 months: 1,329 (615 now married, 713 unmarried)
Housing units in zip code 75124 with a mortgage: 765 (9 second mortgage) Houses without a mortgage: 12
Median monthly owner costs for units with a mortgage: $1,742 Median monthly owner costs for units without a mortgage: $478
Residents with income below the poverty level in 2022:
This zip code:
9.9%
Whole state:
14.0%
Residents with income below 50% of the poverty level in 2022:
This zip code:
6.4%
Whole state:
7.4%
Median number of rooms in houses and condos:
Here:
5.9
State:
6.3
Median number of rooms in apartments:
Here:
4.5
State:
4.0
Notable locations in this zip code not listed on our city pages
Cemeteries: Morris Cemetery (1), Chinquapin Cemetery (2), Cottonwood Cemetery (3), Goshen Cemetery (4), Payne Cemetery (5), Mabank Cemetery (6), Moorehead Cemetery (7). Display/hide their locations on the map
Lakes and reservoirs: Pollard Lake (A), Abernathy Lake (B), Bush Lake (C), Thomas Lake (D), Forest Grove Reservoir (E). Display/hide their locations on the map
Streams, rivers, and creeks: Red Oak Branch (A), Purtis Creek (B), Mill Creek (C), Helms Branch (D), Briar Creek (E). Display/hide their locations on the map
In group quarters: 20 (-1 institutionalized population)
Size of family households: 672 2-persons, 325 3-persons, 304 4-persons, 174 5-persons, 30 6-persons, 76 7-or-more-persons
Size of nonfamily households: 368 1-person, 29 2-persons
1,076 married couples with children.
191 single-parent households (65 men, 126 women).
96.4% of residents of 75124 zip code speak English at home.
3.2% of residents speak Spanish at home (90% very well, 5% well, 4% not well, 1% not at all).
0.3% of residents speak other Indo-European language at home (100% very well).
0.3% of residents speak Asian or Pacific Island language at home (47% very well, 53% not well).
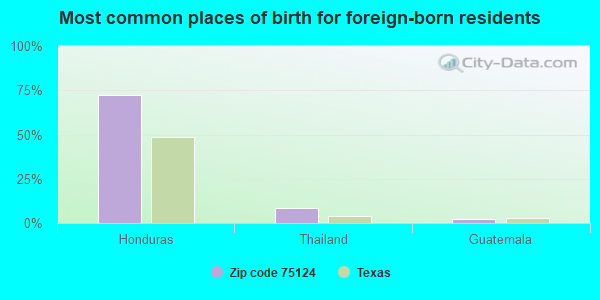
Foreign born population: 99 (1.7%) (89.0% of them are naturalized citizens)
This zip code:
1.7%
Whole state:
17.2%
72%Honduras
9%Thailand
2%Guatemala
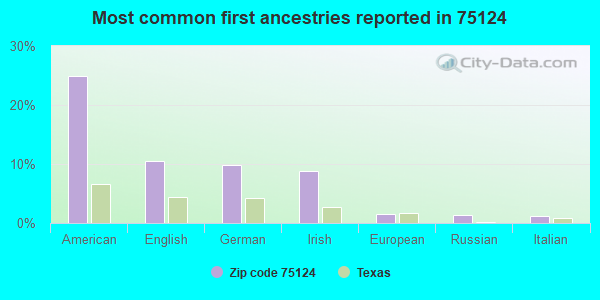
25%American
10%English
10%German
9%Irish
1%European
1%Russian
1%Italian
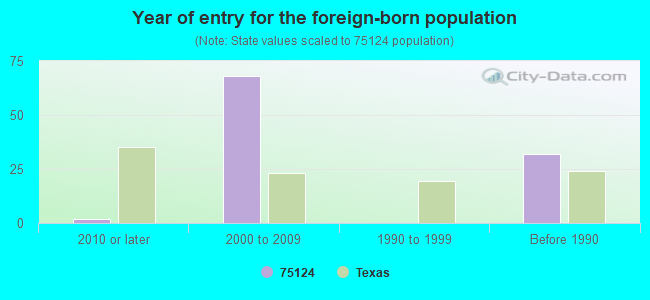
Year of entry for the foreign-born population
22010 or later
682000 to 2009
01990 to 1999
32Before 1990
Housing units lacking complete plumbing facilities: 0.5% Housing units lacking complete kitchen facilities: 4.1%
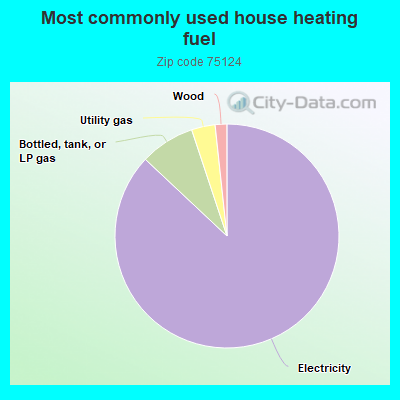
87.1%Electricity
7.9%Bottled, tank, or LP gas
3.4%Utility gas
1.7%Wood
Population in 1990: 2,192. Population change in the 1990s: +1,844 (+84.1%).
Place of birth for U.S.-born residents:
This state: 4,630
Northeast: 171
Midwest: 138
South: 576
West: 315
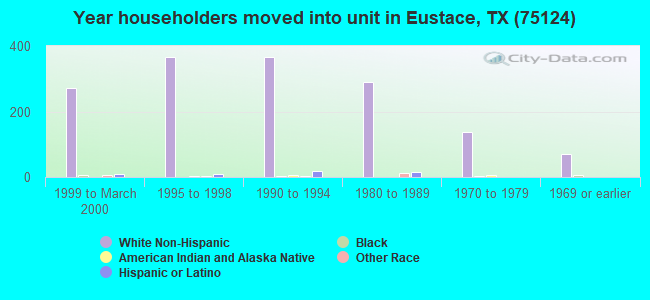
62% of the 75124 zip code residents lived in the same house 5 years ago. Out of people who lived in different houses, 40% lived in this county. Out of people who lived in different counties, 50% lived in Texas.
95% of the 75124 zip code residents lived in the same house 1 year ago. Out of people who lived in different houses, 42% moved from this county. Out of people who lived in different houses, 51% moved from different county within same state. Out of people who lived in different houses, 10% moved from different state.
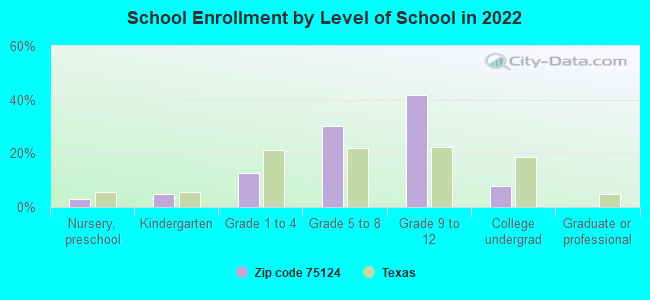
Private vs. public school enrollment:
Students in private schools in grades 1 to 8 (elementary and middle school): 155
Here:
23.2%
Texas:
8.8%
Students in private schools in grades 9 to 12 (high school): 355
Here:
52.5%
Texas:
8.0%
Students in private undergraduate colleges:
Here:
0.0%
Texas:
16.2%
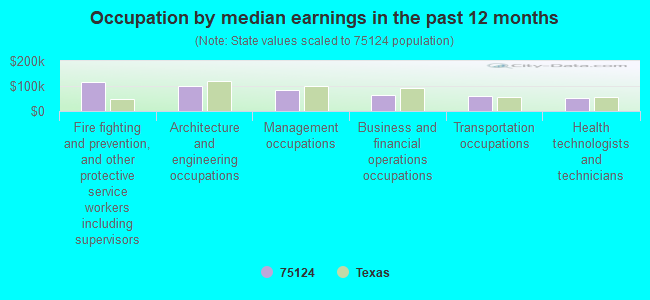
Occupation by median earnings in the past 12 months ($)
115,131Fire fighting and prevention, and other protective service workers including supervisors
101,343Architecture and engineering occupations
83,563Management occupations
62,919Business and financial operations occupations
58,237Transportation occupations
51,272Health technologists and technicians
Companies with federal contracts located in this zip code:
ANTHONY BOILER COMPANY INC (12909 COUNTY ROAD 2919 in EUSTACE, TX; small business) : $229,419 in 6 contractsfrom 2000 to 2006
Contracts for Maintenance, Repair or Alteration of Real Property -- Heating and Cooling Plants, Air Conditioning Equipment, Maintenance, Repair and Rebuilding of Equipment -- Furnace, Steam Plant, and Drying Equipment; and Nuclear Reactors, Installation of Equipment -- Plumbing, Heating, and Waste Disposal Equipment by Army, Air Force Signed by year:2000: $157,813; 2001: $0; 2002: $0; 2003: $0; 2004: $0; 2005: $18,791; 2006: $52,815.
Biggest contracts:
$74,563 with Army for Maintenance, Repair or Alteration of Real Property -- Heating and Cooling Plants. Signed on 2000-06-20. Completion date: 2000-09-18.
$45,300 with Army for Air Conditioning Equipment. Signed on 2000-05-13. Completion date: 2000-07-31.
$40,200 with Army for Maintenance, Repair and Rebuilding of Equipment -- Furnace, Steam Plant, and Drying Equipment; and Nuclear Reactors. Signed on 2006-03-30. Completion date: 2006-06-19.
$37,950 with Army for Maintenance, Repair or Alteration of Real Property -- Heating and Cooling Plants. Signed on 2000-06-15. Completion date: 2000-09-13.
Top industries in this zip code by the number of employees in 2005:
Other Services (except Public Administration): Religious Organizations (5-9 employees: 2 establishments, 1-4 employees: 1 establishment)
Accommodation and Food Services: Limited-Service Restaurants (10-19: 1)
Other Services (except Public Administration): Pet Care (except Veterinary) Services (10-19: 1)
Accommodation and Food Services: Recreational and Vacation Camps (except Campgrounds) (5-9: 1)
Construction: Plumbing, Heating, and Air-Conditioning Contractors (5-9: 1)
People in group quarters in 2010:
14 people in emergency and transitional shelters (with sleeping facilities) for people experiencing homelessness
Fatal accident statistics in 2014:
Fatal accident count: 2
Vehicles involved in fatal accidents: 3
Fatal accidents caused by drunken drivers: 1
Fatalities: 2
Persons involved in fatal accidents: 3
Pedestrians involved in fatal accidents: 0
Fatal accident statistics in 2012:
Fatal accident count: 2
Vehicles involved in fatal accidents: 4
Fatal accidents caused by drunken drivers: 1
Fatalities: 3
Persons involved in fatal accidents: 9
Pedestrians involved in fatal accidents: 0
Home Mortgage Disclosure Act Aggregated Statistics For Year 2003 (Based on 4 partial tracts)
A) FHA, FSA/RHS & VA Home Purchase Loans
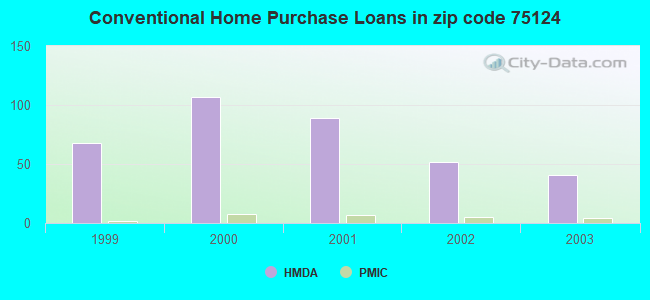
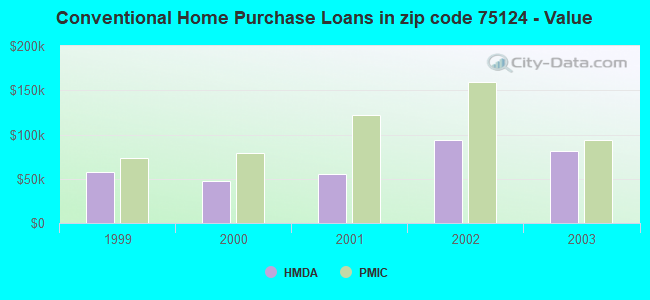
B) Conventional Home Purchase Loans
C) Refinancings
D) Home Improvement Loans
F) Non-occupant Loans on < 5 Family Dwellings (A B C & D)
Number
Average Value
Number
Average Value
Number
Average Value
Number
Average Value
Number
Average Value
LOANS ORIGINATED
10
$74,016
41
$81,663
92
$123,123
7
$36,534
22
$107,255
APPLICATIONS APPROVED, NOT ACCEPTED
0
$0
14
$55,384
20
$98,096
2
$165,360
4
$46,492
APPLICATIONS DENIED
0
$0
27
$56,811
57
$94,971
13
$28,732
2
$97,005
APPLICATIONS WITHDRAWN
0
$0
9
$111,760
41
$78,071
0
$0
2
$124,250
FILES CLOSED FOR INCOMPLETENESS
0
$0
2
$79,105
5
$68,594
0
$0
2
$46,300
Aggregated Statistics For Year 2002 (Based on 4 partial tracts)
A) FHA, FSA/RHS & VA Home Purchase Loans
B) Conventional Home Purchase Loans
C) Refinancings
D) Home Improvement Loans
F) Non-occupant Loans on < 5 Family Dwellings (A B C & D)
Number
Average Value
Number
Average Value
Number
Average Value
Number
Average Value
Number
Average Value
LOANS ORIGINATED
6
$95,672
52
$93,260
66
$96,129
28
$14,254
21
$99,660
APPLICATIONS APPROVED, NOT ACCEPTED
0
$0
18
$51,187
10
$53,512
2
$9,920
2
$75,885
APPLICATIONS DENIED
0
$0
51
$63,091
27
$56,505
16
$7,669
6
$46,507
APPLICATIONS WITHDRAWN
2
$76,065
5
$72,584
24
$72,015
4
$10,568
3
$45,657
FILES CLOSED FOR INCOMPLETENESS
0
$0
8
$85,431
7
$70,271
0
$0
0
$0
Aggregated Statistics For Year 2001 (Based on 4 partial tracts)
A) FHA, FSA/RHS & VA Home Purchase Loans
B) Conventional Home Purchase Loans
C) Refinancings
D) Home Improvement Loans
F) Non-occupant Loans on < 5 Family Dwellings (A B C & D)
Number
Average Value
Number
Average Value
Number
Average Value
Number
Average Value
Number
Average Value
LOANS ORIGINATED
9
$73,809
89
$55,318
47
$108,529
33
$18,343
24
$88,696
APPLICATIONS APPROVED, NOT ACCEPTED
2
$61,760
21
$57,570
15
$81,189
2
$42,340
1
$42,620
APPLICATIONS DENIED
0
$0
61
$36,985
28
$48,636
22
$16,343
8
$28,318
APPLICATIONS WITHDRAWN
0
$0
8
$72,884
23
$68,507
4
$4,978
2
$42,340
FILES CLOSED FOR INCOMPLETENESS
0
$0
2
$23,975
1
$123,050
0
$0
0
$0
Aggregated Statistics For Year 2000 (Based on 4 partial tracts)
A) FHA, FSA/RHS & VA Home Purchase Loans
B) Conventional Home Purchase Loans
C) Refinancings
D) Home Improvement Loans
F) Non-occupant Loans on < 5 Family Dwellings (A B C & D)
Number
Average Value
Number
Average Value
Number
Average Value
Number
Average Value
Number
Average Value
LOANS ORIGINATED
7
$59,160
107
$47,467
20
$95,726
43
$31,820
25
$50,898
APPLICATIONS APPROVED, NOT ACCEPTED
5
$64,160
29
$46,477
6
$75,098
5
$77,394
2
$27,170
APPLICATIONS DENIED
2
$39,685
75
$36,631
12
$55,764
16
$15,869
6
$30,393
APPLICATIONS WITHDRAWN
0
$0
3
$72,360
11
$55,397
0
$0
0
$0
FILES CLOSED FOR INCOMPLETENESS
0
$0
0
$0
7
$67,657
0
$0
0
$0
Aggregated Statistics For Year 1999 (Based on 2 partial tracts)
A) FHA, FSA/RHS & VA Home Purchase Loans
B) Conventional Home Purchase Loans
C) Refinancings
D) Home Improvement Loans
E) Loans on Dwellings For 5+ Families
F) Non-occupant Loans on < 5 Family Dwellings (A B C & D)
Detailed PMIC statistics for the following Tracts:9505.00
, 9511.00
2002 - 2018 National Fire Incident Reporting System (NFIRS) incidents
According to the data from the years 2002 - 2018 the average number of fires per year is 53. The highest number of reported fires - 123 took place in 2017, and the least - 5 in 2002. The data has a rising trend.
When looking into fire subcategories, the most reports belonged to: Outside Fires (67.0%), and Structure Fires (23.5%).
Fire incident types reported to NFIRS in Zip Code 75124
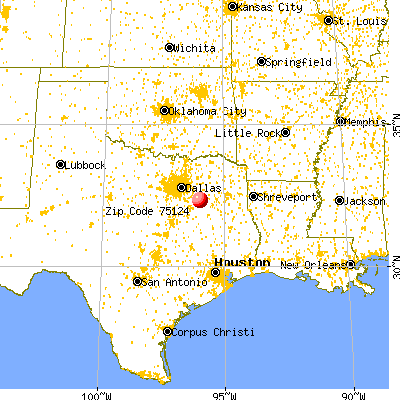


 Nearest zip codes: 75156, 75147, 75752, 75148, 75103, 75163.
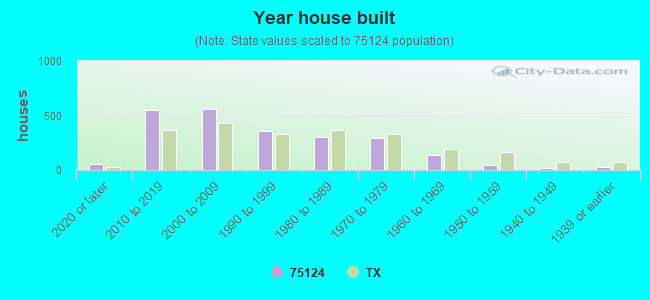


 : $229,419 in 6 contracts from 2000 to 2006
 According to the data from the years 2002 - 2018 the average number of fires per year is 53. The highest number of reported fires - 123 took place in 2017, and the least - 5 in 2002. The data has a rising trend.
 When looking into fire subcategories, the most reports belonged to: Outside Fires (67.0%), and Structure Fires (23.5%).