Estimated zip code population in 2022: 57,517 Zip code population in 2010: 48,877 Zip code population in 2000: 37,761
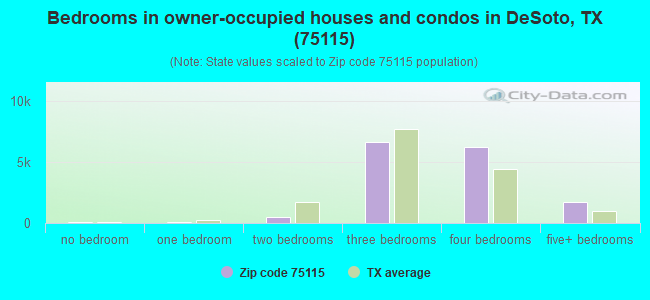
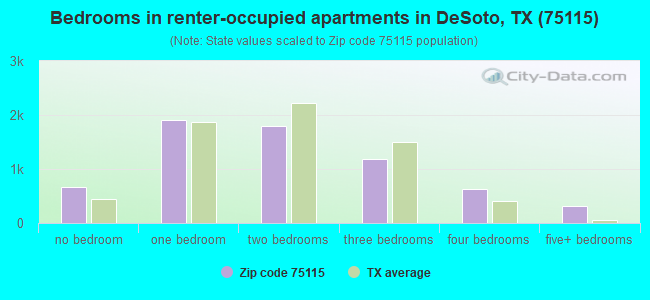
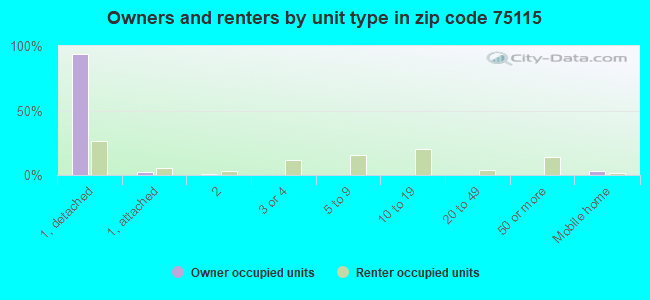
Houses and condos: 22,536 Renter-occupied apartments: 6,424
% of renters here:
30%
State:
38%
March 2022 cost of living index in zip code 75115: 94.9 (less than average, U.S. average is 100)
Land area: 21.9 sq. mi. Water area: 0.0 sq. mi.
Population density: 2,622 people per square mile
(average).
OSM Map
General Map
Google Map
MSN Map
OSM Map
General Map
Google Map
MSN Map
OSM Map
General Map
Google Map
MSN Map
OSM Map
General Map
Google Map
MSN Map
Please wait while loading the map...
Real estate property taxes paid for housing units in 2022:
This zip code:
1.7% ($5,053)
Texas:
1.5% ($4,050)
Median real estate property taxes paid for housing units with mortgages in 2022: $5,503 (1.7%) Median real estate property taxes paid for housing units with no mortgage in 2022: $4,022 (1.6%)
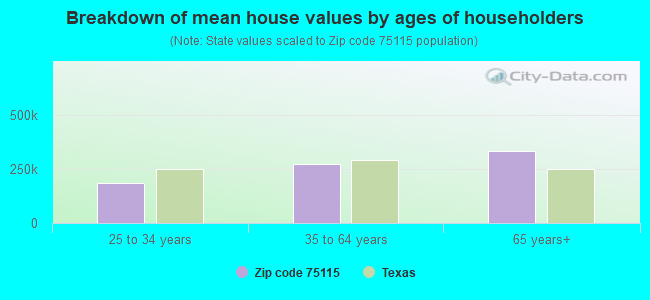
Estimated median house/condo value in 2022: $298,774
75115:
$298,774
Texas:
$275,400
According to our research of Texas and other state lists, there were 79 registered sex offenders living in 75115 zip code as of April 27, 2024. The ratio of all residents to sex offenders in zip code 75115 is 663 to 1. The ratio of registered sex offenders to all residents in this zip code is lower than the state average.
Median resident age:
This zip code:
41.7 years
Texas median age:
35.6 years
Average household size:
This zip code:
2.6 people
Texas:
2.6 people
Averages for the 2020 tax year for zip code 75115, filed in 2021:
Average Adjusted Gross Income (AGI) in 2020: $53,308 (Individual Income Tax Returns)
Here:
$53,308
State:
$77,054
Salary/wage: $48,831 (reported on 85.3% of returns)
Here:
$48,831
State:
$62,766
(% of AGI for various income ranges: 1334.3% for AGIs below $25k, 3897.6% for AGIs $25k-50k, 6977.4% for AGIs $50k-75k, 10074.9% for AGIs $75k-100k, 17761.3% for AGIs $100k-200k, 62129.4% for AGIs over 200k)
Taxable interest for individuals: $1,006 (reported on 13.6% of returns)
This zip code:
$1,006
Texas:
$2,665
(% of AGI for various income ranges: 3.6% for AGIs below $25k, 6.0% for AGIs $25k-50k, 11.6% for AGIs $50k-75k, 25.9% for AGIs $75k-100k, 57.7% for AGIs $100k-200k, 780.0% for AGIs over 200k)
Ordinary dividends: $3,502 (reported on 7.3% of returns)
Here:
$3,502
State:
$10,044
(% of AGI for various income ranges: 6.4% for AGIs below $25k, 6.9% for AGIs $25k-50k, 22.8% for AGIs $50k-75k, 48.7% for AGIs $75k-100k, 105.1% for AGIs $100k-200k, 1655.9% for AGIs over 200k)
Net capital gain/loss in AGI: +$9,818 (reported on 7.1% of returns)
Here:
+$9,818
State:
+$39,590
(% of AGI for various income ranges: 3.0% for AGIs below $25k, 7.2% for AGIs $25k-50k, 37.8% for AGIs $50k-75k, 76.9% for AGIs $75k-100k, 321.2% for AGIs $100k-200k, 6219.4% for AGIs over 200k)
Taxable individual retirement arrangement distribution: $18,510 (reported on 5.7% of returns)
75115:
$18,510
Texas:
$24,740
(% of AGI for various income ranges: 31.8% for AGIs below $25k, 56.0% for AGIs $25k-50k, 112.8% for AGIs $50k-75k, 246.6% for AGIs $75k-100k, 580.1% for AGIs $100k-200k, 3224.7% for AGIs over 200k)
Self-employed (Keogh) retirement plans: $30,167 (reported on 0.1% of returns)
75115:
$30,167
Texas:
$29,298
(% of AGI for various income ranges: 52.6% for AGIs $100k-200k)
Total itemized deductions: $30,331 (reported on 14.4% of returns)
Here:
$30,331
State:
$40,428
(% of AGI for various income ranges: 56.7% for AGIs below $25k, 281.2% for AGIs $25k-50k, 814.9% for AGIs $50k-75k, 1276.1% for AGIs $75k-100k, 2133.0% for AGIs $100k-200k, 8543.5% for AGIs over 200k)
Charity contributions: $12,192 (reported on 13.0% of returns)
Here:
$12,192
State:
$18,201
(% of AGI for various income ranges: 11.3% for AGIs below $25k, 76.5% for AGIs $25k-50k, 261.5% for AGIs $50k-75k, 421.2% for AGIs $75k-100k, 860.8% for AGIs $100k-200k, 4613.5% for AGIs over 200k)
Taxes paid: $6,905 (reported on 14.1% of returns)
75115:
$6,905
State:
$7,821
(% of AGI for various income ranges: 13.9% for AGIs below $25k, 59.3% for AGIs $25k-50k, 187.7% for AGIs $50k-75k, 313.7% for AGIs $75k-100k, 490.9% for AGIs $100k-200k, 1402.9% for AGIs over 200k)
Earned income credit: $2,484 (reported on 21.9% of returns)
Here:
$2,484
State:
$2,584
(% of AGI for various income ranges: 127.7% for AGIs below $25k, 82.5% for AGIs $25k-50k, 0.7% for AGIs $50k-75k)
Percentage of individuals using paid preparers for their 2020 taxes: 90.0%
Here:
90%
State:
92%
(% for various income ranges: 90.4% for AGIs below $25k, 91.4% for AGIs $25k-50k, 89.0% for AGIs $50k-75k, 89.0% for AGIs $75k-100k, 88.0% for AGIs $100k-200k, 87.0% for AGIs over 200k)
Averages for the 2012 tax year for zip code 75115, filed in 2013:
Average Adjusted Gross Income (AGI) in 2012: $49,409 (Individual Income Tax Returns)
Here:
$49,409
State:
$65,384
Salary/wage: $44,388 (reported on 87.6% of returns)
Here:
$44,388
State:
$52,524
(% of AGI for various income ranges: 86.1% for AGIs below $25k, 88.3% for AGIs $25k-50k, 83.8% for AGIs $50k-75k, 78.5% for AGIs $75k-100k, 78.7% for AGIs $100k-200k, 48.4% for AGIs over 200k)
Taxable interest for individuals: $1,276 (reported on 17.7% of returns)
This zip code:
$1,276
Texas:
$2,372
(% of AGI for various income ranges: 0.5% for AGIs below $25k, 0.2% for AGIs $25k-50k, 0.3% for AGIs $50k-75k, 0.3% for AGIs $75k-100k, 0.4% for AGIs $100k-200k, 1.4% for AGIs over 200k)
Ordinary dividends: $3,867 (reported on 8.8% of returns)
Here:
$3,867
State:
$9,721
(% of AGI for various income ranges: 1.0% for AGIs below $25k, 0.5% for AGIs $25k-50k, 0.4% for AGIs $50k-75k, 0.4% for AGIs $75k-100k, 0.6% for AGIs $100k-200k, 1.8% for AGIs over 200k)
Net capital gain/loss in AGI: +$8,599 (reported on 6.6% of returns)
Here:
+$8,599
State:
+$35,319
(% of AGI for various income ranges: 0.1% for AGIs $50k-75k, 0.3% for AGIs $75k-100k, 0.5% for AGIs $100k-200k, 8.0% for AGIs over 200k)
Profit/loss from business: +$2,414 (reported on 22.3% of returns)
Here:
+$2,414
State:
+$13,732
(% of AGI for various income ranges: 0.4% for AGIs below $25k, 0.1% for AGIs $50k-75k, 1.1% for AGIs $75k-100k, 2.2% for AGIs $100k-200k, 6.0% for AGIs over 200k)
Taxable individual retirement arrangement distribution: $15,325 (reported on 7.3% of returns)
75115:
$15,325
Texas:
$19,511
(% of AGI for various income ranges: 1.8% for AGIs below $25k, 1.5% for AGIs $25k-50k, 2.2% for AGIs $50k-75k, 3.1% for AGIs $75k-100k, 2.8% for AGIs $100k-200k, 1.8% for AGIs over 200k)
Self-employment retirement plans: $20,400 (reported on 0.2% of returns)
75115:
$20,400
Texas:
$23,938
Total itemized deductions: $21,573 (26% of AGI, reported on 36.3% of returns)
Here:
$21,573
State:
$24,724
Here:
26.1% of AGI
State:
15.9% of AGI
(% of AGI for various income ranges: 10.1% for AGIs below $25k, 15.9% for AGIs $25k-50k, 18.9% for AGIs $50k-75k, 17.8% for AGIs $75k-100k, 16.6% for AGIs $100k-200k, 12.0% for AGIs over 200k)
Charity contributions: $6,822 (reported on 31.9% of returns)
Here:
$6,822
State:
$6,808
(% of AGI for various income ranges: 1.7% for AGIs below $25k, 3.6% for AGIs $25k-50k, 4.8% for AGIs $50k-75k, 5.2% for AGIs $75k-100k, 5.6% for AGIs $100k-200k, 4.1% for AGIs over 200k)
Taxes paid: $4,828 (reported on 35.5% of returns)
75115:
$4,828
State:
$6,921
(% of AGI for various income ranges: 2.1% for AGIs below $25k, 3.1% for AGIs $25k-50k, 4.3% for AGIs $50k-75k, 4.0% for AGIs $75k-100k, 3.8% for AGIs $100k-200k, 2.6% for AGIs over 200k)
Earned income credit: $2,468 (reported on 25.5% of returns)
Here:
$2,468
State:
$2,570
(% of AGI for various income ranges: 10.1% for AGIs below $25k, 1.3% for AGIs $25k-50k)
Percentage of individuals using paid preparers for their 2012 taxes: 51.8%
Here:
52%
State:
51%
(% for various income ranges: 51.9% for AGIs below $25k, 50.8% for AGIs $25k-50k, 51.4% for AGIs $50k-75k, 52.2% for AGIs $75k-100k, 52.6% for AGIs $100k-200k, 67.7% for AGIs over 200k)
Averages for the 2004 tax year for zip code 75115, filed in 2005:
Average Adjusted Gross Income (AGI) in 2004: $49,696 (Individual Income Tax Returns)
Here:
$49,696
State:
$47,881
Salary/wage: $44,870 (reported on 88.7% of returns)
Here:
$44,870
State:
$41,947
(% of AGI for various income ranges: 124.0% for AGIs below $10k, 85.3% for AGIs $10k-25k, 89.5% for AGIs $25k-50k, 86.4% for AGIs $50k-75k, 86.2% for AGIs $75k-100k, 66.6% for AGIs over 100k)
Taxable interest for individuals: $1,622 (reported on 30.1% of returns)
This zip code:
$1,622
Texas:
$2,255
(% of AGI for various income ranges: 3.5% for AGIs below $10k, 1.2% for AGIs $10k-25k, 0.7% for AGIs $25k-50k, 0.7% for AGIs $50k-75k, 0.7% for AGIs $75k-100k, 1.3% for AGIs over 100k)
Taxable dividends: $2,237 (reported on 14.8% of returns)
Here:
$2,237
State:
$4,261
(% of AGI for various income ranges: 2.4% for AGIs below $10k, 0.7% for AGIs $10k-25k, 0.3% for AGIs $25k-50k, 0.4% for AGIs $50k-75k, 0.5% for AGIs $75k-100k, 1.0% for AGIs over 100k)
Net capital gain/loss: +$10,871 (reported on 11.7% of returns)
Here:
+$10,871
State:
+$16,110
(% of AGI for various income ranges: -1.0% for AGIs below $10k, 0.2% for AGIs $10k-25k, 0.3% for AGIs $25k-50k, 0.4% for AGIs $50k-75k, 0.6% for AGIs $75k-100k, 6.3% for AGIs over 100k)
Profit/loss from business: +$5,958 (reported on 19.2% of returns)
Here:
+$5,958
State:
+$11,013
(% of AGI for various income ranges: 12.4% for AGIs below $10k, 1.3% for AGIs $10k-25k, 0.5% for AGIs $25k-50k, 1.0% for AGIs $50k-75k, 1.3% for AGIs $75k-100k, 4.3% for AGIs over 100k)
IRA payment deduction: $2,821 (reported on 1.6% of returns)
75115:
$2,821
Texas:
$3,120
(% of AGI for various income ranges: 0.1% for AGIs $10k-25k, 0.1% for AGIs $25k-50k, 0.1% for AGIs $50k-75k, 0.1% for AGIs $75k-100k, 0.1% for AGIs over 100k)
Self-employed pension: $16,390 (reported on 0.6% of returns)
Here:
$16,390
Texas:
$16,401
(% of AGI for various income ranges: 0.0% for AGIs $25k-50k, 0.0% for AGIs $50k-75k, 0.1% for AGIs $75k-100k, 0.4% for AGIs over 100k)
Total itemized deductions: $19,745 (25% of AGI, reported on 43.4% of returns)
Here:
$19,745
State:
$19,631
Here:
25.0% of AGI
State:
18.9% of AGI
(% of AGI for various income ranges: 18.4% for AGIs below $10k, 12.7% for AGIs $10k-25k, 19.5% for AGIs $25k-50k, 21.6% for AGIs $50k-75k, 20.1% for AGIs $75k-100k, 13.4% for AGIs over 100k)
Charity contributions deductions: $5,565 (7% of AGI, reported on 39.5% of returns)
Here:
$5,565
State:
$4,753
Here:
6.8% of AGI
State:
4.2% of AGI
(% of AGI for various income ranges: 1.6% for AGIs below $10k, 2.2% for AGIs $10k-25k, 4.2% for AGIs $25k-50k, 5.1% for AGIs $50k-75k, 5.4% for AGIs $75k-100k, 4.4% for AGIs over 100k)
Total tax: $7,679 (reported on 72.6% of returns)
75115:
$7,679
State:
$9,058
(% of AGI for various income ranges: 3.6% for AGIs below $10k, 3.5% for AGIs $10k-25k, 5.7% for AGIs $25k-50k, 8.4% for AGIs $50k-75k, 10.0% for AGIs $75k-100k, 18.0% for AGIs over 100k)
Earned income credit: $1,881 (reported on 19.1% of returns)
Here:
$1,881
State:
$2,024
Percentage of individuals using paid preparers for their 2004 taxes: 56.2%
Here:
56%
State:
57%
(% for various income ranges: 47.9% for AGIs below $10k, 62.5% for AGIs $10k-25k, 56.9% for AGIs $25k-50k, 55.2% for AGIs $50k-75k, 53.6% for AGIs $75k-100k, 57.8% for AGIs over 100k)
Household received Food Stamps/SNAP in the past 12 months: 2,648 Household did not receive Food Stamps/SNAP in the past 12 months: 18,945
Women who had a birth in the past 12 months: 560 (434 now married, 128 unmarried) Women who did not have a birth in the past 12 months: 13,745 (4,772 now married, 9,012 unmarried)
Housing units in zip code 75115 with a mortgage: 10,233 (410 second mortgage, 237 both second mortgage and home equity loan) Houses without a mortgage: 65
Median monthly owner costs for units with a mortgage: $1,978 Median monthly owner costs for units without a mortgage: $835
Residents with income below the poverty level in 2022:
This zip code:
8.2%
Whole state:
14.0%
Residents with income below 50% of the poverty level in 2022:
This zip code:
3.9%
Whole state:
7.4%
Median number of rooms in houses and condos:
Here:
7.4
State:
6.3
Median number of rooms in apartments:
Here:
4.0
State:
4.0
Notable locations in this zip code not listed on our city pages
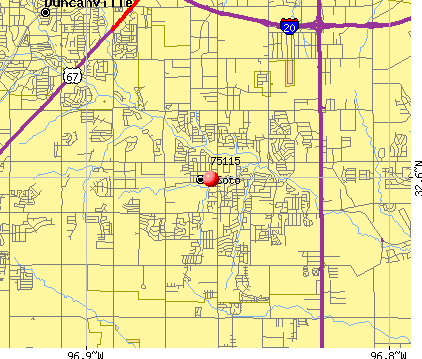
Notable locations in zip code 75115: DeSoto Fire Marshal's Office (A), Desoto Fire Rescue Station 261 (B), Desoto Fire Rescue Station 263 (C), Desoto Fire Rescue Station 262 (D), Advicare Ambulance Service (E). Display/hide their locations on the map
Churches in zip code 75115 include: De Soto Presbyterian Church (A), De Soto Seventh Day Adventist Church (B), Christ Community Church (C), Grace Covenant Church (D), De Soto Community Church (E), Southwest Baptist Church (F), Solomon Temple Missionary Baptist Church (G), Shekinah Tabernacle Baptist Church (H), Westchester Fellowship Baptist Church (I). Display/hide their locations on the map
Parks in zip code 75115 include: Mosley Park (1), Zeigler Park (2), Eagle Stadium (3), Grimes Park (4), Elerson Park (5). Display/hide their locations on the map
Tourist attraction (not listed on the city page) : Amf Bowling Centers - Amf Desoto Lanes (Amusement & Theme Parks; 121 Northgate Drive).
6,365 married couples with children.
3,356 single-parent households (586 men, 2,770 women).
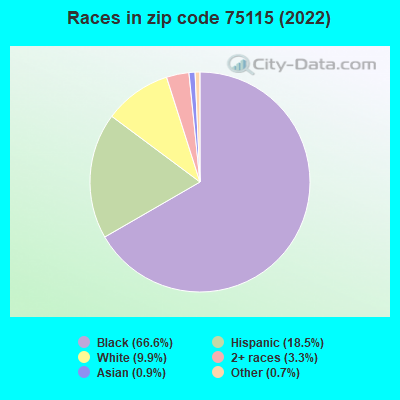
85.6% of residents of 75115 zip code speak English at home.
11.6% of residents speak Spanish at home (61% very well, 23% well, 14% not well, 1% not at all).
0.6% of residents speak other Indo-European language at home (92% very well, 5% well, 3% not well).
0.9% of residents speak Asian or Pacific Island language at home (46% very well, 16% well, 31% not well, 7% not at all).
1.0% of residents speak other language at home (99% very well, 1% well).
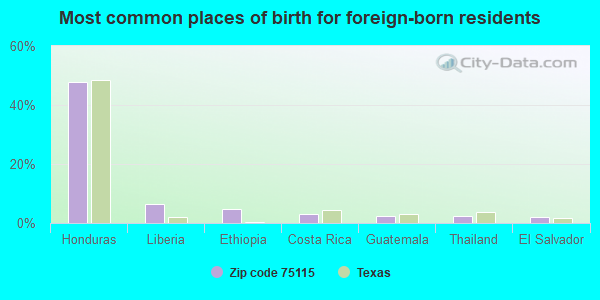
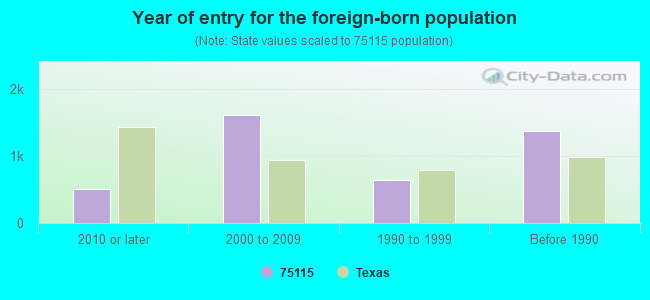
Foreign born population: 4,185 (7.3%) (50.9% of them are naturalized citizens)
Facilities with environmental interests located in this zip code:
AMBER TERRACE INT (224 AMBER LN in DESOTO, TX)
(National Center for Education Statistics) - STATE ID-057906104 Organizations: DESOTO ISD (SCHOOL DISTRICT)
ACUITY SPECIALTY PRODUCTS ZEP MANUFACTURING (525 E CENTRE PARK BLVD in DESOTO, TX)
HAZARDOUS WASTE BIENNIAL REPORTER (Resource Conservation and Recovery Act (tracking hazardous waste)) Small Quantity Generators, between 100 kg and 1000 kg of hazardous waste/month (Resource Conservation and Recovery Act (tracking hazardous waste)) TRI REPORTER (Tracking of toxic chemicals releasing facilities) Business SIC classification: SOAP AND OTHER DETERGENTS, EXCEPT SPECIALTY CLEANERS; SURFACE ACTIVE AGENTS, FINISHING AGENTS, SULFONATED OILS, AND ASSISTANTS; PERFUMES, COSMETICS, AND OTHER TOILET PREPARATIONS Business NAICS classification: SOAP AND OTHER DETERGENT MANUFACTURING. Organizations: ACUITY SPECIALTY PRODUCTS GROUP INC (CONTACT/OPERATOR)
Alternative names: ZEP MANUFACTURING COMPANY
$1.59 CLEANERS (1022 EAST PLEASANT RUN ROAD in DE SOTO, TX)
AIR MINOR (AIRS/AFS) Business SIC classification: DRYCLEANING PLANTS, EXCEPT RUG CLEANING
A CLEANERS (1231 EAST PLEASANT RUN ROAD in DE SOTO, TX)
AIR MINOR (AIRS/AFS) Business SIC classification: DRYCLEANING PLANTS, EXCEPT RUG CLEANING
AMERICAN PAVING (1001 N. BECKLEY, SUITE 108308 in DESOTO, TX)
AIR MINOR (AIRS/AFS) Business SIC classification: CONCRETE WORK
AUTO SHADE (1616 OSPREY in DE SOTO, TX)
Small Quantity Generators, between 100 kg and 1000 kg of hazardous waste/month (Resource Conservation and Recovery Act (tracking hazardous waste)) - notification Business NAICS classification: AUTOMOTIVE BODY, PAINT, AND INTERIOR REPAIR AND MAINTENANCE. Organizations: BRADYLONNIE L (CONTACT/OPERATOR)
Housing units lacking complete plumbing facilities: 0.6% Housing units lacking complete kitchen facilities: 1.4%
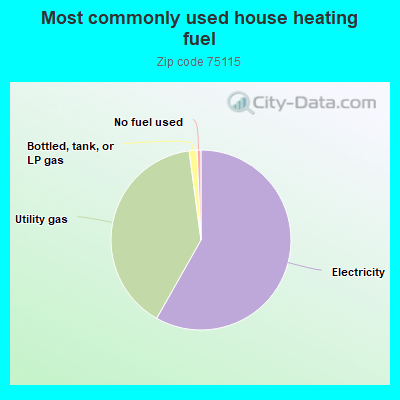
58.2%Electricity
39.7%Utility gas
1.4%Bottled, tank, or LP gas
0.7%No fuel used
Population in 1990: 33,750. Population change in the 1990s: +4,011 (+11.9%).
Place of birth for U.S.-born residents:
This state: 36,323
Northeast: 1,387
Midwest: 2,797
South: 9,982
West: 2,516
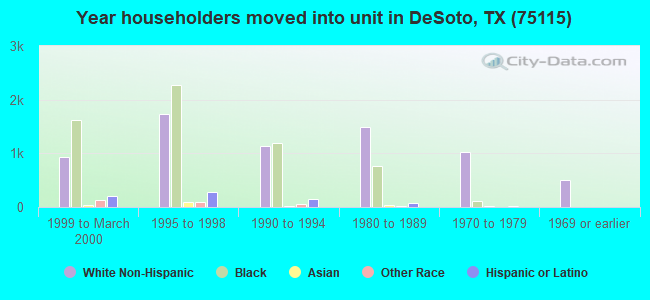
53% of the 75115 zip code residents lived in the same house 5 years ago. Out of people who lived in different houses, 68% lived in this county. Out of people who lived in different counties, 50% lived in Texas.
91% of the 75115 zip code residents lived in the same house 1 year ago. Out of people who lived in different houses, 67% moved from this county. Out of people who lived in different houses, 20% moved from different county within same state. Out of people who lived in different houses, 12% moved from different state.
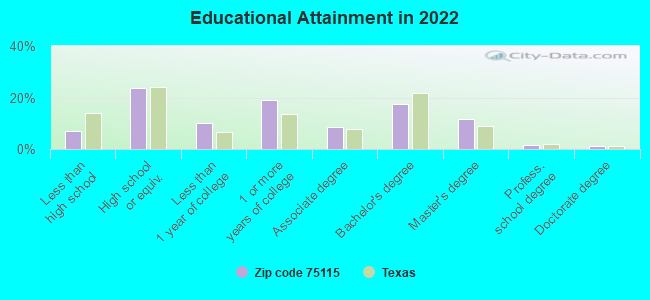
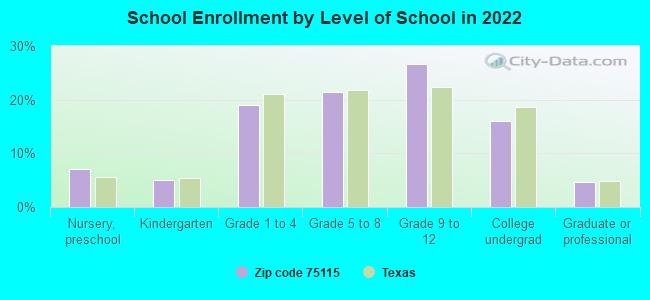
Private vs. public school enrollment:
Students in private schools in grades 1 to 8 (elementary and middle school): 715
Here:
12.2%
Texas:
8.8%
Students in private schools in grades 9 to 12 (high school): 451
Here:
11.7%
Texas:
8.0%
Students in private undergraduate colleges: 198
Here:
8.6%
Texas:
16.2%
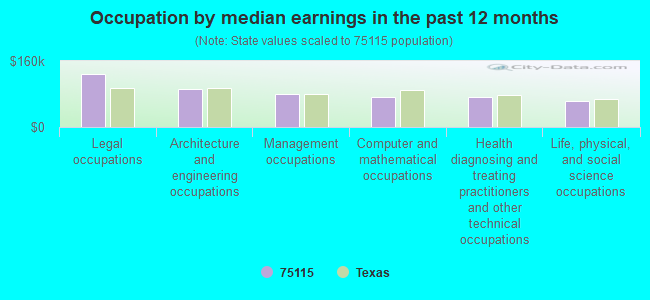
Occupation by median earnings in the past 12 months ($)
127,334Legal occupations
93,202Architecture and engineering occupations
79,379Management occupations
73,525Computer and mathematical occupations
72,440Health diagnosing and treating practitioners and other technical occupations
63,588Life, physical, and social science occupations
Companies with federal contracts located in this zip code (DESOTO, TX):
THE WARRIOR GROUP INC (1624 FALCON DR, STE 100) : $49,671,223 in 329 contractsfrom 2000 to 2006
Contracts for Construction of Structures and Facilities -- Other Non-Building Facilities, Lease or Rental of Facilities -- Other Residential Buildings, Prefabricated and Portable Buildings, Construction of Structures and Facilities -- Office Buildings, and moreby Army, Navy, Department of Veterans Affairs, Employment and Training Administration, and others Signed by year:2000: $4,213,000; 2001: $3,332,962; 2002: $7,586,736; 2003: $6,845,090; 2004: $8,787,794; 2005: $16,269,633; 2006: $2,636,008.
Biggest contracts:
$6,719,390 with Army for Construction of Structures and Facilities -- Other Non-Building Facilities. Signed on 2005-03-29. Completion date: 2005-06-09.
$4,995,000 with Navy for Lease or Rental of Facilities -- Other Residential Buildings. Taking place in MS. Signed on 2005-10-12. Completion date: 2006-09-29.
$3,750,000 with Army for Prefabricated and Portable Buildings. Signed on 2000-09-30. Completion date: 2001-04-30.
$2,533,338 with Army for Construction of Structures and Facilities -- Office Buildings. Taking place in CO. Signed on 2002-09-18. Completion date: 2003-01-31.
UNITED PROCUREMENT LP (1425 YARDLEY PL; small business) : $12,200,347 in 652 contractsfrom 1999 to 2006
Contracts for Cabinets, Lockers, Bins, and Shelving, Miscellaneous Furniture and Fixtures, Radio Navigation Equipment, Except Airborne, Tractors, Wheeled, and moreby Defense Commissary Agency, Army, Department of Defense, Defense Logistics Agency, and others Signed by year:2000: $895,930; 2001: $896,174; 2002: $744,634; 2003: $2,029,604; 2004: $2,603,593; 2005: $3,693,070; 2006: $1,275,685.
Biggest contracts:
$429,368 with Defense Commissary Agency for Cabinets, Lockers, Bins, and Shelving. Signed on 2005-04-28. Completion date: 2005-08-28.
$253,345, same as above.Signed on 2005-08-08. Completion date: 2005-10-21.
$207,389 with Defense Commissary Agency for Miscellaneous Furniture and Fixtures. Signed on 2005-12-01. Completion date: 2006-02-28.
$197,501 with Army for Radio Navigation Equipment, Except Airborne. Signed on 2004-01-07. Completion date: 2004-02-23.
TEXAS AIR MANUFACTURING, INC (102 EZELL DRIVE; small business) : $3,015,935 in 89 contractsfrom 2002 to 2006
Contracts for Airframe Structural Components, Parachutes; Aerial Pick Up, Delivery, Recovery Systems; and Cargo Tie Down Equipment by Air Force, Defense Logistics Agency, Army Signed by year:2000: $0; 2001: $0; 2002: $81,830; 2003: $616,090; 2004: $504,891; 2005: $1,121,087; 2006: $692,037.
Biggest contracts:
$349,860 with Air Force for Airframe Structural Components. Signed on 2005-08-30. Completion date: 2006-01-31.
$257,040, same as above.Signed on 2006-03-07. Completion date: 2006-08-31.
$148,720, same as above.Signed on 2003-09-23. Completion date: 2004-06-16.
$127,155, same as above.Signed on 2003-11-17. Completion date: 2004-06-30.
AIR POWER TOOL & HOIST INC (600 EAST CENTRE PARK BLVD) : $220,783 in 9 contractsfrom 2002 to 2005
Contracts for Mining, Rock Drilling, Earth Boring and Related Equipment, Winches, Hoists, Cranes, and Derricks, Hand Tools, Power Driven by Army Signed by year:2000: $0; 2001: $0; 2002: $34,198; 2003: $0; 2004: $48,211; 2005: $138,374; 2006: $0.
Biggest contracts:
$58,400 with Army for Mining, Rock Drilling, Earth Boring and Related Equipment. Signed on 2005-04-14. Completion date: 2005-05-09.
$57,100, same as above.Signed on 2005-02-07. Completion date: 2005-05-09.
$34,198 with Army for Winches, Hoists, Cranes, and Derricks. Signed on 2002-08-14. Completion date: 2002-09-18.
$24,750, same as above.Signed on 2004-09-03. Completion date: 2004-09-23.
MENSION DEVELOPMENT CO INC (1515 N BECKLEY AVE) : $48,144 in 4 contractsin 2003
$34,204 with Army for Lodging - Hotel/Motel. Signed on 2003-04-01. Completion date: 2003-03-25.
$13,736, same as above.Signed on 2003-12-10. Completion date: 2003-12-11.
$3,332, same as above.Signed on 2003-11-15. Completion date: 2003-11-21.
-$3,128, same as above.Signed on 2003-12-01. Completion date: 2003-12-02.
JP VALVE & TUBING INC (632 E CENTRE PARK BLVD; small business) : $13,451 in 4 contractsfrom 2005 to 2006
$4,416 with Defense Logistics Agency for Hose, Pipe, Tube, Lubrication, and Railing Fittings. Signed on 2005-12-23. Completion date: 2006-02-01.
$3,229, same as above.Signed on 2005-12-05. Completion date: 2006-01-04.
$3,185, same as above.Signed on 2006-04-13. Completion date: 2006-05-14.
$2,621, same as above.Signed on 2006-01-19. Completion date: 2006-03-24.
INGERSOLL-RAND COMPANY (600 E CENTRE PARK BLVD)
$6,340 with Air Force for Hand Tools, Power Driven. Signed on 2006-01-09. Completion date: 2006-01-23.
GRATE 1 INSULATION SERVICE CO (604 MIRKES PKWY; small business)
$5,900 with Army for Air Conditioning Equipment. Signed on 2004-05-04. Completion date: 2004-05-09.
Top industries in this zip code by the number of employees in 2005:
Health Care and Social Assistance: Home Health Care Services (100-249 employees: 2 establishments, 50-99 employees: 2 establishments, 20-49 employees: 8 establishments, 10-19 employees: 4 establishments, 5-9 employees: 2 establishments, 1-4 employees: 3 establishments)
2002 - 2018 National Fire Incident Reporting System (NFIRS) incidents
Based on the data from the years 2002 - 2018 the average number of fires per year is 197. The highest number of reported fire incidents - 251 took place in 2005, and the least - 146 in 2017. The data has an increasing trend.
When looking into fire subcategories, the most reports belonged to: Structure Fires (46.8%), and Outside Fires (31.9%).
Fire incident types reported to NFIRS in Zip Code 75115

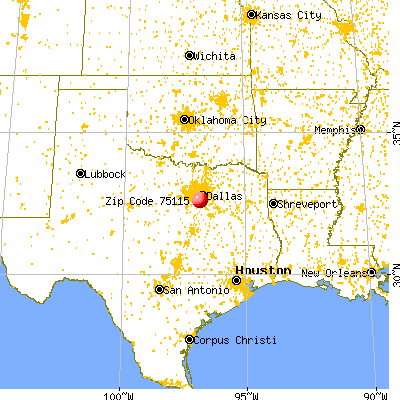


 Nearest zip codes: 75232, 75237, 75137, 75116, 75134, 75154.


 Based on the data from the years 2002 - 2018 the average number of fires per year is 197. The highest number of reported fire incidents - 251 took place in 2005, and the least - 146 in 2017. The data has an increasing trend.
 When looking into fire subcategories, the most reports belonged to: Structure Fires (46.8%), and Outside Fires (31.9%).