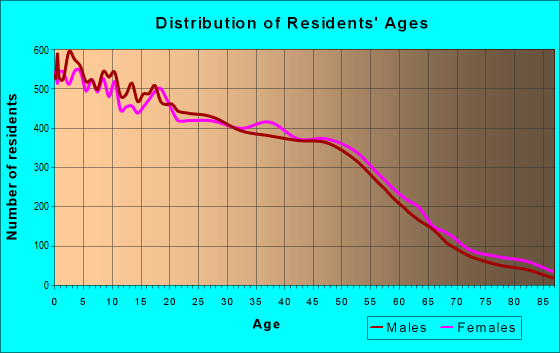
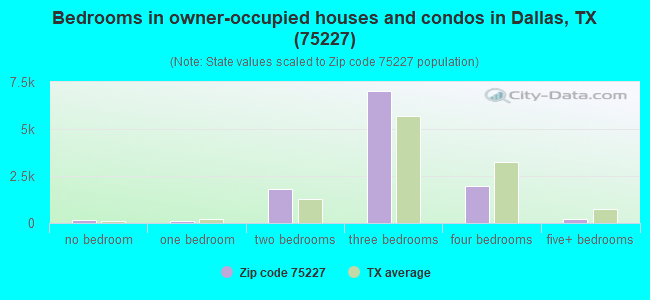
Estimated zip code population in 2022: 59,882 Zip code population in 2010: 55,029 Zip code population in 2000: 49,066
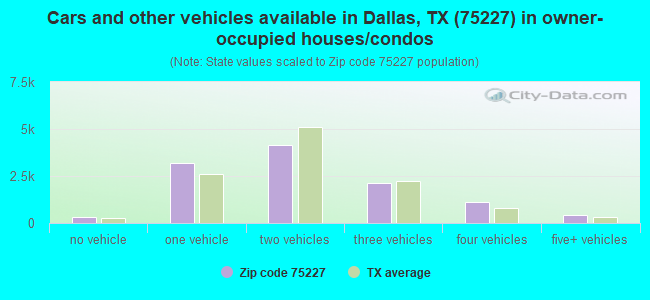
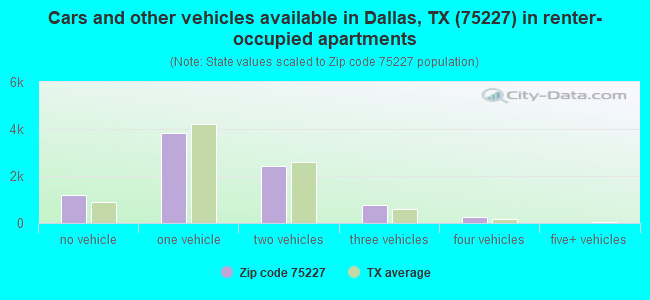
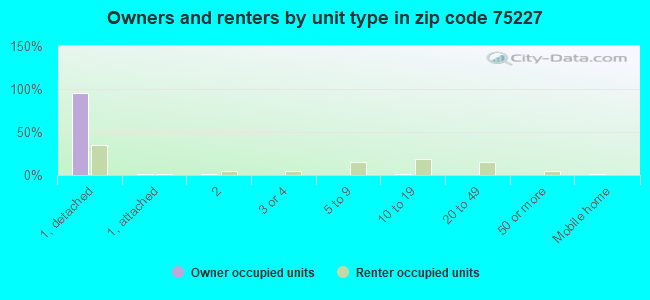
Houses and condos: 20,503 Renter-occupied apartments: 8,503
% of renters here:
43%
State:
38%
March 2022 cost of living index in zip code 75227: 94.1 (less than average, U.S. average is 100)
Land area: 11.4 sq. mi. Water area: 0.0 sq. mi.
Population density: 5,254 people per square mile
(average).
OSM Map
General Map
Google Map
MSN Map
OSM Map
General Map
Google Map
MSN Map
OSM Map
General Map
Google Map
MSN Map
OSM Map
General Map
Google Map
MSN Map
Please wait while loading the map...
Real estate property taxes paid for housing units in 2022:
This zip code:
1.1% ($2,244)
Texas:
1.5% ($4,050)
Median real estate property taxes paid for housing units with mortgages in 2022: $2,827 (1.3%) Median real estate property taxes paid for housing units with no mortgage in 2022: $1,853 (1.0%)
Averages for the 2020 tax year for zip code 75227, filed in 2021:
Average Adjusted Gross Income (AGI) in 2020: $35,723 (Individual Income Tax Returns)
Here:
$35,723
State:
$77,054
Salary/wage: $34,808 (reported on 83.8% of returns)
Here:
$34,808
State:
$62,766
(% of AGI for various income ranges: 1278.2% for AGIs below $25k, 3864.4% for AGIs $25k-50k, 6946.4% for AGIs $50k-75k, 10105.2% for AGIs $75k-100k, 16650.9% for AGIs $100k-200k, 55762.5% for AGIs over 200k)
Taxable interest for individuals: $620 (reported on 7.0% of returns)
This zip code:
$620
Texas:
$2,665
(% of AGI for various income ranges: 2.0% for AGIs below $25k, 2.8% for AGIs $25k-50k, 5.9% for AGIs $50k-75k, 21.5% for AGIs $75k-100k, 35.5% for AGIs $100k-200k, 555.0% for AGIs over 200k)
Ordinary dividends: $1,858 (reported on 2.9% of returns)
Here:
$1,858
State:
$10,044
(% of AGI for various income ranges: 2.2% for AGIs below $25k, 3.4% for AGIs $25k-50k, 7.1% for AGIs $50k-75k, 29.1% for AGIs $75k-100k, 67.3% for AGIs $100k-200k, 382.5% for AGIs over 200k)
Net capital gain/loss in AGI: +$6,474 (reported on 3.0% of returns)
Here:
+$6,474
State:
+$39,590
(% of AGI for various income ranges: 1.2% for AGIs below $25k, 7.8% for AGIs $25k-50k, 21.1% for AGIs $50k-75k, 84.5% for AGIs $75k-100k, 300.2% for AGIs $100k-200k, 3660.0% for AGIs over 200k)
Profit/loss from business: +$7,114 (reported on 25.4% of returns)
Here:
+$7,114
State:
+$10,888
(% of AGI for various income ranges: 250.6% for AGIs below $25k, 167.8% for AGIs $25k-50k, 172.6% for AGIs $50k-75k, 326.3% for AGIs $75k-100k, 578.4% for AGIs $100k-200k, 5955.0% for AGIs over 200k)
Taxable individual retirement arrangement distribution: $13,864 (reported on 2.3% of returns)
75227:
$13,864
Texas:
$24,740
(% of AGI for various income ranges: 11.2% for AGIs below $25k, 18.9% for AGIs $25k-50k, 62.2% for AGIs $50k-75k, 181.1% for AGIs $75k-100k, 493.4% for AGIs $100k-200k)
Total itemized deductions: $27,084 (reported on 3.4% of returns)
Here:
$27,084
State:
$40,428
(% of AGI for various income ranges: 18.8% for AGIs below $25k, 79.5% for AGIs $25k-50k, 264.2% for AGIs $50k-75k, 435.5% for AGIs $75k-100k, 836.4% for AGIs $100k-200k, 4452.5% for AGIs over 200k)
Charity contributions: $10,189 (reported on 2.7% of returns)
Here:
$10,189
State:
$18,201
(% of AGI for various income ranges: 3.1% for AGIs below $25k, 20.7% for AGIs $25k-50k, 67.6% for AGIs $50k-75k, 145.6% for AGIs $75k-100k, 280.7% for AGIs $100k-200k, 2582.5% for AGIs over 200k)
Taxes paid: $5,676 (reported on 3.3% of returns)
75227:
$5,676
State:
$7,821
(% of AGI for various income ranges: 3.8% for AGIs below $25k, 16.0% for AGIs $25k-50k, 55.8% for AGIs $50k-75k, 88.9% for AGIs $75k-100k, 178.9% for AGIs $100k-200k, 760.0% for AGIs over 200k)
Earned income credit: $2,743 (reported on 30.4% of returns)
Here:
$2,743
State:
$2,584
(% of AGI for various income ranges: 167.7% for AGIs below $25k, 94.0% for AGIs $25k-50k, 1.5% for AGIs $50k-75k)
Percentage of individuals using paid preparers for their 2020 taxes: 87.0%
Here:
87%
State:
92%
(% for various income ranges: 85.1% for AGIs below $25k, 88.8% for AGIs $25k-50k, 88.2% for AGIs $50k-75k, 88.9% for AGIs $75k-100k, 89.2% for AGIs $100k-200k, 83.3% for AGIs over 200k)
Averages for the 2012 tax year for zip code 75227, filed in 2013:
Average Adjusted Gross Income (AGI) in 2012: $29,649 (Individual Income Tax Returns)
Here:
$29,649
State:
$65,384
Salary/wage: $28,676 (reported on 86.4% of returns)
Here:
$28,676
State:
$52,524
(% of AGI for various income ranges: 79.8% for AGIs below $25k, 90.2% for AGIs $25k-50k, 85.4% for AGIs $50k-75k, 82.3% for AGIs $75k-100k, 73.5% for AGIs $100k-200k, 49.0% for AGIs over 200k)
Taxable interest for individuals: $694 (reported on 8.5% of returns)
This zip code:
$694
Texas:
$2,372
(% of AGI for various income ranges: 0.2% for AGIs below $25k, 0.1% for AGIs $25k-50k, 0.2% for AGIs $50k-75k, 0.3% for AGIs $75k-100k, 0.3% for AGIs $100k-200k, 0.5% for AGIs over 200k)
Ordinary dividends: $3,476 (reported on 3.4% of returns)
Here:
$3,476
State:
$9,721
(% of AGI for various income ranges: 0.6% for AGIs below $25k, 0.3% for AGIs $25k-50k, 0.4% for AGIs $50k-75k, 0.3% for AGIs $75k-100k, 0.3% for AGIs $100k-200k)
Net capital gain/loss in AGI: +$4,894 (reported on 2.3% of returns)
Here:
+$4,894
State:
+$35,319
(% of AGI for various income ranges: 0.2% for AGIs $50k-75k, 0.9% for AGIs $100k-200k, 10.1% for AGIs over 200k)
Profit/loss from business: +$7,665 (reported on 21.3% of returns)
Here:
+$7,665
State:
+$13,732
(% of AGI for various income ranges: 14.3% for AGIs below $25k, 2.4% for AGIs $25k-50k, 1.2% for AGIs $50k-75k, 3.1% for AGIs $75k-100k, 5.7% for AGIs $100k-200k)
Taxable individual retirement arrangement distribution: $12,086 (reported on 3.2% of returns)
75227:
$12,086
Texas:
$19,511
(% of AGI for various income ranges: 0.7% for AGIs below $25k, 0.8% for AGIs $25k-50k, 1.6% for AGIs $50k-75k, 2.2% for AGIs $75k-100k, 4.0% for AGIs $100k-200k)
Total itemized deductions: $16,999 (30% of AGI, reported on 12.5% of returns)
Here:
$16,999
State:
$24,724
Here:
29.7% of AGI
State:
15.9% of AGI
(% of AGI for various income ranges: 3.4% for AGIs below $25k, 7.1% for AGIs $25k-50k, 9.4% for AGIs $50k-75k, 9.8% for AGIs $75k-100k, 9.9% for AGIs $100k-200k, 9.8% for AGIs over 200k)
Charity contributions: $4,726 (reported on 9.6% of returns)
Here:
$4,726
State:
$6,808
(% of AGI for various income ranges: 0.4% for AGIs below $25k, 1.3% for AGIs $25k-50k, 1.8% for AGIs $50k-75k, 2.6% for AGIs $75k-100k, 3.1% for AGIs $100k-200k, 4.6% for AGIs over 200k)
Taxes paid: $3,190 (reported on 12.0% of returns)
75227:
$3,190
State:
$6,921
(% of AGI for various income ranges: 0.6% for AGIs below $25k, 1.1% for AGIs $25k-50k, 1.7% for AGIs $50k-75k, 2.1% for AGIs $75k-100k, 2.1% for AGIs $100k-200k, 2.5% for AGIs over 200k)
Earned income credit: $2,869 (reported on 37.6% of returns)
Here:
$2,869
State:
$2,570
(% of AGI for various income ranges: 11.7% for AGIs below $25k, 1.9% for AGIs $25k-50k)
Percentage of individuals using paid preparers for their 2012 taxes: 62.3%
Here:
62%
State:
51%
(% for various income ranges: 63.4% for AGIs below $25k, 62.9% for AGIs $25k-50k, 58.6% for AGIs $50k-75k, 53.6% for AGIs $75k-100k, 51.1% for AGIs $100k-200k, 60.0% for AGIs over 200k)
Averages for the 2004 tax year for zip code 75227, filed in 2005:
Average Adjusted Gross Income (AGI) in 2004: $28,264 (Individual Income Tax Returns)
Here:
$28,264
State:
$47,881
Salary/wage: $28,033 (reported on 88.1% of returns)
Here:
$28,033
State:
$41,947
(% of AGI for various income ranges: 89.5% for AGIs below $10k, 86.6% for AGIs $10k-25k, 91.8% for AGIs $25k-50k, 88.4% for AGIs $50k-75k, 81.8% for AGIs $75k-100k, 71.6% for AGIs over 100k)
Taxable interest for individuals: $1,209 (reported on 16.2% of returns)
This zip code:
$1,209
Texas:
$2,255
(% of AGI for various income ranges: 2.0% for AGIs below $10k, 0.6% for AGIs $10k-25k, 0.4% for AGIs $25k-50k, 0.8% for AGIs $50k-75k, 1.0% for AGIs $75k-100k, 1.5% for AGIs over 100k)
Taxable dividends: $1,619 (reported on 5.7% of returns)
Here:
$1,619
State:
$4,261
(% of AGI for various income ranges: 0.6% for AGIs below $10k, 0.2% for AGIs $10k-25k, 0.1% for AGIs $25k-50k, 0.4% for AGIs $50k-75k, 0.5% for AGIs $75k-100k, 1.0% for AGIs over 100k)
Net capital gain/loss: +$3,471 (reported on 4.0% of returns)
Here:
+$3,471
State:
+$16,110
(% of AGI for various income ranges: -0.5% for AGIs below $10k, 0.0% for AGIs $10k-25k, 0.1% for AGIs $25k-50k, 0.4% for AGIs $50k-75k, 0.8% for AGIs $75k-100k, 4.1% for AGIs over 100k)
Profit/loss from business: +$6,314 (reported on 15.9% of returns)
Here:
+$6,314
State:
+$11,013
(% of AGI for various income ranges: 13.3% for AGIs below $10k, 7.3% for AGIs $10k-25k, 1.9% for AGIs $25k-50k, 1.2% for AGIs $50k-75k, 2.3% for AGIs $75k-100k, 4.3% for AGIs over 100k)
IRA payment deduction: $2,494 (reported on 0.9% of returns)
75227:
$2,494
Texas:
$3,120
(% of AGI for various income ranges: 0.0% for AGIs $10k-25k, 0.1% for AGIs $25k-50k, 0.1% for AGIs $50k-75k, 0.1% for AGIs $75k-100k, 0.1% for AGIs over 100k)
Self-employed pension: $5,571 (reported on 0.1% of returns)
Here:
$5,571
Texas:
$16,401
Total itemized deductions: $14,638 (29% of AGI, reported on 18.6% of returns)
Here:
$14,638
State:
$19,631
Here:
29.2% of AGI
State:
18.9% of AGI
(% of AGI for various income ranges: 4.3% for AGIs below $10k, 5.2% for AGIs $10k-25k, 9.9% for AGIs $25k-50k, 12.7% for AGIs $50k-75k, 13.4% for AGIs $75k-100k, 11.2% for AGIs over 100k)
Charity contributions deductions: $3,893 (7% of AGI, reported on 15.7% of returns)
Here:
$3,893
State:
$4,753
Here:
7.5% of AGI
State:
4.2% of AGI
(% of AGI for various income ranges: 0.5% for AGIs below $10k, 0.8% for AGIs $10k-25k, 1.9% for AGIs $25k-50k, 2.9% for AGIs $50k-75k, 3.9% for AGIs $75k-100k, 4.0% for AGIs over 100k)
Total tax: $3,203 (reported on 57.4% of returns)
75227:
$3,203
State:
$9,058
(% of AGI for various income ranges: 3.7% for AGIs below $10k, 2.9% for AGIs $10k-25k, 4.8% for AGIs $25k-50k, 8.4% for AGIs $50k-75k, 11.0% for AGIs $75k-100k, 16.3% for AGIs over 100k)
Earned income credit: $2,089 (reported on 35.1% of returns)
Here:
$2,089
State:
$2,024
Percentage of individuals using paid preparers for their 2004 taxes: 66.2%
Here:
66%
State:
57%
(% for various income ranges: 59.7% for AGIs below $10k, 73.4% for AGIs $10k-25k, 65.8% for AGIs $25k-50k, 59.1% for AGIs $50k-75k, 55.8% for AGIs $75k-100k, 57.1% for AGIs over 100k)
Likely homosexual households (counted as self-reported same-sex unmarried-partner households)
Lesbian couples: 0.0% of all households
Gay men: 0.1% of all households
Household received Food Stamps/SNAP in the past 12 months: 3,158 Household did not receive Food Stamps/SNAP in the past 12 months: 16,691
Women who had a birth in the past 12 months: 917 (312 now married, 585 unmarried) Women who did not have a birth in the past 12 months: 14,539 (6,002 now married, 8,549 unmarried)
Housing units in zip code 75227 with a mortgage: 5,792 (32 second mortgage, 21 both second mortgage and home equity loan) Median monthly owner costs for units with a mortgage: $1,458 Median monthly owner costs for units without a mortgage: $520
Residents with income below the poverty level in 2022:
This zip code:
16.5%
Whole state:
14.0%
Residents with income below 50% of the poverty level in 2022:
This zip code:
7.6%
Whole state:
7.4%
Median number of rooms in houses and condos:
Here:
6.0
State:
6.3
Median number of rooms in apartments:
Here:
4.1
State:
4.0
Notable locations in this zip code not listed on our city pages
Notable locations in zip code 75227: Buckner Orphans Home (A), Dallas Fire - Rescue Station 32 (B), Pleasant Oaks Park Recreation Building (C). Display/hide their locations on the map
Churches in zip code 75227 include: Pleasant Mound Church (A), First Pentecostal Church of Pleasant Mound (B), Urban Independent Methodist Church (C), Pleasant Mound United Methodist Church (D), Eastminster Presbyterian Church (E), Friendship Church (F), Skyline Baptist Church (G), Victory Temple Missionary Baptist Church (H), Urban Park Baptist Church (I). Display/hide their locations on the map
Parks in zip code 75227 include: Lawnview Park (1), Pleasant Oaks Park (2), Parkdale Park (3), Urban Park (4), Urbandale Park (5), First Baptist Athletic Complex (6), Forester Field (7), Gateway Park (8), Glover Park (9). Display/hide their locations on the map
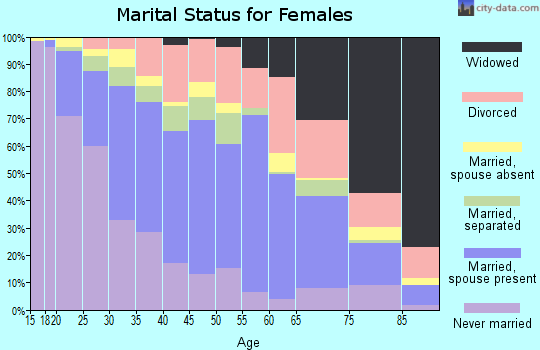
8,149 married couples with children.
5,711 single-parent households (1,151 men, 4,560 women).
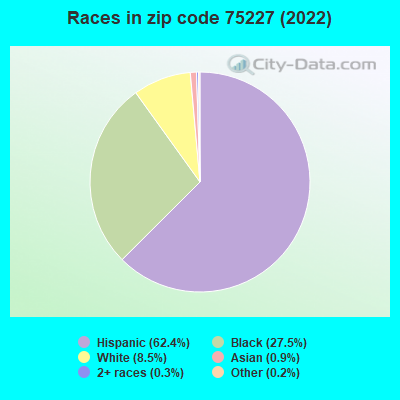
43.3% of residents of 75227 zip code speak English at home.
54.4% of residents speak Spanish at home (59% very well, 12% well, 18% not well, 11% not at all).
0.2% of residents speak other Indo-European language at home (8% very well, 92% well).
0.6% of residents speak Asian or Pacific Island language at home (55% very well, 13% well, 32% not well).
0.4% of residents speak other language at home (84% very well, 7% well, 10% not well).
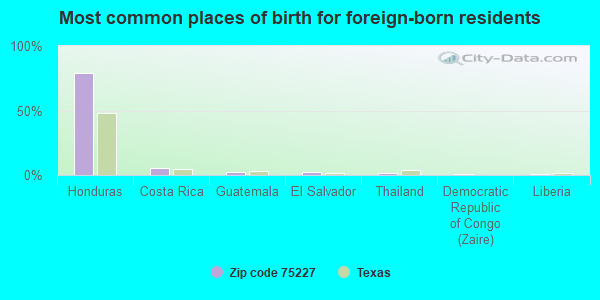
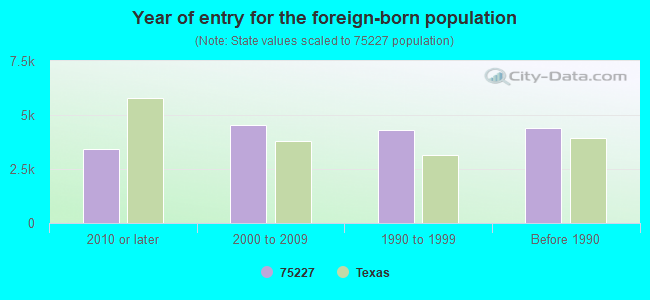
Foreign born population: 16,784 (28.0%) (26.8% of them are naturalized citizens)
Facilities with environmental interests located in this zip code:
ANNIE WEBB BLANTON EL (8915 GREENMOUND AVE in DALLAS, TX)
(National Center for Education Statistics) - STATE ID-057905110 Organizations: DALLAS ISD (SCHOOL DISTRICT)
ASCHER SILBERSTEIN EL (5940 HOLLIS AVE in DALLAS, TX)
(National Center for Education Statistics) - STATE ID-057905209 Organizations: DALLAS ISD (SCHOOL DISTRICT)
AUTO CONVOY CO (9211 FORNEY RD in DALLAS, TX)
(Resource Conservation and Recovery Act (tracking hazardous waste))
ACE AUTO SALES (8019 MILITARY PARKWAY in DALLAS, TX)
AIR MINOR (AIRS/AFS) Business SIC classification: GENERAL AUTOMOTIVE REPAIR SHOPS
ATLAS ARCHITECTURAL METALS INC (8240 LOVETT ST in DALLAS, TX)
TRI REPORTER (Tracking of toxic chemicals releasing facilities) Business SIC classification: ELECTROPLATING, PLATING, POLISHING, ANODIZING, AND COLORING
Housing units lacking complete plumbing facilities: 0.6% Housing units lacking complete kitchen facilities: 0.5%
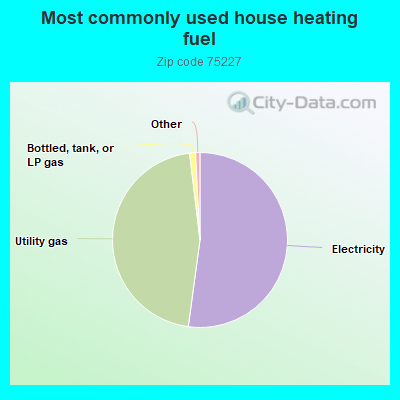
52.2%Electricity
46.0%Utility gas
1.1%Bottled, tank, or LP gas
Population in 1990: 39,631. Population change in the 1990s: +9,435 (+23.8%).
Place of birth for U.S.-born residents:
This state: 36,027
Northeast: 682
Midwest: 1,279
South: 3,388
West: 1,082
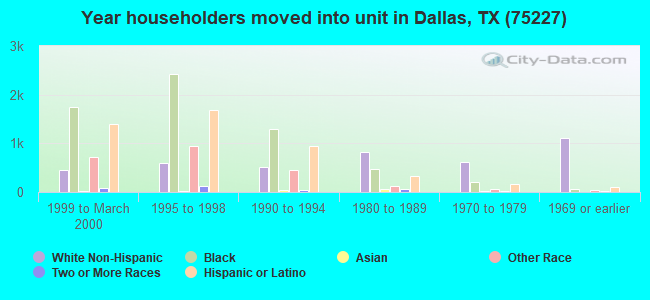
52% of the 75227 zip code residents lived in the same house 5 years ago. Out of people who lived in different houses, 84% lived in this county. Out of people who lived in different counties, 50% lived in Texas.
95% of the 75227 zip code residents lived in the same house 1 year ago. Out of people who lived in different houses, 58% moved from this county. Out of people who lived in different houses, 37% moved from different county within same state. Out of people who lived in different houses, 6% moved from different state. Out of people who lived in different houses, 2% moved from abroad.
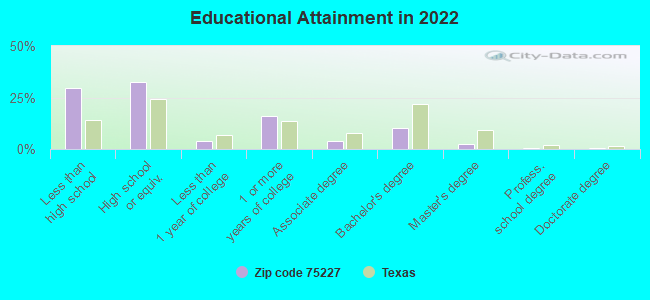
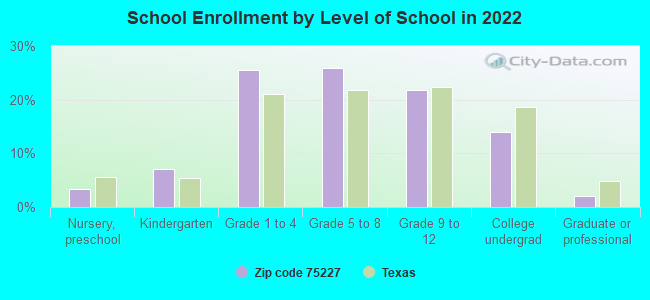
Private vs. public school enrollment:
Students in private schools in grades 1 to 8 (elementary and middle school): 422
Here:
5.1%
Texas:
8.8%
Students in private schools in grades 9 to 12 (high school): 130
Here:
3.7%
Texas:
8.0%
Students in private undergraduate colleges: 145
Here:
6.5%
Texas:
16.2%
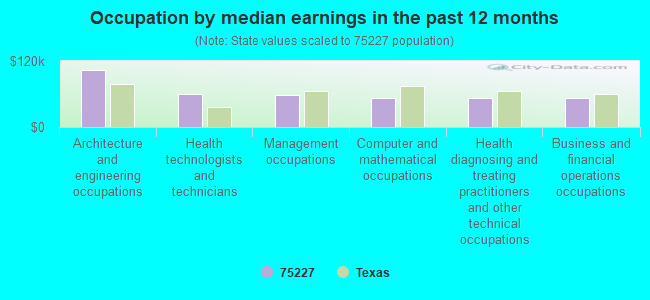
Occupation by median earnings in the past 12 months ($)
104,148Architecture and engineering occupations
60,749Health technologists and technicians
57,565Management occupations
52,775Computer and mathematical occupations
52,279Health diagnosing and treating practitioners and other technical occupations
52,152Business and financial operations occupations
Companies with federal contracts located in this zip code (DALLAS, TX):
CONTINENTAL ELECTRONICS, A DIV (4212 SOUTH BUCKNER BLVD) : $16,214,906 in 73 contractsfrom 1999 to 2006
Contracts for Miscellaneous Electrical and Electronic Components, Radio and Television Communication Equipment, Airborne, Radio and Television Communication Equipment, Except Airborne, Fire Control Transmitting and Receiving Equipment, except Airborne, and moreby Air Force, Navy, Broadcasting Board of Governors, Army, and others Signed by year:2000: $6,999,529; 2001: $3,790,940; 2002: $3,957,973; 2003: $31,289; 2004: $418,249; 2005: $610,906; 2006: $81,897.
Biggest contracts:
$5,017,095 with Air Force for Miscellaneous Electrical and Electronic Components. Signed on 2000-10-08. Completion date: 2001-10-30.
$1,368,104, same as above.Signed on 2001-05-09. Completion date: 2001-10-30.
$1,025,267, same as above.Signed on 2002-08-15. Completion date: 2004-09-30.
$479,392, same as above.Signed on 2001-04-25. Completion date: 2001-10-30.
CONTINENTAL ELECTRONICS, A DIV (4212 SOUTH BUCKNER BLVD) : $6,941,095 in 53 contractsfrom 2002 to 2006
Contracts for Miscellaneous Electrical and Electronic Components, Other Special Studies and Analyses, Transformers: Distribution and Power Station, Coils and Transformers, and moreby Air Force, Broadcasting Board of Governors, Defense Logistics Agency Signed by year:2000: $0; 2001: $0; 2002: $307,643; 2003: $2,453,466; 2004: $2,831,676; 2005: $1,016,564; 2006: $331,746.
Biggest contracts:
$1,448,575 with Air Force for Miscellaneous Electrical and Electronic Components. Signed on 2004-09-30. Completion date: 2004-09-30.
$1,102,172, same as above.Signed on 2003-02-06. Completion date: 2003-12-05.
$664,557, same as above.Signed on 2004-03-23. Completion date: 2004-09-30.
$347,779, same as above.Signed on 2003-10-01. Completion date: 2004-09-30.
CASTRO ROOFING OF TEXAS, LP (4854 OLSON DR; small business) : $1,145,321 in 12 contractsfrom 2000 to 2006
Contracts for Maintenance, Repair or Alteration of Real Property -- Miscellaneous Buildings, Maintenance, Repair or Alteration of Real Property -- Hospitals and Infirmaries, Construction of Structures and Facilities -- Miscellaneous Buildings, Roofing and Siding Materials by Army, Department of Veterans Affairs, U.S. Army Corps of Engineers - civil program financing only Signed by year:2000: $292,000; 2001: $124,000; 2002: $0; 2003: $0; 2004: $505,030; 2005: $107,709; 2006: $116,582.
Biggest contracts:
$387,778 with Army for Maintenance, Repair or Alteration of Real Property -- Miscellaneous Buildings. Signed on 2004-05-19. Completion date: 2004-09-30.
$292,000 with Department of Veterans Affairs for Maintenance, Repair or Alteration of Real Property -- Hospitals and Infirmaries. Signed on 2000-08-15. Completion date: 2001-02-15.
$116,582 with Army for Construction of Structures and Facilities -- Miscellaneous Buildings. Signed on 2006-05-03. Completion date: 2006-02-02.
$81,000 with Department of Veterans Affairs for Maintenance, Repair or Alteration of Real Property -- Hospitals and Infirmaries. Signed on 2001-01-15. Completion date: 2001-06-15.
ABATIX CORP (8201 EASTPOINT DR STE 500; small business) : $216,123 in 16 contractsfrom 2003 to 2006
Contracts for Miscellaneous Special Industry Machinery, Decontaminating and Impregnating Equipment, Armor, Personal, Hazard-Detecting Instruments and Apparatus, and moreby Army, Navy, Department of Veterans Affairs Signed by year:2000: $0; 2001: $0; 2002: $0; 2003: $83,599; 2004: $8,795; 2005: $53,496; 2006: $70,233.
Biggest contracts:
$58,376 with Army for Miscellaneous Special Industry Machinery. Signed on 2003-01-08. Completion date: 2003-02-10.
$48,351 with Navy for Decontaminating and Impregnating Equipment. Signed on 2006-06-20. Completion date: 2006-06-30.
$31,124 with Navy for Armor, Personal. Signed on 2005-03-18. Completion date: 2005-04-20.
$25,733 with Army for Hazard-Detecting Instruments and Apparatus. Taking place in MO. Signed on 2003-09-03. Completion date: 2003-09-19.
CONTINENTAL ELECTRONICS CORPOR (4212 S BUCKNER BLVD; small business) : $126,073 in 8 contractsfrom 2005 to 2006
Contracts for Communications Security Equipment and Components, Electric Services, Electrical and Electronic assemblies, Boards, Cards, and Associated Hardware, Capacitors, and moreby Navy, Broadcasting Board of Governors, Defense Logistics Agency Signed by year:2000: $0; 2001: $0; 2002: $0; 2003: $0; 2004: $0; 2005: $97,365; 2006: $28,708.
Biggest contracts:
$76,743 with Navy for Communications Security Equipment and Components. Signed on 2005-11-29. Completion date: 2006-02-28.
$12,972 with Broadcasting Board of Governors for Electric Services. Signed on 2005-10-20. Completion date: 2006-03-20.
$11,139 with Navy for Electrical and Electronic assemblies, Boards, Cards, and Associated Hardware. Signed on 2006-02-16. Completion date: 2006-06-16.
$7,650 with Broadcasting Board of Governors for Capacitors. Signed on 2005-10-21. Completion date: 2005-12-05.
CON-EQUIPMENT, INC. (4120 CEDAR LAKE DR; small business)
$36,704 with Army for Installation of Equipment -- Materials Handling Equipment. Signed on 2000-04-06. Completion date: 2000-04-10.
MICROSPACE INSTRUMENTS, INC (4751 WILBURTON DR; small business) : $5,559 in 2 contractsfrom 2005 to 2006
$5,063 with Air Force for Musical Instruments. Taking place in CO. Signed on 2006-05-05. Completion date: 2006-06-06.
$496 with Army for Screws. Signed on 2005-08-29. Completion date: 2006-05-31.
ABC DOORS OF DALLAS INC (4014 SCOTTSDALE DR; small business)
$2,930 with Army for Building Components, Prefabricated. Signed on 2003-06-05. Completion date: 2003-06-20.
Top industries in this zip code by the number of employees in 2005:
Health Care and Social Assistance: Nursing Care Facilities (100-249 employees: 3 establishments)
Construction: Drywall and Insulation Contractors (100-249: 2, 10-19: 1)
2002 - 2018 National Fire Incident Reporting System (NFIRS) incidents
Based on the data from the years 2002 - 2018 the average number of fire incidents per year is 121. The highest number of fires - 291 took place in 2003, and the least - 0 in 2008. The data has a decreasing trend.
When looking into fire subcategories, the most reports belonged to: Outside Fires (44.3%), and Mobile Property/Vehicle Fires (21.3%).
Fire incident types reported to NFIRS in Zip Code 75227
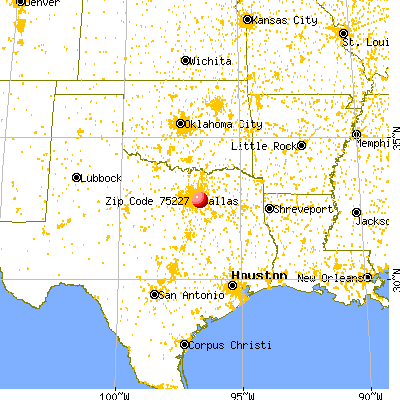


 Nearest zip codes: 75210, 75217, 75228, 75223, 75215, 75149.


 Based on the data from the years 2002 - 2018 the average number of fire incidents per year is 121. The highest number of fires - 291 took place in 2003, and the least - 0 in 2008. The data has a decreasing trend.
 When looking into fire subcategories, the most reports belonged to: Outside Fires (44.3%), and Mobile Property/Vehicle Fires (21.3%).