Estimated zip code population in 2022: 70,312 Zip code population in 2010: 66,551 Zip code population in 2000: 65,688
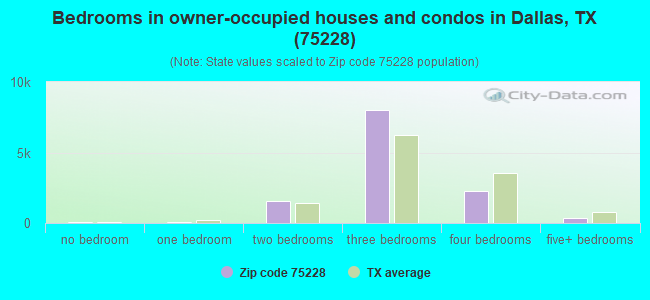
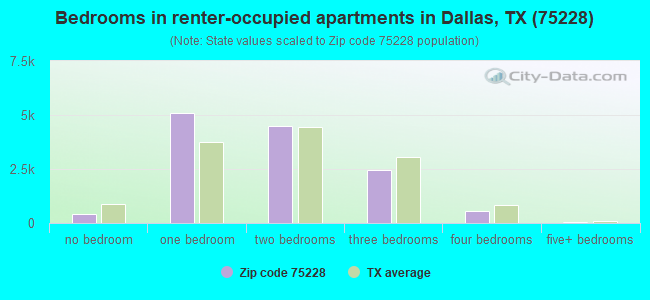
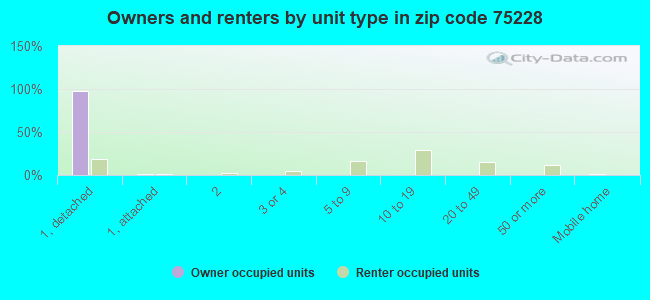
Houses and condos: 28,248 Renter-occupied apartments: 13,184
% of renters here:
52%
State:
38%
March 2022 cost of living index in zip code 75228: 95.3 (near average, U.S. average is 100)
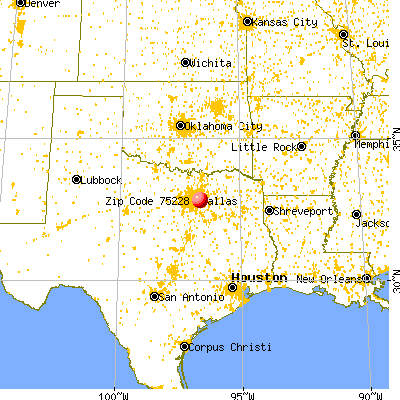
Land area: 11.4 sq. mi. Water area: 0.0 sq. mi.
Population density: 6,164 people per square mile
(high).
OSM Map
General Map
Google Map
MSN Map
OSM Map
General Map
Google Map
MSN Map
OSM Map
General Map
Google Map
MSN Map
OSM Map
General Map
Google Map
MSN Map
Please wait while loading the map...
Real estate property taxes paid for housing units in 2022:
This zip code:
1.2% ($3,269)
Texas:
1.5% ($4,050)
Median real estate property taxes paid for housing units with mortgages in 2022: $4,213 (1.5%) Median real estate property taxes paid for housing units with no mortgage in 2022: $2,462 (1.0%)
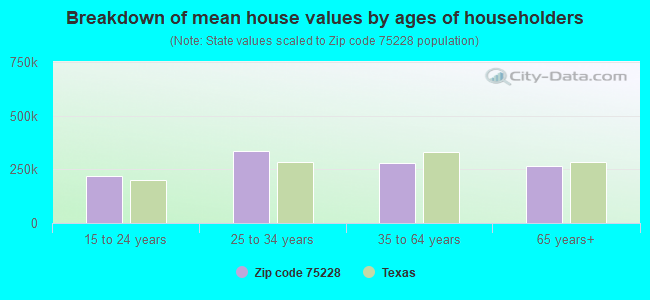
Estimated median house/condo value in 2022: $267,184
75228:
$267,184
Texas:
$275,400
According to our research of Texas and other state lists, there were 203 registered sex offenders living in 75228 zip code as of April 27, 2024. The ratio of all residents to sex offenders in zip code 75228 is 372 to 1. The ratio of registered sex offenders to all residents in this zip code is near the state average.
Median resident age:
This zip code:
31.1 years
Texas median age:
35.6 years
Average household size:
This zip code:
2.7 people
Texas:
2.6 people
Averages for the 2020 tax year for zip code 75228, filed in 2021:
Average Adjusted Gross Income (AGI) in 2020: $43,640 (Individual Income Tax Returns)
Here:
$43,640
State:
$77,054
Salary/wage: $41,229 (reported on 83.7% of returns)
Here:
$41,229
State:
$62,766
(% of AGI for various income ranges: 1258.2% for AGIs below $25k, 3781.7% for AGIs $25k-50k, 6763.5% for AGIs $50k-75k, 9924.3% for AGIs $75k-100k, 18196.3% for AGIs $100k-200k, 58768.8% for AGIs over 200k)
Taxable interest for individuals: $1,076 (reported on 11.7% of returns)
This zip code:
$1,076
Texas:
$2,665
(% of AGI for various income ranges: 6.2% for AGIs below $25k, 5.4% for AGIs $25k-50k, 18.7% for AGIs $50k-75k, 36.1% for AGIs $75k-100k, 75.8% for AGIs $100k-200k, 530.6% for AGIs over 200k)
Ordinary dividends: $3,607 (reported on 7.5% of returns)
Here:
$3,607
State:
$10,044
(% of AGI for various income ranges: 8.8% for AGIs below $25k, 12.8% for AGIs $25k-50k, 39.7% for AGIs $50k-75k, 73.3% for AGIs $75k-100k, 204.4% for AGIs $100k-200k, 1120.0% for AGIs over 200k)
Net capital gain/loss in AGI: +$12,781 (reported on 7.2% of returns)
Here:
+$12,781
State:
+$39,590
(% of AGI for various income ranges: 4.9% for AGIs below $25k, 9.2% for AGIs $25k-50k, 44.5% for AGIs $50k-75k, 130.5% for AGIs $75k-100k, 371.9% for AGIs $100k-200k, 11215.3% for AGIs over 200k)
Profit/loss from business: +$9,061 (reported on 23.7% of returns)
Here:
+$9,061
State:
+$10,888
(% of AGI for various income ranges: 224.8% for AGIs below $25k, 184.5% for AGIs $25k-50k, 291.0% for AGIs $50k-75k, 429.8% for AGIs $75k-100k, 889.8% for AGIs $100k-200k, 2962.4% for AGIs over 200k)
Taxable individual retirement arrangement distribution: $17,628 (reported on 3.5% of returns)
75228:
$17,628
Texas:
$24,740
(% of AGI for various income ranges: 18.9% for AGIs below $25k, 34.9% for AGIs $25k-50k, 113.1% for AGIs $50k-75k, 188.9% for AGIs $75k-100k, 494.2% for AGIs $100k-200k, 1580.0% for AGIs over 200k)
Self-employed (Keogh) retirement plans: $16,020 (reported on 0.2% of returns)
75228:
$16,020
Texas:
$29,298
(% of AGI for various income ranges: 10.9% for AGIs $50k-75k, 279.4% for AGIs over 200k)
Total itemized deductions: $26,147 (reported on 4.1% of returns)
Here:
$26,147
State:
$40,428
(% of AGI for various income ranges: 22.1% for AGIs below $25k, 68.0% for AGIs $25k-50k, 211.0% for AGIs $50k-75k, 367.6% for AGIs $75k-100k, 718.1% for AGIs $100k-200k, 3450.6% for AGIs over 200k)
Charity contributions: $7,828 (reported on 3.0% of returns)
Here:
$7,828
State:
$18,201
(% of AGI for various income ranges: 1.9% for AGIs below $25k, 11.9% for AGIs $25k-50k, 44.5% for AGIs $50k-75k, 51.0% for AGIs $75k-100k, 181.9% for AGIs $100k-200k, 1115.3% for AGIs over 200k)
Taxes paid: $6,809 (reported on 4.0% of returns)
75228:
$6,809
State:
$7,821
(% of AGI for various income ranges: 4.4% for AGIs below $25k, 15.9% for AGIs $25k-50k, 53.4% for AGIs $50k-75k, 110.4% for AGIs $75k-100k, 203.4% for AGIs $100k-200k, 744.1% for AGIs over 200k)
Earned income credit: $2,667 (reported on 26.1% of returns)
Here:
$2,667
State:
$2,584
(% of AGI for various income ranges: 149.0% for AGIs below $25k, 88.8% for AGIs $25k-50k, 1.3% for AGIs $50k-75k)
Percentage of individuals using paid preparers for their 2020 taxes: 89.1%
Here:
89%
State:
92%
(% for various income ranges: 87.3% for AGIs below $25k, 90.3% for AGIs $25k-50k, 89.6% for AGIs $50k-75k, 90.8% for AGIs $75k-100k, 92.6% for AGIs $100k-200k, 93.6% for AGIs over 200k)
Averages for the 2012 tax year for zip code 75228, filed in 2013:
Average Adjusted Gross Income (AGI) in 2012: $34,009 (Individual Income Tax Returns)
Here:
$34,009
State:
$65,384
Salary/wage: $32,054 (reported on 84.9% of returns)
Here:
$32,054
State:
$52,524
(% of AGI for various income ranges: 78.8% for AGIs below $25k, 87.6% for AGIs $25k-50k, 82.3% for AGIs $50k-75k, 78.9% for AGIs $75k-100k, 76.2% for AGIs $100k-200k, 54.6% for AGIs over 200k)
Taxable interest for individuals: $1,302 (reported on 13.4% of returns)
This zip code:
$1,302
Texas:
$2,372
(% of AGI for various income ranges: 0.4% for AGIs below $25k, 0.3% for AGIs $25k-50k, 0.4% for AGIs $50k-75k, 0.6% for AGIs $75k-100k, 0.8% for AGIs $100k-200k, 1.3% for AGIs over 200k)
Ordinary dividends: $5,400 (reported on 8.1% of returns)
Here:
$5,400
State:
$9,721
(% of AGI for various income ranges: 1.6% for AGIs below $25k, 0.9% for AGIs $25k-50k, 0.7% for AGIs $50k-75k, 1.1% for AGIs $75k-100k, 1.7% for AGIs $100k-200k, 2.6% for AGIs over 200k)
Net capital gain/loss in AGI: +$3,980 (reported on 5.8% of returns)
Here:
+$3,980
State:
+$35,319
(% of AGI for various income ranges: 0.1% for AGIs $25k-50k, 0.3% for AGIs $50k-75k, 0.7% for AGIs $75k-100k, 1.4% for AGIs $100k-200k, 4.7% for AGIs over 200k)
Profit/loss from business: +$8,732 (reported on 20.2% of returns)
Here:
+$8,732
State:
+$13,732
(% of AGI for various income ranges: 12.7% for AGIs below $25k, 3.1% for AGIs $25k-50k, 2.9% for AGIs $50k-75k, 2.7% for AGIs $75k-100k, 4.3% for AGIs $100k-200k, 2.6% for AGIs over 200k)
Taxable individual retirement arrangement distribution: $12,918 (reported on 5.5% of returns)
75228:
$12,918
Texas:
$19,511
(% of AGI for various income ranges: 1.4% for AGIs below $25k, 1.4% for AGIs $25k-50k, 2.1% for AGIs $50k-75k, 3.3% for AGIs $75k-100k, 3.5% for AGIs $100k-200k, 2.7% for AGIs over 200k)
Self-employment retirement plans: $13,900 (reported on 0.2% of returns)
75228:
$13,900
Texas:
$23,938
Total itemized deductions: $16,584 (22% of AGI, reported on 13.4% of returns)
Here:
$16,584
State:
$24,724
Here:
22.3% of AGI
State:
15.9% of AGI
(% of AGI for various income ranges: 3.2% for AGIs below $25k, 5.9% for AGIs $25k-50k, 7.9% for AGIs $50k-75k, 8.6% for AGIs $75k-100k, 9.0% for AGIs $100k-200k, 7.7% for AGIs over 200k)
Charity contributions: $3,748 (reported on 10.1% of returns)
Here:
$3,748
State:
$6,808
(% of AGI for various income ranges: 0.3% for AGIs below $25k, 0.8% for AGIs $25k-50k, 1.2% for AGIs $50k-75k, 1.7% for AGIs $75k-100k, 1.9% for AGIs $100k-200k, 2.1% for AGIs over 200k)
Taxes paid: $4,027 (reported on 13.0% of returns)
75228:
$4,027
State:
$6,921
(% of AGI for various income ranges: 0.6% for AGIs below $25k, 1.1% for AGIs $25k-50k, 1.9% for AGIs $50k-75k, 2.4% for AGIs $75k-100k, 2.5% for AGIs $100k-200k, 2.2% for AGIs over 200k)
Earned income credit: $2,757 (reported on 32.5% of returns)
Here:
$2,757
State:
$2,570
(% of AGI for various income ranges: 10.3% for AGIs below $25k, 1.6% for AGIs $25k-50k)
Percentage of individuals using paid preparers for their 2012 taxes: 58.1%
Here:
58%
State:
51%
(% for various income ranges: 61.2% for AGIs below $25k, 56.4% for AGIs $25k-50k, 52.3% for AGIs $50k-75k, 49.2% for AGIs $75k-100k, 50.5% for AGIs $100k-200k, 66.7% for AGIs over 200k)
Averages for the 2004 tax year for zip code 75228, filed in 2005:
Average Adjusted Gross Income (AGI) in 2004: $31,337 (Individual Income Tax Returns)
Here:
$31,337
State:
$47,881
Salary/wage: $29,669 (reported on 85.3% of returns)
Here:
$29,669
State:
$41,947
(% of AGI for various income ranges: 88.6% for AGIs below $10k, 83.2% for AGIs $10k-25k, 87.2% for AGIs $25k-50k, 81.0% for AGIs $50k-75k, 76.7% for AGIs $75k-100k, 64.9% for AGIs over 100k)
Taxable interest for individuals: $1,857 (reported on 24.5% of returns)
This zip code:
$1,857
Texas:
$2,255
(% of AGI for various income ranges: 2.4% for AGIs below $10k, 1.3% for AGIs $10k-25k, 1.0% for AGIs $25k-50k, 1.3% for AGIs $50k-75k, 1.5% for AGIs $75k-100k, 2.7% for AGIs over 100k)
Taxable dividends: $2,431 (reported on 11.9% of returns)
Here:
$2,431
State:
$4,261
(% of AGI for various income ranges: 1.9% for AGIs below $10k, 0.7% for AGIs $10k-25k, 0.5% for AGIs $25k-50k, 0.8% for AGIs $50k-75k, 1.0% for AGIs $75k-100k, 2.0% for AGIs over 100k)
Net capital gain/loss: +$4,422 (reported on 9.3% of returns)
Here:
+$4,422
State:
+$16,110
(% of AGI for various income ranges: -0.7% for AGIs below $10k, 0.0% for AGIs $10k-25k, 0.3% for AGIs $25k-50k, 0.5% for AGIs $50k-75k, 1.5% for AGIs $75k-100k, 6.3% for AGIs over 100k)
Profit/loss from business: +$7,925 (reported on 15.0% of returns)
Here:
+$7,925
State:
+$11,013
(% of AGI for various income ranges: 10.4% for AGIs below $10k, 6.1% for AGIs $10k-25k, 2.5% for AGIs $25k-50k, 2.5% for AGIs $50k-75k, 2.7% for AGIs $75k-100k, 4.9% for AGIs over 100k)
IRA payment deduction: $2,659 (reported on 1.3% of returns)
75228:
$2,659
Texas:
$3,120
(% of AGI for various income ranges: 0.3% for AGIs below $10k, 0.1% for AGIs $10k-25k, 0.1% for AGIs $25k-50k, 0.1% for AGIs $50k-75k, 0.1% for AGIs $75k-100k, 0.1% for AGIs over 100k)
Self-employed pension: $8,781 (reported on 0.3% of returns)
Here:
$8,781
Texas:
$16,401
(% of AGI for various income ranges: 0.0% for AGIs $25k-50k, 0.0% for AGIs $50k-75k, 0.1% for AGIs $75k-100k, 0.4% for AGIs over 100k)
Total itemized deductions: $14,781 (25% of AGI, reported on 18.2% of returns)
Here:
$14,781
State:
$19,631
Here:
24.5% of AGI
State:
18.9% of AGI
(% of AGI for various income ranges: 7.7% for AGIs below $10k, 4.6% for AGIs $10k-25k, 8.1% for AGIs $25k-50k, 10.7% for AGIs $50k-75k, 10.3% for AGIs $75k-100k, 10.7% for AGIs over 100k)
Charity contributions deductions: $3,317 (5% of AGI, reported on 14.5% of returns)
Here:
$3,317
State:
$4,753
Here:
5.2% of AGI
State:
4.2% of AGI
(% of AGI for various income ranges: 0.5% for AGIs below $10k, 0.6% for AGIs $10k-25k, 1.3% for AGIs $25k-50k, 1.8% for AGIs $50k-75k, 2.3% for AGIs $75k-100k, 2.5% for AGIs over 100k)
Total tax: $4,420 (reported on 61.7% of returns)
75228:
$4,420
State:
$9,058
(% of AGI for various income ranges: 3.3% for AGIs below $10k, 3.1% for AGIs $10k-25k, 6.0% for AGIs $25k-50k, 9.7% for AGIs $50k-75k, 12.1% for AGIs $75k-100k, 18.7% for AGIs over 100k)
Earned income credit: $2,055 (reported on 30.8% of returns)
Here:
$2,055
State:
$2,024
Percentage of individuals using paid preparers for their 2004 taxes: 62.0%
Here:
62%
State:
57%
(% for various income ranges: 59.1% for AGIs below $10k, 69.4% for AGIs $10k-25k, 60.1% for AGIs $25k-50k, 53.9% for AGIs $50k-75k, 51.1% for AGIs $75k-100k, 55.2% for AGIs over 100k)
Likely homosexual households (counted as self-reported same-sex unmarried-partner households)
Lesbian couples: 0.3% of all households
Gay men: 0.2% of all households
Household received Food Stamps/SNAP in the past 12 months: 3,724 Household did not receive Food Stamps/SNAP in the past 12 months: 21,839
Women who had a birth in the past 12 months: 812 (552 now married, 259 unmarried) Women who did not have a birth in the past 12 months: 17,016 (7,112 now married, 9,915 unmarried)
Housing units in zip code 75228 with a mortgage: 7,485 (236 second mortgage, 169 both second mortgage and home equity loan) Houses without a mortgage: 30
Median monthly owner costs for units with a mortgage: $1,619 Median monthly owner costs for units without a mortgage: $615
Residents with income below the poverty level in 2022:
This zip code:
20.8%
Whole state:
14.0%
Residents with income below 50% of the poverty level in 2022:
This zip code:
10.9%
Whole state:
7.4%
Median number of rooms in houses and condos:
Here:
6.0
State:
6.3
Median number of rooms in apartments:
Here:
3.9
State:
4.0
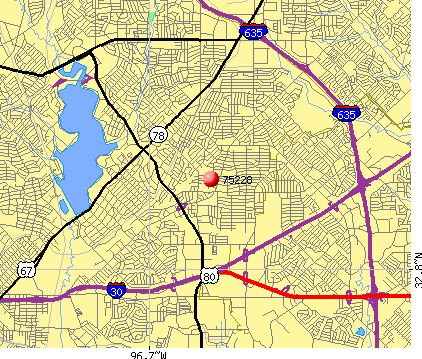
Notable locations in this zip code not listed on our city pages
Notable locations in zip code 75228: D A C Country Club (A), Dallas Fire - Rescue Station 39 (B), Dallas Fire - Rescue Station 53 (C), Golden Acres Home (D). Display/hide their locations on the map
Churches in zip code 75228 include: Emmanuel New Life Fellowship Church (A), Shiloh Road Church (B), Shiloh Road Baptist Church (C), Second Baptist Church (D), Primitive Baptist Church (E), Westglen Baptist Church (F), Vietnamese Faith Baptist Church (G), Church of Resurrection (H), Church of God Trinity Life (I). Display/hide their locations on the map
Parks in zip code 75228 include: Harry Stone Park (1), Lakeland Hill Park (2), Hillview Park (3), Saint Francis Park (4), Warrior Field (5), Roffino Stadium (6), Ferguson Road Park (7), Casa View Park (8). Display/hide their locations on the map
10,557 married couples with children.
6,289 single-parent households (1,314 men, 4,975 women).
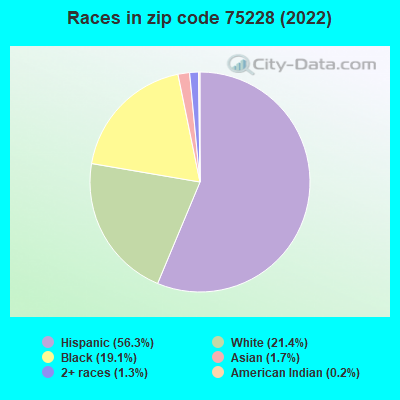
47.6% of residents of 75228 zip code speak English at home.
48.1% of residents speak Spanish at home (62% very well, 9% well, 20% not well, 10% not at all).
0.6% of residents speak other Indo-European language at home (69% very well, 17% well, 1% not well, 13% not at all).
1.1% of residents speak Asian or Pacific Island language at home (33% very well, 30% well, 26% not well, 10% not at all).
1.5% of residents speak other language at home (39% very well, 14% well, 7% not well, 40% not at all).
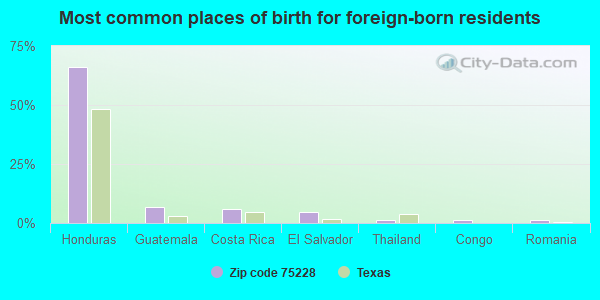
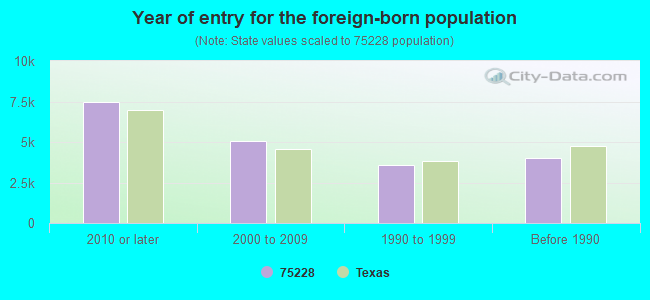
Foreign born population: 19,011 (27.0%) (20.0% of them are naturalized citizens)
Facilities with environmental interests located in this zip code:
ACCOUSTICAL SCREENS IN COLOR (12118 CORPORATE DR in DALLAS, TX)
(Resource Conservation and Recovery Act (tracking hazardous waste)) Business NAICS classification: SHOWCASE, PARTITION, SHELVING, AND LOCKER MANUFACTURING.
ATC VAN COM (8998 SENATE ST in DALLAS, TX)
Conditionally Exempt Small Quantity Generators, less than 100 kg/month of hazardous waste (Resource Conservation and Recovery Act (tracking hazardous waste)) Organizations: JEFF HOOVER (CONTACT/OPERATOR)
, CHRIS LANGMAYER (CONTACT/OWNER)
Housing units lacking complete plumbing facilities: 0.7% Housing units lacking complete kitchen facilities: 1.2%
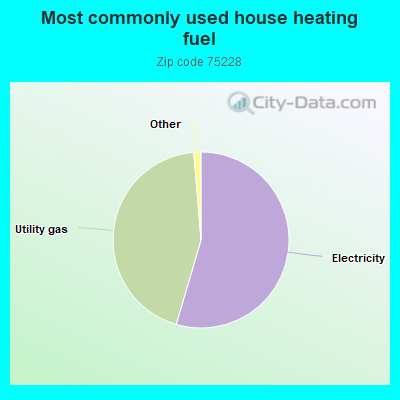
54.5%Electricity
44.1%Utility gas
0.6%Bottled, tank, or LP gas
0.6%No fuel used
Population in 1990: 55,010. Population change in the 1990s: +10,678 (+19.4%).
Place of birth for U.S.-born residents:
This state: 39,456
Northeast: 727
Midwest: 3,003
South: 4,311
West: 2,795
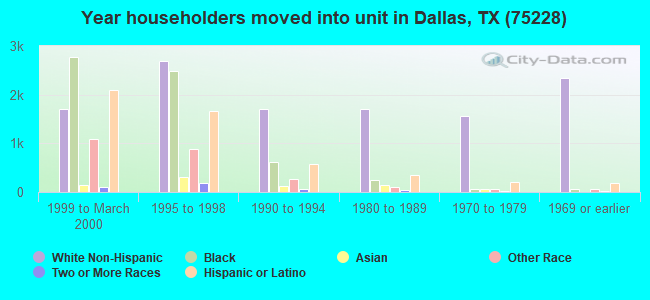
48% of the 75228 zip code residents lived in the same house 5 years ago. Out of people who lived in different houses, 79% lived in this county. Out of people who lived in different counties, 50% lived in Texas.
94% of the 75228 zip code residents lived in the same house 1 year ago. Out of people who lived in different houses, 68% moved from this county. Out of people who lived in different houses, 15% moved from different county within same state. Out of people who lived in different houses, 14% moved from different state. Out of people who lived in different houses, 4% moved from abroad.
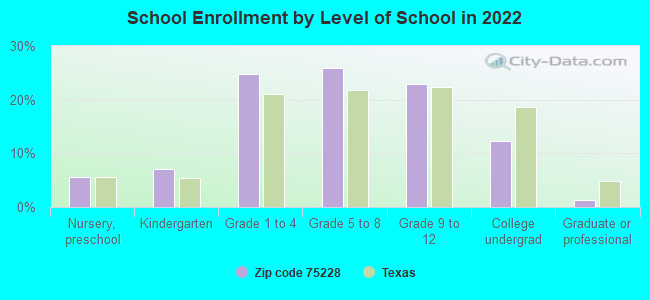
Private vs. public school enrollment:
Students in private schools in grades 1 to 8 (elementary and middle school): 365
Here:
4.1%
Texas:
8.8%
Students in private schools in grades 9 to 12 (high school): 199
Here:
5.0%
Texas:
8.0%
Students in private undergraduate colleges: 228
Here:
10.6%
Texas:
16.2%
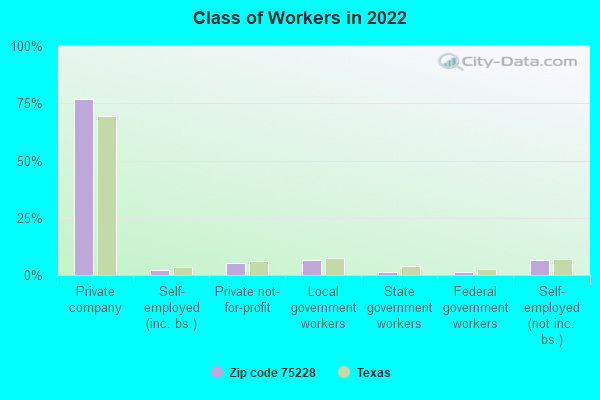
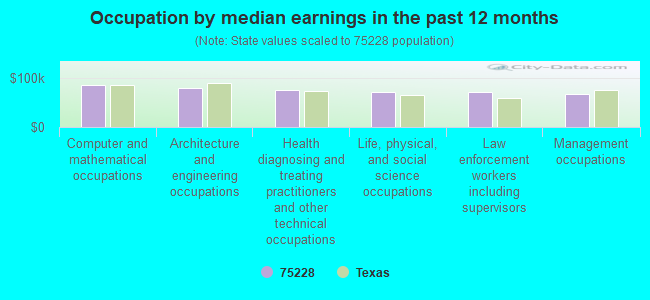
Occupation by median earnings in the past 12 months ($)
84,866Computer and mathematical occupations
78,172Architecture and engineering occupations
74,693Health diagnosing and treating practitioners and other technical occupations
71,625Life, physical, and social science occupations
71,090Law enforcement workers including supervisors
66,829Management occupations
Companies with federal contracts located in this zip code:
North Buckner Dialysis Center (3650 North Buckner Blvd, #108-A in Dallas, tx) : $55,080 in 9 contractsfrom 2005 to 2006
Contracts for Other Medical -- Advanced Development (R&D) by Bureau of Prisoners/Federal Prison System Signed by year:2000: $0; 2001: $0; 2002: $0; 2003: $0; 2004: $0; 2005: $38,863; 2006: $16,217.
Biggest contracts:
$22,500 with Bureau of Prisoners/Federal Prison System for Other Medical -- Advanced Development (R&D). Signed on 2005-11-09. Completion date: 2005-11-09.
$13,500, same as above.Signed on 2005-11-18. Completion date: 2005-11-18.
$4,028, same as above.Signed on 2006-03-16. Completion date: 2006-03-16.
$3,474, same as above.Signed on 2006-03-16. Completion date: 2006-03-16.
GOODWIN, OUIDA B (2647 GLOBE ST in DALLAS, TX; small business) : $47,358 in 7 contractsfrom 2004 to 2006
Contracts for Other Administrative Support Services by U.S. Army Corps of Engineers - civil program financing only, Army Signed by year:2000: $0; 2001: $0; 2002: $0; 2003: $0; 2004: $18,768; 2005: $19,260; 2006: $9,330.
Biggest contracts:
$9,630 with U.S. Army Corps of Engineers - civil program financing only for Other Administrative Support Services. Signed on 2005-03-09. Completion date: 2005-02-22.
$9,630 with Army for Other Administrative Support Services. Signed on 2005-03-09. Completion date: 2005-02-22.
$9,384 with U.S. Army Corps of Engineers - civil program financing only for Other Administrative Support Services. Signed on 2004-02-05. Completion date: 2004-01-28.
$9,384 with Army for Other Administrative Support Services. Signed on 2004-02-05. Completion date: 2004-01-28.
COMPUTER ENVIRONMENTS INC (1616 JOHN WEST RD in DALLAS, TX; small business) : $35,973 in 6 contractsfrom 2002 to 2006
Contracts for Miscellaneous Items, Plate, Sheet, Strip, Foil, and Wire; Precious Metal, Floor Coverings by Army, Bureau of Prisoners/Federal Prison System, Air Force, U.S. Army Corps of Engineers - civil program financing only, and others Signed by year:2000: $0; 2001: $0; 2002: $9,067; 2003: $0; 2004: $8,978; 2005: $4,254; 2006: $13,674.
Biggest contracts:
$9,067 with Army for Miscellaneous Items. Taking place in MS. Signed on 2002-01-16. Completion date: 2002-02-28.
$8,136 with Bureau of Prisoners/Federal Prison System for Plate, Sheet, Strip, Foil, and Wire; Precious Metal. Signed on 2006-04-14. Completion date: 2006-05-14.
$5,538 with Air Force for Floor Coverings. Signed on 2006-03-20. Completion date: 2006-04-16.
$4,489 with U.S. Army Corps of Engineers - civil program financing only for Floor Coverings. Signed on 2004-01-28. Completion date: 2004-02-13.
SUNBEAM FOODS INC (3324 DILIDO RD STE S in DALLAS, TX; small business)
$10,665 with Department of Defense for Packaging and Packing Bulk Materials. Signed on 2005-06-09. Completion date: 2005-06-17.
CROSS CULTURE COMMUNICATIONS (2525 SWEETBRIAR DR in DALLAS, TX; small business)
$7,000 with Air Force for Education Services. Signed on 2006-04-05. Completion date: 2006-04-05.
North Buckner dialysis center (3650 North Buckner Blvd. Suite 108A in Dallas, tx) : $4,690 in 5 contractsin 2005
Contracts for Medical and Health Studies by Bureau of Prisoners/Federal Prison System Signed by year:2000: $0; 2001: $0; 2002: $0; 2003: $0; 2004: $0; 2005: $4,690; 2006: $0.
Biggest contracts:
$2,740 with Bureau of Prisoners/Federal Prison System for Medical and Health Studies. Signed on 2005-09-27. Completion date: 2005-09-30.
$975, same as above.Signed on 2005-11-18. Completion date: 2005-11-30.
$975, same as above.Signed on 2005-09-27. Completion date: 2005-09-30.
$0, same as above.Signed on 2005-09-27. Completion date: 2005-09-30.
Top industries in this zip code by the number of employees in 2005:
2002 - 2018 National Fire Incident Reporting System (NFIRS) incidents
Based on the data from the years 2002 - 2018 the average number of fires per year is 135. The highest number of fire incidents - 308 took place in 2002, and the least - 1 in 2008. The data has a declining trend.
When looking into fire subcategories, the most incidents belonged to: Outside Fires (43.4%), and Structure Fires (22.2%).
Fire incident types reported to NFIRS in Zip Code 75228


 Nearest zip codes: 75218, 75150, 75227, 75238, 75041, 75214.
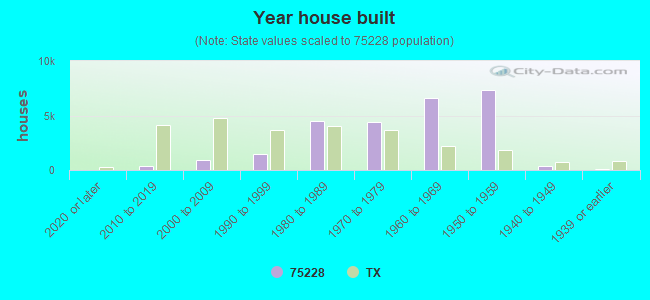


 Based on the data from the years 2002 - 2018 the average number of fires per year is 135. The highest number of fire incidents - 308 took place in 2002, and the least - 1 in 2008. The data has a declining trend.
 When looking into fire subcategories, the most incidents belonged to: Outside Fires (43.4%), and Structure Fires (22.2%).