Estimated zip code population in 2022: 33,045 Zip code population in 2010: 30,483 Zip code population in 2000: 31,336
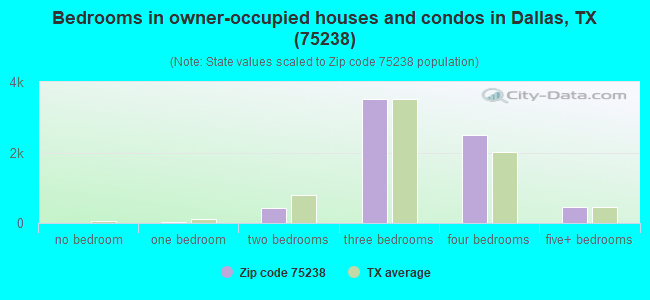
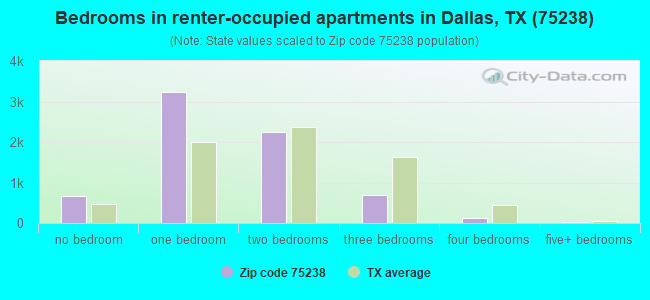
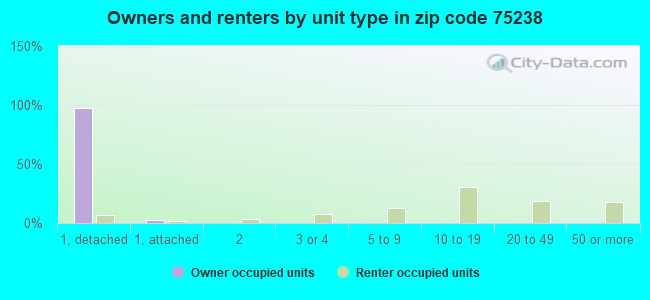
Houses and condos: 14,857 Renter-occupied apartments: 6,917
% of renters here:
50%
State:
38%
March 2022 cost of living index in zip code 75238: 98.7 (near average, U.S. average is 100)
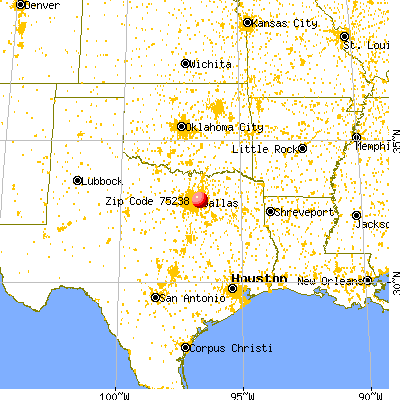
Land area: 6.6 sq. mi. Water area: 0.0 sq. mi.
Population density: 5,025 people per square mile
(average).
OSM Map
General Map
Google Map
MSN Map
OSM Map
General Map
Google Map
MSN Map
OSM Map
General Map
Google Map
MSN Map
OSM Map
General Map
Google Map
MSN Map
Please wait while loading the map...
Real estate property taxes paid for housing units in 2022:
This zip code:
1.5% ($8,069)
Texas:
1.5% ($4,050)
Median real estate property taxes paid for housing units with mortgages in 2022: $9,391 (1.6%) Median real estate property taxes paid for housing units with no mortgage in 2022: $5,649 (1.1%)
Estimated median house/condo value in 2022: $553,114
75238:
$553,114
Texas:
$275,400
According to our research of Texas and other state lists, there were 20 registered sex offenders living in 75238 zip code as of April 27, 2024. The ratio of all residents to sex offenders in zip code 75238 is 1,659 to 1. The ratio of registered sex offenders to all residents in this zip code is much lower than the state average.
Median resident age:
This zip code:
36.2 years
Texas median age:
35.6 years
Average household size:
This zip code:
2.4 people
Texas:
2.6 people
Averages for the 2020 tax year for zip code 75238, filed in 2021:
Average Adjusted Gross Income (AGI) in 2020: $106,271 (Individual Income Tax Returns)
Here:
$106,271
State:
$77,054
Salary/wage: $89,925 (reported on 82.4% of returns)
Here:
$89,925
State:
$62,766
(% of AGI for various income ranges: 1314.0% for AGIs below $25k, 3699.4% for AGIs $25k-50k, 6535.7% for AGIs $50k-75k, 10205.1% for AGIs $75k-100k, 19920.2% for AGIs $100k-200k, 72457.2% for AGIs over 200k)
Taxable interest for individuals: $2,494 (reported on 31.6% of returns)
This zip code:
$2,494
Texas:
$2,665
(% of AGI for various income ranges: 16.7% for AGIs below $25k, 19.7% for AGIs $25k-50k, 50.9% for AGIs $50k-75k, 98.3% for AGIs $75k-100k, 147.7% for AGIs $100k-200k, 983.8% for AGIs over 200k)
Ordinary dividends: $7,577 (reported on 28.7% of returns)
Here:
$7,577
State:
$10,044
(% of AGI for various income ranges: 36.4% for AGIs below $25k, 55.2% for AGIs $25k-50k, 195.3% for AGIs $50k-75k, 337.5% for AGIs $75k-100k, 568.1% for AGIs $100k-200k, 2311.8% for AGIs over 200k)
Net capital gain/loss in AGI: +$26,205 (reported on 26.1% of returns)
Here:
+$26,205
State:
+$39,590
(% of AGI for various income ranges: 12.1% for AGIs below $25k, 27.6% for AGIs $25k-50k, 124.7% for AGIs $50k-75k, 371.2% for AGIs $75k-100k, 618.8% for AGIs $100k-200k, 11711.8% for AGIs over 200k)
Profit/loss from business: +$19,697 (reported on 23.6% of returns)
Here:
+$19,697
State:
+$10,888
(% of AGI for various income ranges: 140.3% for AGIs below $25k, 131.9% for AGIs $25k-50k, 286.7% for AGIs $50k-75k, 719.7% for AGIs $75k-100k, 1307.3% for AGIs $100k-200k, 4640.6% for AGIs over 200k)
Taxable individual retirement arrangement distribution: $22,174 (reported on 9.0% of returns)
75238:
$22,174
Texas:
$24,740
(% of AGI for various income ranges: 38.6% for AGIs below $25k, 85.6% for AGIs $25k-50k, 314.6% for AGIs $50k-75k, 518.8% for AGIs $75k-100k, 729.7% for AGIs $100k-200k, 1206.9% for AGIs over 200k)
Self-employed (Keogh) retirement plans: $28,985 (reported on 1.5% of returns)
75238:
$28,985
Texas:
$29,298
(% of AGI for various income ranges: 80.2% for AGIs $100k-200k, 701.6% for AGIs over 200k)
Total itemized deductions: $36,207 (reported on 15.8% of returns)
Here:
$36,207
State:
$40,428
(% of AGI for various income ranges: 60.4% for AGIs below $25k, 128.0% for AGIs $25k-50k, 397.0% for AGIs $50k-75k, 898.0% for AGIs $75k-100k, 1417.2% for AGIs $100k-200k, 6570.3% for AGIs over 200k)
Charity contributions: $13,747 (reported on 13.8% of returns)
Here:
$13,747
State:
$18,201
(% of AGI for various income ranges: 4.8% for AGIs below $25k, 21.7% for AGIs $25k-50k, 72.0% for AGIs $50k-75k, 184.7% for AGIs $75k-100k, 384.2% for AGIs $100k-200k, 2656.9% for AGIs over 200k)
Taxes paid: $8,847 (reported on 15.6% of returns)
75238:
$8,847
State:
$7,821
(% of AGI for various income ranges: 14.1% for AGIs below $25k, 30.8% for AGIs $25k-50k, 107.4% for AGIs $50k-75k, 243.6% for AGIs $75k-100k, 417.7% for AGIs $100k-200k, 1412.6% for AGIs over 200k)
Earned income credit: $2,533 (reported on 16.2% of returns)
Here:
$2,533
State:
$2,584
(% of AGI for various income ranges: 126.7% for AGIs below $25k, 82.1% for AGIs $25k-50k, 0.9% for AGIs $50k-75k)
Percentage of individuals using paid preparers for their 2020 taxes: 90.9%
Here:
91%
State:
92%
(% for various income ranges: 87.2% for AGIs below $25k, 92.0% for AGIs $25k-50k, 91.0% for AGIs $50k-75k, 91.8% for AGIs $75k-100k, 92.6% for AGIs $100k-200k, 94.5% for AGIs over 200k)
Averages for the 2012 tax year for zip code 75238, filed in 2013:
Average Adjusted Gross Income (AGI) in 2012: $72,339 (Individual Income Tax Returns)
Here:
$72,339
State:
$65,384
Salary/wage: $61,687 (reported on 83.3% of returns)
Here:
$61,687
State:
$52,524
(% of AGI for various income ranges: 80.6% for AGIs below $25k, 81.2% for AGIs $25k-50k, 72.0% for AGIs $50k-75k, 71.4% for AGIs $75k-100k, 77.8% for AGIs $100k-200k, 59.7% for AGIs over 200k)
Taxable interest for individuals: $2,145 (reported on 32.0% of returns)
This zip code:
$2,145
Texas:
$2,372
(% of AGI for various income ranges: 0.8% for AGIs below $25k, 0.7% for AGIs $25k-50k, 1.1% for AGIs $50k-75k, 1.1% for AGIs $75k-100k, 0.7% for AGIs $100k-200k, 1.2% for AGIs over 200k)
Ordinary dividends: $6,364 (reported on 25.6% of returns)
Here:
$6,364
State:
$9,721
(% of AGI for various income ranges: 2.3% for AGIs below $25k, 2.3% for AGIs $25k-50k, 2.5% for AGIs $50k-75k, 2.2% for AGIs $75k-100k, 1.9% for AGIs $100k-200k, 2.5% for AGIs over 200k)
Net capital gain/loss in AGI: +$12,318 (reported on 21.2% of returns)
Here:
+$12,318
State:
+$35,319
(% of AGI for various income ranges: 0.1% for AGIs $25k-50k, 0.8% for AGIs $50k-75k, 1.2% for AGIs $75k-100k, 1.5% for AGIs $100k-200k, 8.7% for AGIs over 200k)
Profit/loss from business: +$17,694 (reported on 21.4% of returns)
Here:
+$17,694
State:
+$13,732
(% of AGI for various income ranges: 8.3% for AGIs below $25k, 3.2% for AGIs $25k-50k, 5.0% for AGIs $50k-75k, 5.5% for AGIs $75k-100k, 5.2% for AGIs $100k-200k, 5.2% for AGIs over 200k)
Taxable individual retirement arrangement distribution: $20,339 (reported on 11.2% of returns)
75238:
$20,339
Texas:
$19,511
(% of AGI for various income ranges: 3.0% for AGIs below $25k, 3.1% for AGIs $25k-50k, 4.4% for AGIs $50k-75k, 4.3% for AGIs $75k-100k, 3.0% for AGIs $100k-200k, 2.7% for AGIs over 200k)
Self-employment retirement plans: $19,447 (reported on 1.1% of returns)
75238:
$19,447
Texas:
$23,938
(% of AGI for various income ranges: 0.4% for AGIs $50k-75k, 0.2% for AGIs $100k-200k, 0.6% for AGIs over 200k)
Total itemized deductions: $24,009 (17% of AGI, reported on 34.8% of returns)
Here:
$24,009
State:
$24,724
Here:
16.7% of AGI
State:
15.9% of AGI
(% of AGI for various income ranges: 8.0% for AGIs below $25k, 10.0% for AGIs $25k-50k, 13.7% for AGIs $50k-75k, 13.7% for AGIs $75k-100k, 13.0% for AGIs $100k-200k, 10.3% for AGIs over 200k)
Charity contributions: $6,979 (reported on 29.8% of returns)
Here:
$6,979
State:
$6,808
(% of AGI for various income ranges: 0.8% for AGIs below $25k, 1.4% for AGIs $25k-50k, 2.3% for AGIs $50k-75k, 2.5% for AGIs $75k-100k, 2.7% for AGIs $100k-200k, 4.2% for AGIs over 200k)
Taxes paid: $7,318 (reported on 34.0% of returns)
75238:
$7,318
State:
$6,921
(% of AGI for various income ranges: 1.7% for AGIs below $25k, 2.4% for AGIs $25k-50k, 4.0% for AGIs $50k-75k, 4.3% for AGIs $75k-100k, 4.4% for AGIs $100k-200k, 2.9% for AGIs over 200k)
Earned income credit: $2,659 (reported on 19.5% of returns)
Here:
$2,659
State:
$2,570
(% of AGI for various income ranges: 8.1% for AGIs below $25k, 1.3% for AGIs $25k-50k)
Percentage of individuals using paid preparers for their 2012 taxes: 54.0%
Here:
54%
State:
51%
(% for various income ranges: 58.4% for AGIs below $25k, 54.3% for AGIs $25k-50k, 48.9% for AGIs $50k-75k, 47.1% for AGIs $75k-100k, 47.4% for AGIs $100k-200k, 59.3% for AGIs over 200k)
Averages for the 2004 tax year for zip code 75238, filed in 2005:
Average Adjusted Gross Income (AGI) in 2004: $59,471 (Individual Income Tax Returns)
Here:
$59,471
State:
$47,881
Salary/wage: $50,660 (reported on 81.6% of returns)
Here:
$50,660
State:
$41,947
(% of AGI for various income ranges: 169.1% for AGIs below $10k, 79.6% for AGIs $10k-25k, 80.3% for AGIs $25k-50k, 70.5% for AGIs $50k-75k, 74.4% for AGIs $75k-100k, 63.0% for AGIs over 100k)
Taxable interest for individuals: $2,730 (reported on 43.9% of returns)
This zip code:
$2,730
Texas:
$2,255
(% of AGI for various income ranges: 12.8% for AGIs below $10k, 2.1% for AGIs $10k-25k, 1.8% for AGIs $25k-50k, 2.0% for AGIs $50k-75k, 2.0% for AGIs $75k-100k, 1.9% for AGIs over 100k)
Taxable dividends: $3,875 (reported on 31.4% of returns)
Here:
$3,875
State:
$4,261
(% of AGI for various income ranges: 10.0% for AGIs below $10k, 2.0% for AGIs $10k-25k, 1.6% for AGIs $25k-50k, 2.2% for AGIs $50k-75k, 2.2% for AGIs $75k-100k, 2.0% for AGIs over 100k)
Net capital gain/loss: +$10,833 (reported on 26.1% of returns)
Here:
+$10,833
State:
+$16,110
(% of AGI for various income ranges: -6.5% for AGIs below $10k, -0.1% for AGIs $10k-25k, 0.6% for AGIs $25k-50k, 1.0% for AGIs $50k-75k, 2.0% for AGIs $75k-100k, 8.1% for AGIs over 100k)
Profit/loss from business: +$16,135 (reported on 18.8% of returns)
Here:
+$16,135
State:
+$11,013
(% of AGI for various income ranges: 17.1% for AGIs below $10k, 5.4% for AGIs $10k-25k, 3.0% for AGIs $25k-50k, 6.0% for AGIs $50k-75k, 5.4% for AGIs $75k-100k, 5.2% for AGIs over 100k)
IRA payment deduction: $3,108 (reported on 2.4% of returns)
75238:
$3,108
Texas:
$3,120
(% of AGI for various income ranges: 0.6% for AGIs below $10k, 0.1% for AGIs $10k-25k, 0.2% for AGIs $25k-50k, 0.2% for AGIs $50k-75k, 0.2% for AGIs $75k-100k, 0.1% for AGIs over 100k)
Self-employed pension: $15,611 (reported on 1.5% of returns)
Here:
$15,611
Texas:
$16,401
(% of AGI for various income ranges: 0.1% for AGIs $25k-50k, 0.2% for AGIs $50k-75k, 0.4% for AGIs $75k-100k, 0.6% for AGIs over 100k)
Total itemized deductions: $20,930 (19% of AGI, reported on 36.7% of returns)
Here:
$20,930
State:
$19,631
Here:
19.3% of AGI
State:
18.9% of AGI
(% of AGI for various income ranges: 32.8% for AGIs below $10k, 8.7% for AGIs $10k-25k, 11.9% for AGIs $25k-50k, 15.4% for AGIs $50k-75k, 16.1% for AGIs $75k-100k, 12.2% for AGIs over 100k)
Charity contributions deductions: $4,985 (5% of AGI, reported on 32.7% of returns)
Here:
$4,985
State:
$4,753
Here:
4.7% of AGI
State:
4.2% of AGI
(% of AGI for various income ranges: 1.7% for AGIs below $10k, 1.2% for AGIs $10k-25k, 2.0% for AGIs $25k-50k, 2.5% for AGIs $50k-75k, 3.1% for AGIs $75k-100k, 3.1% for AGIs over 100k)
Total tax: $12,099 (reported on 72.8% of returns)
75238:
$12,099
State:
$9,058
(% of AGI for various income ranges: 8.2% for AGIs below $10k, 3.4% for AGIs $10k-25k, 6.9% for AGIs $25k-50k, 10.6% for AGIs $50k-75k, 11.6% for AGIs $75k-100k, 20.1% for AGIs over 100k)
Earned income credit: $1,990 (reported on 18.3% of returns)
Here:
$1,990
State:
$2,024
Percentage of individuals using paid preparers for their 2004 taxes: 55.7%
Here:
56%
State:
57%
(% for various income ranges: 52.9% for AGIs below $10k, 66.9% for AGIs $10k-25k, 56.5% for AGIs $25k-50k, 48.7% for AGIs $50k-75k, 45.1% for AGIs $75k-100k, 52.0% for AGIs over 100k)
Likely homosexual households (counted as self-reported same-sex unmarried-partner households)
Lesbian couples: 0.1% of all households
Gay men: 0.2% of all households
Household received Food Stamps/SNAP in the past 12 months: 1,236 Household did not receive Food Stamps/SNAP in the past 12 months: 12,597
Women who had a birth in the past 12 months: 509 (394 now married, 118 unmarried) Women who did not have a birth in the past 12 months: 7,615 (3,832 now married, 3,768 unmarried)
Housing units in zip code 75238 with a mortgage: 4,319 (313 second mortgage, 16 home equity loan, 170 both second mortgage and home equity loan) Houses without a mortgage: 17
Median monthly owner costs for units with a mortgage: $2,877 Median monthly owner costs for units without a mortgage: $982
Residents with income below the poverty level in 2022:
This zip code:
9.7%
Whole state:
14.0%
Residents with income below 50% of the poverty level in 2022:
This zip code:
5.4%
Whole state:
7.4%
Median number of rooms in houses and condos:
Here:
7.2
State:
6.3
Median number of rooms in apartments:
Here:
3.7
State:
4.0
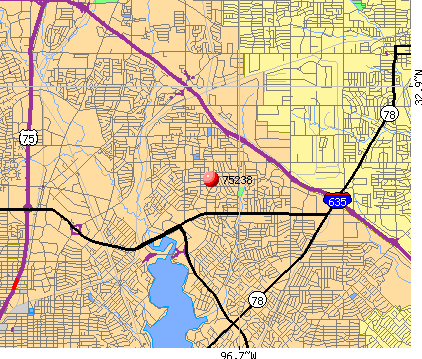
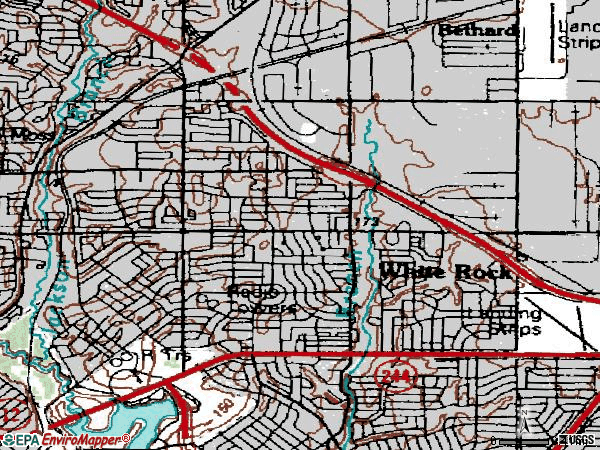
Notable locations in this zip code not listed on our city pages
Notable locations in zip code 75238: Dallas Fire - Rescue Station 48 (A), North Texas Training Association Academy (B). Display/hide their locations on the map
Churches in zip code 75238 include: Northminster Presbyterian Church (A), Saint Patrick Catholic Church (B), Church of Christ Lake Highlands (C), Bethel Lutheran Church (D), Bethany Lutheran Church (E), Saint James Episcopal Church (F), African Baptist Church of North Dallas (G), Fellowship Bible Church (H), Holy Ghost Chapel of the Resurrection (I). Display/hide their locations on the map
Parks in zip code 75238 include: Skyline Park (1), McCree Park (2), Wildcat-Ram Stadium (3), Flag Pole Hill Park (4). Display/hide their locations on the map
Tourist attraction (not listed on the city page) : A Loving Touch By Sabrina (Tours & Charters; 8826 Skillman).
In group quarters: 240 (-1 institutionalized population)
Size of family households: 4,104 2-persons, 2,208 3-persons, 1,832 4-persons, 670 5-persons, 204 6-persons, 86 7-or-more-persons
Size of nonfamily households: 4,027 1-person, 698 2-persons, 52 3-persons
6,611 married couples with children.
1,865 single-parent households (184 men, 1,681 women).
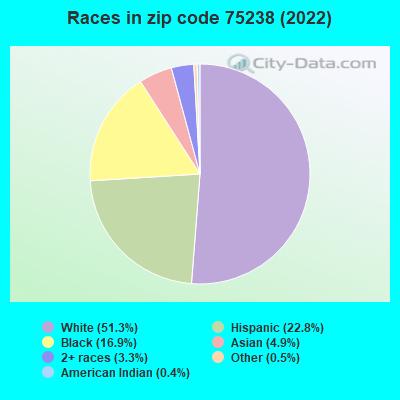
74.3% of residents of 75238 zip code speak English at home.
17.7% of residents speak Spanish at home (47% very well, 21% well, 16% not well, 16% not at all).
1.1% of residents speak other Indo-European language at home (54% very well, 33% well, 12% not well).
2.7% of residents speak Asian or Pacific Island language at home (32% very well, 32% well, 26% not well, 10% not at all).
4.0% of residents speak other language at home (74% very well, 21% well, 4% not well, 1% not at all).
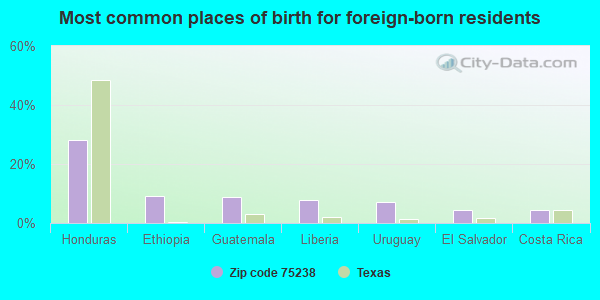
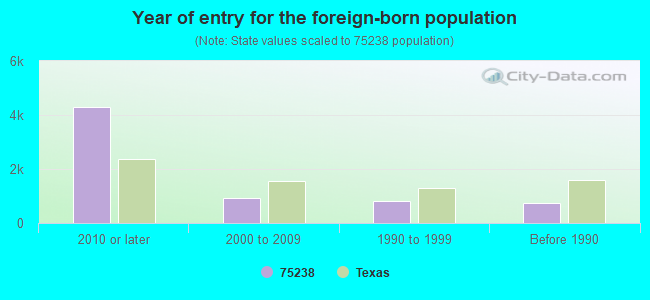
Foreign born population: 5,750 (17.4%) (27.7% of them are naturalized citizens)
Facilities with environmental interests located in this zip code:
A-1 DENTAL LAB INC (10507 CHURCH RD in DALLAS, TX)
(Resource Conservation and Recovery Act (tracking hazardous waste))
AMERICAN PAD & PAPER COMPANY OF DELAWARE (10231 PLANO RD in DALLAS, TX)
(Resource Conservation and Recovery Act (tracking hazardous waste)) Business NAICS classification: ENVELOPE MANUFACTURING. Alternative names: WILLIAMHOUSE OF DALLAS
AUSTIN GAIL DENTAL LABORATORY (10405 E NORTHWEST HWY in DALLAS, TX)
(Resource Conservation and Recovery Act (tracking hazardous waste))
B2E RESOURCE (10455 VISTA PARK RD in DALLAS, TX)
(Resource Conservation and Recovery Act (tracking hazardous waste)) Business NAICS classification: MANIFOLD BUSINESS FORMS PRINTING. Organizations: BZE RESOURCE (CONTACT/OPERATOR)
Alternative names: UNIFORM INFORMATION SERVICES INC
1 HR MARTINIZING (9646 AUDELIA ROAD in DALLAS, TX)
AIR MINOR (AIRS/AFS) Business SIC classification: DRYCLEANING PLANTS, EXCEPT RUG CLEANING
Housing units lacking complete plumbing facilities: 0.3% Housing units lacking complete kitchen facilities: 1.4%
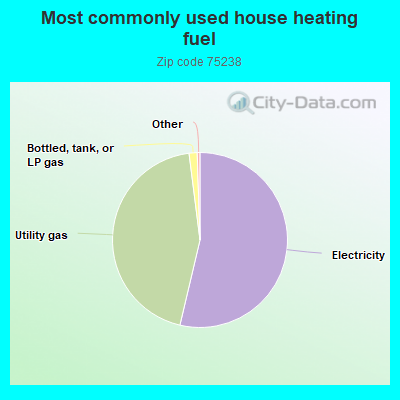
53.7%Electricity
44.3%Utility gas
1.5%Bottled, tank, or LP gas
Population in 1990: 25,855. Population change in the 1990s: +5,481 (+21.2%).
Place of birth for U.S.-born residents:
This state: 17,985
Northeast: 1,185
Midwest: 2,432
South: 3,054
West: 2,103
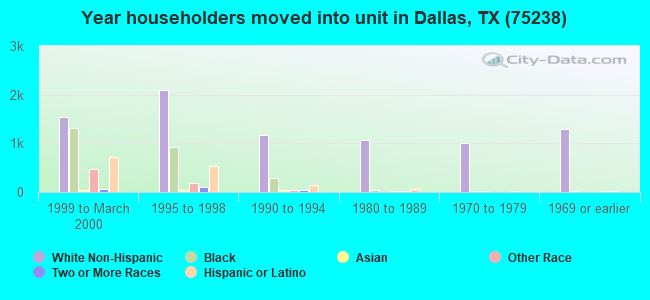
45% of the 75238 zip code residents lived in the same house 5 years ago. Out of people who lived in different houses, 68% lived in this county. Out of people who lived in different counties, 50% lived in Texas.
85% of the 75238 zip code residents lived in the same house 1 year ago. Out of people who lived in different houses, 61% moved from this county. Out of people who lived in different houses, 13% moved from different county within same state. Out of people who lived in different houses, 13% moved from different state. Out of people who lived in different houses, 12% moved from abroad.
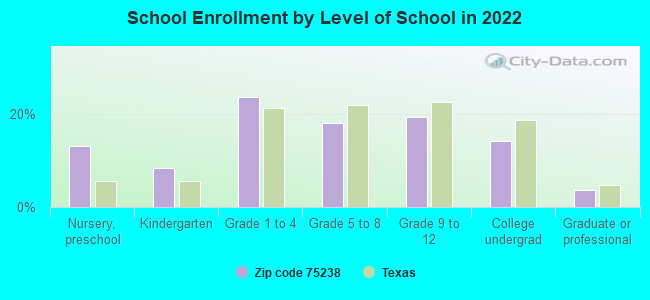
Private vs. public school enrollment:
Students in private schools in grades 1 to 8 (elementary and middle school): 440
Here:
13.6%
Texas:
8.8%
Students in private schools in grades 9 to 12 (high school): 114
Here:
7.7%
Texas:
8.0%
Students in private undergraduate colleges: 68
Here:
6.3%
Texas:
16.2%
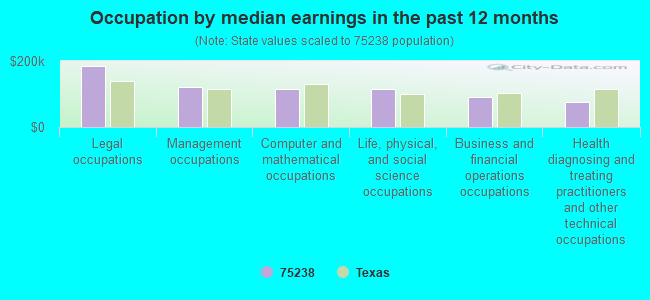
Occupation by median earnings in the past 12 months ($)
183,987Legal occupations
122,446Management occupations
116,259Computer and mathematical occupations
115,700Life, physical, and social science occupations
89,906Business and financial operations occupations
75,416Health diagnosing and treating practitioners and other technical occupations
Companies with biggest federal contracts located in this zip code (DALLAS, TX):
LIFENET COMMUNITY BEHAVIORAL H (10405 E NW HWY STE 100) : $1,353,869 in 34 contractsfrom 1999 to 2006
Contracts for Landscaping/Groundskeeping Services, Custodial Janitorial Services by Department of Veterans Affairs, Army Signed by year:2000: $0; 2001: $0; 2002: $383,829; 2003: $12,558; 2004: $369,736; 2005: $409,004; 2006: $22,742.
Biggest contracts:
$312,024 with Department of Veterans Affairs for Landscaping/Groundskeeping Services. Signed on 2005-10-01. Completion date: 2006-09-30.
$278,034, same as above.Signed on 2004-10-01. Completion date: 2005-09-30.
$269,628, same as above.Signed on 2002-10-15. Completion date: 2003-09-15.
$156,000, same as above.Signed on 1999-10-15. Completion date: 2000-06-15.
LAND O'LAKES, INC (9601 WHITE ROCK TRL) : $325,066 in 2 contractsin 1999
$184,654 with Department of Defense for Food Items For Resale. Signed on 1999-10-31. Completion date: 1999-10-31.
$140,412, same as above.Signed on 1999-11-30. Completion date: 1999-11-30.
ZIMMER-WHITE INCORPORATED (10330 MARKISON RD) : $275,427 in 13 contractsfrom 2001 to 2006
Contracts for Medical and Surgical Instruments, Equipment, and Supplies by Department of Veterans Affairs, Army Signed by year:2000: $0; 2001: $91,838; 2002: $0; 2003: $3,145; 2004: $0; 2005: $142,443; 2006: $38,001.
Biggest contracts:
$92,583 with Department of Veterans Affairs for Medical and Surgical Instruments, Equipment, and Supplies. Signed on 2005-07-01. Completion date: 2005-07-31.
$54,838 with Army for Medical and Surgical Instruments, Equipment, and Supplies. Taking place in OK. Signed on 2001-07-13. Completion date: 2001-07-23.
$49,860 with Department of Veterans Affairs for Medical and Surgical Instruments, Equipment, and Supplies. Signed on 2005-10-01. Completion date: 2006-01-01.
$37,000, same as above.Signed on 2001-03-15. Completion date: 2001-03-15.
SPECTRA MASK INC (10455 MARKISON DRIVE; small business) : $223,177 in 5 contractsfrom 2001 to 2003
Contracts for Maintenance, Repair and Rebuilding of Equipment -- Maintenance and Repair Shop Equipment, Electric Vehicular Lights and Fixtures, Maintenance, Repair and Rebuilding of Equipment -- Communication, Detection, and Coherent Radiation Equipment by Army, Defense Logistics Agency Signed by year:2000: $0; 2001: $138,979; 2002: $86,000; 2003: -$1,802; 2004: $0; 2005: $0; 2006: $0.
Biggest contracts:
$86,000 with Army for Maintenance, Repair and Rebuilding of Equipment -- Maintenance and Repair Shop Equipment. Signed on 2002-05-07. Completion date: 2002-05-31.
$84,500 with Defense Logistics Agency for Electric Vehicular Lights and Fixtures. Signed on 2001-02-12. Completion date: 2001-05-26.
$29,000 with Army for Maintenance, Repair and Rebuilding of Equipment -- Communication, Detection, and Coherent Radiation Equipment. Taking place in AR. Signed on 2001-04-16. Completion date: 2001-04-30.
$25,479, same as above.Signed on 2001-10-11. Completion date: 2001-10-31.
EPC ENGINEERING RESOURCES INC (9862 PLANO RD STE 100; small business) : $215,319 in 14 contractsfrom 2000 to 2005
Contracts for Expert Witness, Other Professional Services by U.S. Army Corps of Engineers - civil program financing only, Army Signed by year:2000: $27,000; 2001: $0; 2002: $0; 2003: $230,443; 2004: -$48,204; 2005: $6,080; 2006: $0.
Biggest contracts:
$51,887 with U.S. Army Corps of Engineers - civil program financing only for Expert Witness. Taking place in AK. Signed on 2003-02-07. Completion date: 2004-01-22.
$50,000, same as above.Signed on 2003-05-22. Completion date: 2003-05-30.
$38,040, same as above.Signed on 2003-04-21. Completion date: 2004-01-22.
$34,050, same as above.Signed on 2003-04-09. Completion date: 2004-01-22.
INTERSTATE WIRE COMPANY INC (10355 SANDEN DR; small business) : $130,429 in 12 contractsfrom 2003 to 2005
Contracts for Wire and Cable, Electrical, Cable, Cord, and Wire Assemblies: Communications Equipment by U.S. Army Corps of Engineers - civil program financing only, Army, Navy Signed by year:2000: $0; 2001: $0; 2002: $0; 2003: $29,097; 2004: $84,572; 2005: $16,760; 2006: $0.
Biggest contracts:
$18,284 with U.S. Army Corps of Engineers - civil program financing only for Wire and Cable, Electrical. Signed on 2003-07-31. Completion date: 2003-08-19.
$16,066, same as above.Signed on 2004-08-16. Completion date: 2004-10-18.
$16,066, same as above.Signed on 2004-08-09. Completion date: 2004-10-01.
$16,066 with Army for Wire and Cable, Electrical. Signed on 2004-08-16. Completion date: 2004-10-18.
TIPPIT, CHARLES (10420 PLANO RD STE 107; small business)
$91,091 with Navy for Safety and Rescue Equipment. Signed on 2002-10-01. Completion date: 2002-07-15.
ALPHA PROCESS SALES, INC (10723 PLANO ROAD; small business)
$78,814 with Army for Hazard-Detecting Instruments and Apparatus. Signed on 2003-03-23. Completion date: 2003-03-21.
TRIPLE B CLEANING INC (10720 MILLER RD STE 212) : $23,800 in 2 contractsfrom 2005 to 2006
$22,100 with Air Force for Maintenance, Repair and Rebuilding of Equipment -- Food Preparation and Serving Equipment. Taking place in LA. Signed on 2005-11-29. Completion date: 2006-09-30.
$1,700, same as above.Signed on 2006-05-11. Completion date: 2006-09-30.
S P EMPIRE INC (10486 BROCKWOOD RD; small business)
$18,250 with Navy for Miscellaneous Printed Matter. Taking place in DC. Signed on 2004-11-18. Completion date: 2004-12-06.
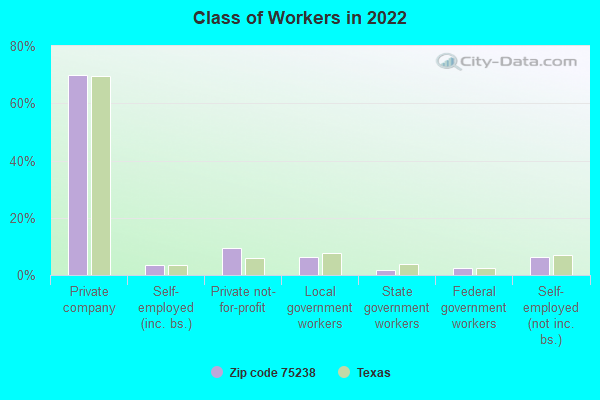
Top industries in this zip code by the number of employees in 2005:
2002 - 2018 National Fire Incident Reporting System (NFIRS) incidents
According to the data from the years 2002 - 2018 the average number of fires per year is 52. The highest number of fire incidents - 168 took place in 2002, and the least - 0 in 2005. The data has a dropping trend.
When looking into fire subcategories, the most reports belonged to: Outside Fires (36.4%), and Other (31.6%).
Fire incident types reported to NFIRS in Zip Code 75238


 Nearest zip codes: 75218, 75231, 75243, 75042, 75041, 75228.


 According to the data from the years 2002 - 2018 the average number of fires per year is 52. The highest number of fire incidents - 168 took place in 2002, and the least - 0 in 2005. The data has a dropping trend.
 When looking into fire subcategories, the most reports belonged to: Outside Fires (36.4%), and Other (31.6%).