Estimated zip code population in 2022: 21,968 Zip code population in 2010: 21,665 Zip code population in 2000: 21,710
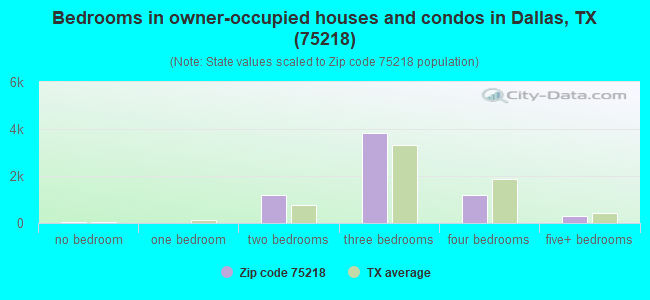
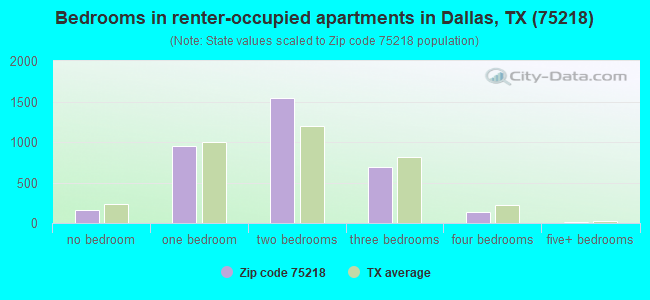
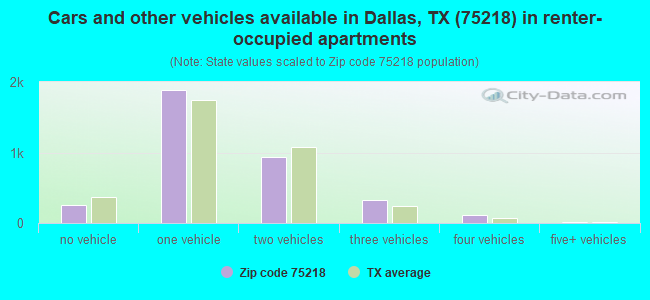
Houses and condos: 10,782 Renter-occupied apartments: 3,527
% of renters here:
35%
State:
38%
March 2022 cost of living index in zip code 75218: 96.6 (near average, U.S. average is 100)
Land area: 7.0 sq. mi. Water area: 0.0 sq. mi.
Population density: 3,144 people per square mile
(average).
OSM Map
General Map
Google Map
MSN Map
OSM Map
General Map
Google Map
MSN Map
OSM Map
General Map
Google Map
MSN Map
OSM Map
General Map
Google Map
MSN Map
Please wait while loading the map...
Real estate property taxes paid for housing units in 2022:
This zip code:
1.6% ($8,307)
Texas:
1.5% ($4,050)
Median real estate property taxes paid for housing units with mortgages in 2022: $9,153 (1.7%) Median real estate property taxes paid for housing units with no mortgage in 2022: $6,013 (1.3%)
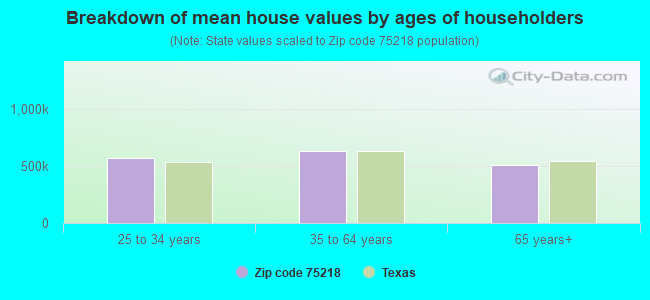
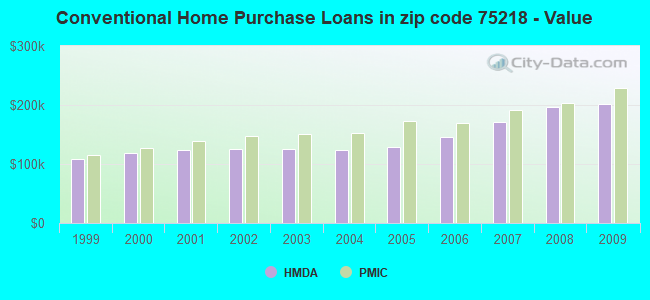
Estimated median house/condo value in 2022: $517,359
75218:
$517,359
Texas:
$275,400
According to our research of Texas and other state lists, there were 24 registered sex offenders living in 75218 zip code as of April 27, 2024. The ratio of all residents to sex offenders in zip code 75218 is 942 to 1. The ratio of registered sex offenders to all residents in this zip code is lower than the state average.
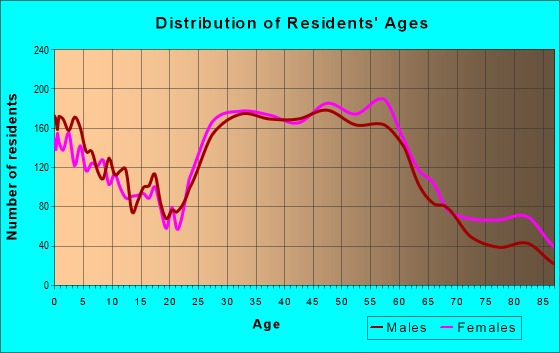
Median resident age:
This zip code:
41.7 years
Texas median age:
35.6 years
Average household size:
This zip code:
2.2 people
Texas:
2.6 people
Averages for the 2020 tax year for zip code 75218, filed in 2021:
Average Adjusted Gross Income (AGI) in 2020: $117,604 (Individual Income Tax Returns)
Here:
$117,604
State:
$77,054
Salary/wage: $96,512 (reported on 79.0% of returns)
Here:
$96,512
State:
$62,766
(% of AGI for various income ranges: 1144.8% for AGIs below $25k, 3655.6% for AGIs $25k-50k, 6393.6% for AGIs $50k-75k, 10075.0% for AGIs $75k-100k, 20022.3% for AGIs $100k-200k, 84462.7% for AGIs over 200k)
Taxable interest for individuals: $2,750 (reported on 35.2% of returns)
This zip code:
$2,750
Texas:
$2,665
(% of AGI for various income ranges: 24.4% for AGIs below $25k, 35.4% for AGIs $25k-50k, 48.3% for AGIs $50k-75k, 102.3% for AGIs $75k-100k, 187.2% for AGIs $100k-200k, 1330.6% for AGIs over 200k)
Ordinary dividends: $8,527 (reported on 30.7% of returns)
Here:
$8,527
State:
$10,044
(% of AGI for various income ranges: 60.6% for AGIs below $25k, 92.1% for AGIs $25k-50k, 177.8% for AGIs $50k-75k, 371.4% for AGIs $75k-100k, 608.3% for AGIs $100k-200k, 3176.2% for AGIs over 200k)
Net capital gain/loss in AGI: +$35,128 (reported on 28.4% of returns)
Here:
+$35,128
State:
+$39,590
(% of AGI for various income ranges: 38.8% for AGIs below $25k, 51.0% for AGIs $25k-50k, 112.8% for AGIs $50k-75k, 284.7% for AGIs $75k-100k, 647.1% for AGIs $100k-200k, 20202.9% for AGIs over 200k)
Profit/loss from business: +$21,346 (reported on 24.8% of returns)
Here:
+$21,346
State:
+$10,888
(% of AGI for various income ranges: 246.5% for AGIs below $25k, 209.9% for AGIs $25k-50k, 395.8% for AGIs $50k-75k, 700.0% for AGIs $75k-100k, 1356.7% for AGIs $100k-200k, 5558.5% for AGIs over 200k)
Taxable individual retirement arrangement distribution: $22,686 (reported on 10.4% of returns)
75218:
$22,686
Texas:
$24,740
(% of AGI for various income ranges: 73.5% for AGIs below $25k, 142.2% for AGIs $25k-50k, 244.7% for AGIs $50k-75k, 463.9% for AGIs $75k-100k, 776.6% for AGIs $100k-200k, 1726.2% for AGIs over 200k)
Self-employed (Keogh) retirement plans: $27,488 (reported on 2.0% of returns)
75218:
$27,488
Texas:
$29,298
(% of AGI for various income ranges: 21.8% for AGIs $25k-50k, 93.1% for AGIs $100k-200k, 989.8% for AGIs over 200k)
Total itemized deductions: $34,413 (reported on 16.3% of returns)
Here:
$34,413
State:
$40,428
(% of AGI for various income ranges: 110.0% for AGIs below $25k, 174.8% for AGIs $25k-50k, 381.9% for AGIs $50k-75k, 746.2% for AGIs $75k-100k, 1455.0% for AGIs $100k-200k, 6629.2% for AGIs over 200k)
Charity contributions: $12,640 (reported on 13.3% of returns)
Here:
$12,640
State:
$18,201
(% of AGI for various income ranges: 8.5% for AGIs below $25k, 25.4% for AGIs $25k-50k, 52.3% for AGIs $50k-75k, 101.6% for AGIs $75k-100k, 297.8% for AGIs $100k-200k, 2769.6% for AGIs over 200k)
Taxes paid: $8,658 (reported on 16.1% of returns)
75218:
$8,658
State:
$7,821
(% of AGI for various income ranges: 25.1% for AGIs below $25k, 39.4% for AGIs $25k-50k, 103.4% for AGIs $50k-75k, 241.2% for AGIs $75k-100k, 446.7% for AGIs $100k-200k, 1396.5% for AGIs over 200k)
Earned income credit: $2,183 (reported on 10.8% of returns)
Here:
$2,183
State:
$2,584
(% of AGI for various income ranges: 97.8% for AGIs below $25k, 52.1% for AGIs $25k-50k)
Percentage of individuals using paid preparers for their 2020 taxes: 90.3%
Here:
90%
State:
92%
(% for various income ranges: 87.0% for AGIs below $25k, 91.1% for AGIs $25k-50k, 90.5% for AGIs $50k-75k, 88.6% for AGIs $75k-100k, 92.3% for AGIs $100k-200k, 93.5% for AGIs over 200k)
Averages for the 2012 tax year for zip code 75218, filed in 2013:
Average Adjusted Gross Income (AGI) in 2012: $78,298 (Individual Income Tax Returns)
Here:
$78,298
State:
$65,384
Salary/wage: $69,135 (reported on 80.6% of returns)
Here:
$69,135
State:
$52,524
(% of AGI for various income ranges: 68.7% for AGIs below $25k, 79.0% for AGIs $25k-50k, 75.8% for AGIs $50k-75k, 75.6% for AGIs $75k-100k, 77.8% for AGIs $100k-200k, 61.3% for AGIs over 200k)
Taxable interest for individuals: $1,998 (reported on 36.1% of returns)
This zip code:
$1,998
Texas:
$2,372
(% of AGI for various income ranges: 1.5% for AGIs below $25k, 0.7% for AGIs $25k-50k, 0.8% for AGIs $50k-75k, 0.9% for AGIs $75k-100k, 0.7% for AGIs $100k-200k, 1.1% for AGIs over 200k)
Ordinary dividends: $6,762 (reported on 27.2% of returns)
Here:
$6,762
State:
$9,721
(% of AGI for various income ranges: 4.2% for AGIs below $25k, 1.7% for AGIs $25k-50k, 1.7% for AGIs $50k-75k, 1.8% for AGIs $75k-100k, 2.0% for AGIs $100k-200k, 3.0% for AGIs over 200k)
Net capital gain/loss in AGI: +$10,797 (reported on 22.9% of returns)
Here:
+$10,797
State:
+$35,319
(% of AGI for various income ranges: 0.4% for AGIs $25k-50k, 0.7% for AGIs $50k-75k, 0.9% for AGIs $75k-100k, 1.5% for AGIs $100k-200k, 7.2% for AGIs over 200k)
Profit/loss from business: +$20,194 (reported on 23.4% of returns)
Here:
+$20,194
State:
+$13,732
(% of AGI for various income ranges: 11.8% for AGIs below $25k, 5.5% for AGIs $25k-50k, 5.8% for AGIs $50k-75k, 4.9% for AGIs $75k-100k, 5.9% for AGIs $100k-200k, 5.9% for AGIs over 200k)
Taxable individual retirement arrangement distribution: $18,037 (reported on 11.0% of returns)
75218:
$18,037
Texas:
$19,511
(% of AGI for various income ranges: 3.9% for AGIs below $25k, 2.8% for AGIs $25k-50k, 3.0% for AGIs $50k-75k, 3.3% for AGIs $75k-100k, 2.8% for AGIs $100k-200k, 1.7% for AGIs over 200k)
Self-employment retirement plans: $21,330 (reported on 1.7% of returns)
75218:
$21,330
Texas:
$23,938
(% of AGI for various income ranges: 0.3% for AGIs $50k-75k, 0.3% for AGIs $100k-200k, 0.9% for AGIs over 200k)
Total itemized deductions: $22,771 (16% of AGI, reported on 37.3% of returns)
Here:
$22,771
State:
$24,724
Here:
16.3% of AGI
State:
15.9% of AGI
(% of AGI for various income ranges: 12.5% for AGIs below $25k, 10.0% for AGIs $25k-50k, 11.6% for AGIs $50k-75k, 12.0% for AGIs $75k-100k, 11.9% for AGIs $100k-200k, 9.5% for AGIs over 200k)
Charity contributions: $4,806 (reported on 30.4% of returns)
Here:
$4,806
State:
$6,808
(% of AGI for various income ranges: 1.2% for AGIs below $25k, 1.0% for AGIs $25k-50k, 1.6% for AGIs $50k-75k, 1.7% for AGIs $75k-100k, 1.8% for AGIs $100k-200k, 2.4% for AGIs over 200k)
Taxes paid: $7,485 (reported on 36.7% of returns)
75218:
$7,485
State:
$6,921
(% of AGI for various income ranges: 3.2% for AGIs below $25k, 2.6% for AGIs $25k-50k, 3.5% for AGIs $50k-75k, 3.8% for AGIs $75k-100k, 4.1% for AGIs $100k-200k, 3.3% for AGIs over 200k)
Earned income credit: $2,144 (reported on 12.8% of returns)
Here:
$2,144
State:
$2,570
(% of AGI for various income ranges: 5.7% for AGIs below $25k, 0.7% for AGIs $25k-50k)
Percentage of individuals using paid preparers for their 2012 taxes: 49.5%
Here:
49%
State:
51%
(% for various income ranges: 50.3% for AGIs below $25k, 45.0% for AGIs $25k-50k, 45.9% for AGIs $50k-75k, 47.3% for AGIs $75k-100k, 51.4% for AGIs $100k-200k, 67.9% for AGIs over 200k)
Averages for the 2004 tax year for zip code 75218, filed in 2005:
Average Adjusted Gross Income (AGI) in 2004: $60,441 (Individual Income Tax Returns)
Here:
$60,441
State:
$47,881
Salary/wage: $53,747 (reported on 79.2% of returns)
Here:
$53,747
State:
$41,947
(% of AGI for various income ranges: 108.1% for AGIs below $10k, 70.1% for AGIs $10k-25k, 79.8% for AGIs $25k-50k, 76.8% for AGIs $50k-75k, 77.4% for AGIs $75k-100k, 63.3% for AGIs over 100k)
Taxable interest for individuals: $2,101 (reported on 47.6% of returns)
This zip code:
$2,101
Texas:
$2,255
(% of AGI for various income ranges: 8.9% for AGIs below $10k, 3.3% for AGIs $10k-25k, 1.7% for AGIs $25k-50k, 1.6% for AGIs $50k-75k, 1.6% for AGIs $75k-100k, 1.3% for AGIs over 100k)
Taxable dividends: $3,179 (reported on 30.9% of returns)
Here:
$3,179
State:
$4,261
(% of AGI for various income ranges: 9.3% for AGIs below $10k, 2.9% for AGIs $10k-25k, 1.4% for AGIs $25k-50k, 1.5% for AGIs $50k-75k, 1.4% for AGIs $75k-100k, 1.5% for AGIs over 100k)
Net capital gain/loss: +$7,035 (reported on 25.8% of returns)
Here:
+$7,035
State:
+$16,110
(% of AGI for various income ranges: -3.9% for AGIs below $10k, -0.3% for AGIs $10k-25k, 0.4% for AGIs $25k-50k, 0.9% for AGIs $50k-75k, 1.8% for AGIs $75k-100k, 5.2% for AGIs over 100k)
Profit/loss from business: +$16,822 (reported on 22.4% of returns)
Here:
+$16,822
State:
+$11,013
(% of AGI for various income ranges: 14.0% for AGIs below $10k, 9.5% for AGIs $10k-25k, 5.0% for AGIs $25k-50k, 5.1% for AGIs $50k-75k, 5.5% for AGIs $75k-100k, 6.6% for AGIs over 100k)
IRA payment deduction: $3,022 (reported on 3.0% of returns)
75218:
$3,022
Texas:
$3,120
(% of AGI for various income ranges: 0.5% for AGIs below $10k, 0.3% for AGIs $10k-25k, 0.2% for AGIs $25k-50k, 0.2% for AGIs $50k-75k, 0.2% for AGIs $75k-100k, 0.1% for AGIs over 100k)
Self-employed pension: $15,412 (reported on 2.0% of returns)
Here:
$15,412
Texas:
$16,401
(% of AGI for various income ranges: 0.8% for AGIs below $10k, 0.2% for AGIs $25k-50k, 0.2% for AGIs $50k-75k, 0.3% for AGIs $75k-100k, 0.8% for AGIs over 100k)
Total itemized deductions: $17,814 (18% of AGI, reported on 38.3% of returns)
Here:
$17,814
State:
$19,631
Here:
17.5% of AGI
State:
18.9% of AGI
(% of AGI for various income ranges: 30.3% for AGIs below $10k, 10.9% for AGIs $10k-25k, 11.1% for AGIs $25k-50k, 13.6% for AGIs $50k-75k, 13.5% for AGIs $75k-100k, 9.9% for AGIs over 100k)
Charity contributions deductions: $3,679 (3% of AGI, reported on 32.7% of returns)
Here:
$3,679
State:
$4,753
Here:
3.4% of AGI
State:
4.2% of AGI
(% of AGI for various income ranges: 1.6% for AGIs below $10k, 1.2% for AGIs $10k-25k, 1.5% for AGIs $25k-50k, 1.9% for AGIs $50k-75k, 2.1% for AGIs $75k-100k, 2.3% for AGIs over 100k)
Total tax: $11,349 (reported on 80.9% of returns)
75218:
$11,349
State:
$9,058
(% of AGI for various income ranges: 5.4% for AGIs below $10k, 4.8% for AGIs $10k-25k, 8.5% for AGIs $25k-50k, 11.8% for AGIs $50k-75k, 13.2% for AGIs $75k-100k, 20.2% for AGIs over 100k)
Earned income credit: $1,679 (reported on 12.3% of returns)
Here:
$1,679
State:
$2,024
Percentage of individuals using paid preparers for their 2004 taxes: 53.2%
Here:
53%
State:
57%
(% for various income ranges: 51.7% for AGIs below $10k, 58.8% for AGIs $10k-25k, 48.8% for AGIs $25k-50k, 49.3% for AGIs $50k-75k, 52.6% for AGIs $75k-100k, 58.9% for AGIs over 100k)
Likely homosexual households (counted as self-reported same-sex unmarried-partner households)
Lesbian couples: 0.5% of all households
Gay men: 0.0% of all households
Household received Food Stamps/SNAP in the past 12 months: 371 Household did not receive Food Stamps/SNAP in the past 12 months: 9,670
Women who had a birth in the past 12 months: 429 (437 now married, 0 unmarried) Women who did not have a birth in the past 12 months: 4,432 (2,356 now married, 2,063 unmarried)
Housing units in zip code 75218 with a mortgage: 4,355 (278 second mortgage, 256 both second mortgage and home equity loan) Houses without a mortgage: 18
Median monthly owner costs for units with a mortgage: $2,696 Median monthly owner costs for units without a mortgage: $962
Residents with income below the poverty level in 2022:
This zip code:
5.6%
Whole state:
14.0%
Residents with income below 50% of the poverty level in 2022:
This zip code:
2.3%
Whole state:
7.4%
Median number of rooms in houses and condos:
Here:
6.3
State:
6.3
Median number of rooms in apartments:
Here:
4.2
State:
4.0
Notable locations in this zip code not listed on our city pages
Notable locations in zip code 75218: White Rock Marketplace (A), Dallas Fire - Rescue Station 31 (B), Dallas Arboretum and Botanical Garden (C), DeGolyer Estate (D). Display/hide their locations on the map
Churches in zip code 75218 include: Saint Bernard Church (A), Saint John Church (B), Garland Hispanic Seventh Day Adventist Church (C), El Divino Salvado Presbyterian Church (D), Casa Linda Church (E), Saint Johns Church (F), Saint Bernards Church (G), Church of Christ Easton Road (H), First Assembly of God in Dallas Church (I). Display/hide their locations on the map
Parks in zip code 75218 include: Lake Highland Park (1), Samuel Garland Park (2), Norbuck Park (3), White Rock East Park (4), John C Albers Athletic Center (5), Lochwood Park (6), Casa Linda Park (7), Bel - Aire Park (8). Display/hide their locations on the map
Tourist attraction (not listed on the city page) : Amf Bowling Centers - Amf Jupiter Lanes (Amusement & Theme Parks; 11336 Jupiter Road).
3,254 married couples with children.
736 single-parent households (282 men, 454 women).
76.4% of residents of 75218 zip code speak English at home.
21.9% of residents speak Spanish at home (71% very well, 15% well, 14% not well).
0.4% of residents speak other Indo-European language at home (100% very well).
0.3% of residents speak Asian or Pacific Island language at home (100% very well).
0.7% of residents speak other language at home (70% very well, 6% well, 24% not well).
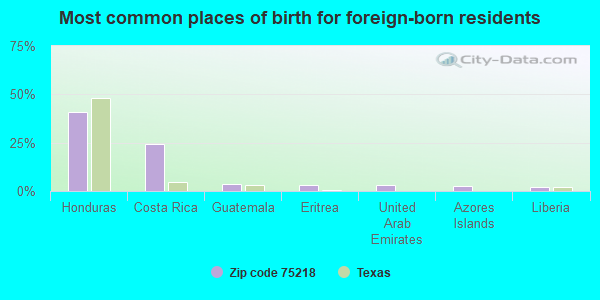
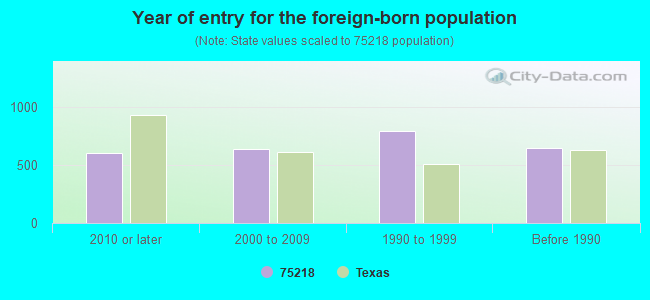
Foreign born population: 2,589 (11.8%) (40.7% of them are naturalized citizens)
Facilities with environmental interests located in this zip code:
ALEX SANGER EL (8410 SAN LEANDRO DR in DALLAS, TX)
(National Center for Education Statistics) - STATE ID-057905206 Organizations: DALLAS ISD (SCHOOL DISTRICT)
$1.45 TOTAL VALUE CLEANERS (9540 GARLAND ROAD #401 in DALLAS, TX)
AIR MINOR (AIRS/AFS) Business SIC classification: DRYCLEANING PLANTS, EXCEPT RUG CLEANING
B.P. DRY CLEANERS (11411 EAST NORTHWEST HWY, #103 in GARLAND, TX)
AIR MINOR (AIRS/AFS) Business SIC classification: DRYCLEANING PLANTS, EXCEPT RUG CLEANING
Housing units lacking complete plumbing facilities: 0.9% Housing units lacking complete kitchen facilities: 0.8%
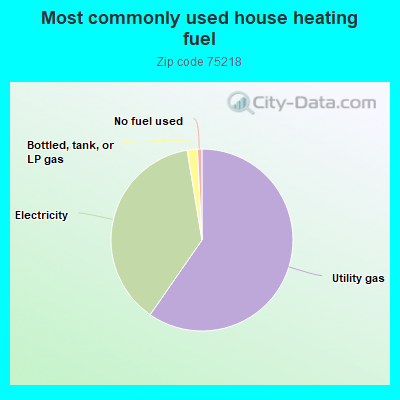
59.6%Utility gas
37.7%Electricity
1.8%Bottled, tank, or LP gas
0.8%No fuel used
Population in 1990: 22,646.
Place of birth for U.S.-born residents:
This state: 12,404
Northeast: 1,006
Midwest: 2,226
South: 2,122
West: 1,458
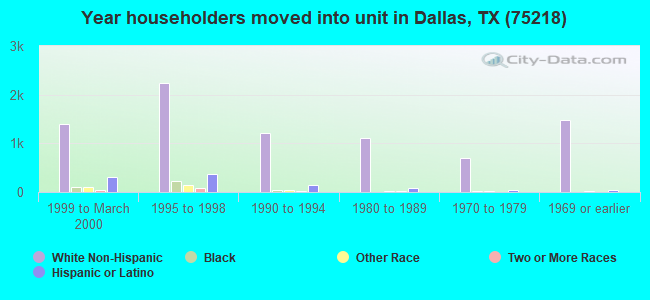
54% of the 75218 zip code residents lived in the same house 5 years ago. Out of people who lived in different houses, 71% lived in this county. Out of people who lived in different counties, 50% lived in Texas.
87% of the 75218 zip code residents lived in the same house 1 year ago. Out of people who lived in different houses, 80% moved from this county. Out of people who lived in different houses, 6% moved from different county within same state. Out of people who lived in different houses, 9% moved from different state. Out of people who lived in different houses, 1% moved from abroad.
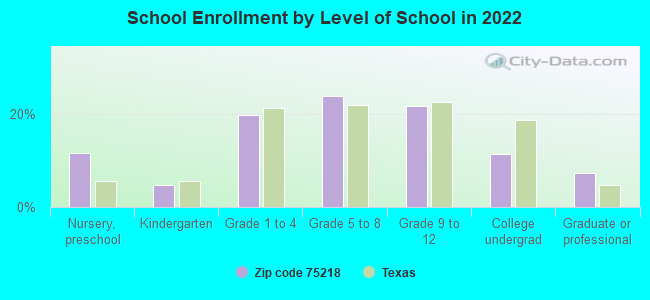
Private vs. public school enrollment:
Students in private schools in grades 1 to 8 (elementary and middle school): 456
Here:
26.3%
Texas:
8.8%
Students in private schools in grades 9 to 12 (high school): 270
Here:
31.3%
Texas:
8.0%
Students in private undergraduate colleges: 125
Here:
28.3%
Texas:
16.2%
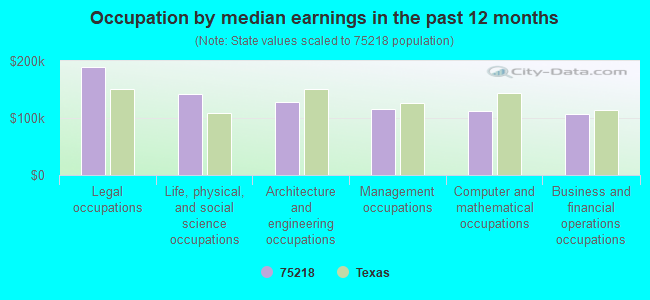
Occupation by median earnings in the past 12 months ($)
188,616Legal occupations
142,893Life, physical, and social science occupations
127,635Architecture and engineering occupations
115,300Management occupations
112,350Computer and mathematical occupations
106,302Business and financial operations occupations
Companies with federal contracts located in this zip code (DALLAS, TX):
SOUTHWESTERN BELL TELEPHONE CO (1130 BEACHVIEW ST) : $964,411 in 5 contractsfrom 1999 to 2000
Contracts for Telephone and/or Communications Services (includes Telegraph, Telex, and Cablevision Services), Other Photographic, Mapping, Printing, and Publication Services by Army, Federal Technology Service Signed by year:2000: $50,742; 2001: $0; 2002: $0; 2003: $0; 2004: $0; 2005: $0; 2006: $0.
Biggest contracts:
$537,879 with Army for Telephone and/or Communications Services (includes Telegraph, Telex, and Cablevision Services). Taking place in OK. Signed on 1999-11-17. Completion date: 1999-11-17.
$200,000 with Federal Technology Service for Other Photographic, Mapping, Printing, and Publication Services. Taking place in DC. Signed on 1999-10-15. Completion date: 2000-09-15.
$93,550 with Army for Telephone and/or Communications Services (includes Telegraph, Telex, and Cablevision Services). Taking place in OK. Signed on 1999-11-19. Completion date: 1999-11-19.
$82,240 with Army for Telephone and/or Communications Services (includes Telegraph, Telex, and Cablevision Services). Taking place in IL. Signed on 1999-11-18. Completion date: 1999-11-18.
BETSY ROSS FLAG GIRLS INC (11005 GARLAND RD; small business) : $62,750 in 9 contractsfrom 2001 to 2006
Contracts for Flags and Pennants, Notions and Apparel Findings, Maintenance, Repair or Alteration of Real Property -- Miscellaneous Buildings, Office Supplies by Immigration and Naturalization Service, Army, Navy, Drug Enforcement Administration, and others Signed by year:2000: $0; 2001: $29,000; 2002: $8,429; 2003: $3,732; 2004: $0; 2005: $18,426; 2006: $3,163.
Biggest contracts:
$29,000 with Immigration and Naturalization Service for Flags and Pennants. Signed on 2001-09-15. Completion date: 2001-11-15.
$9,443 with Army for Notions and Apparel Findings. Signed on 2005-11-28. Completion date: 2005-12-30.
$8,429 with Navy for Maintenance, Repair or Alteration of Real Property -- Miscellaneous Buildings. Taking place in TN. Signed on 2002-06-17. Completion date: 2002-09-15.
$5,189 with Army for Flags and Pennants. Signed on 2005-04-07. Completion date: 2005-04-08.
WILSON, DAVID C (989 N RUSTIC CR; small business) : $25,488 in 7 contractsfrom 2004 to 2005
Contracts for Reserve Training (Military) by Army Signed by year:2000: $0; 2001: $0; 2002: $0; 2003: $0; 2004: $24,588; 2005: $900; 2006: $0.
Biggest contracts:
$13,200 with Army for Reserve Training (Military). Signed on 2004-10-14. Completion date: 2004-11-30.
$5,100, same as above.Signed on 2004-08-09. Completion date: 2004-08-17.
$3,900, same as above.Signed on 2005-01-18. Completion date: 2004-11-30.
$3,370, same as above.Signed on 2004-06-22. Completion date: 2004-06-26.
BUSES BY BILL, INC (1336 CENTERVILLE RD; small business) : $17,355 in 2 contractsin 2006
$17,550 with Army for Other Education and Training Services. Signed on 2006-02-28. Completion date: 2006-03-18.
-$195, same as above.Signed on 2006-04-12. Completion date: 2006-04-13.
Top industries in this zip code by the number of employees in 2005:
Health Care and Social Assistance: General Medical and Surgical Hospitals (over 1000 employees: 1 establishment)
2002 - 2018 National Fire Incident Reporting System (NFIRS) incidents
According to the data from the years 2002 - 2018 the average number of fire incidents per year is 39. The highest number of reported fire incidents - 115 took place in 2003, and the least - 0 in 2005. The data has a decreasing trend.
When looking into fire subcategories, the most reports belonged to: Outside Fires (48.5%), and Mobile Property/Vehicle Fires (21.8%).
Fire incident types reported to NFIRS in Zip Code 75218


 Nearest zip codes: 75228, 75238, 75214, 75231, 75041, 75223.
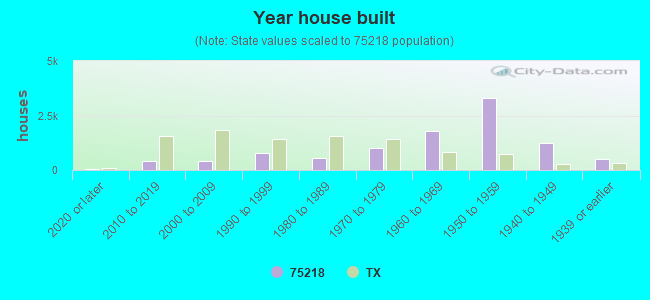


 According to the data from the years 2002 - 2018 the average number of fire incidents per year is 39. The highest number of reported fire incidents - 115 took place in 2003, and the least - 0 in 2005. The data has a decreasing trend.
 When looking into fire subcategories, the most reports belonged to: Outside Fires (48.5%), and Mobile Property/Vehicle Fires (21.8%).