Estimated zip code population in 2022: 40,210 Zip code population in 2010: 37,052 Zip code population in 2000: 52,329
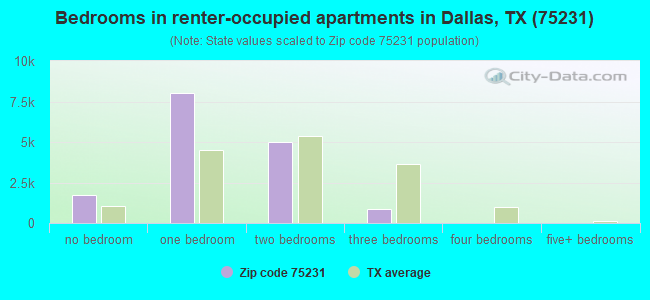
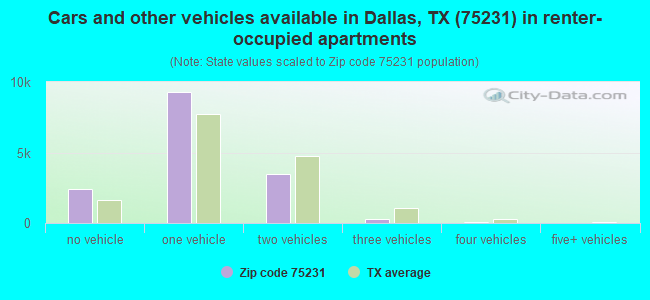
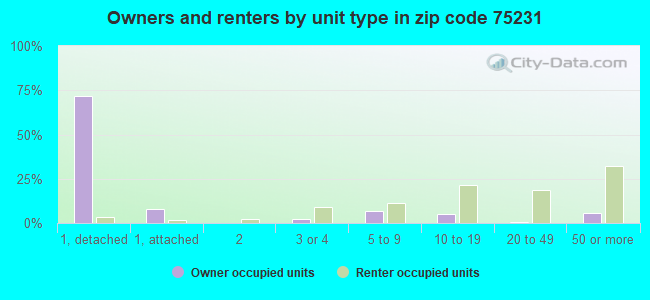
Houses and condos: 22,332 Renter-occupied apartments: 15,506
% of renters here:
83%
State:
38%
March 2022 cost of living index in zip code 75231: 101.2 (near average, U.S. average is 100)
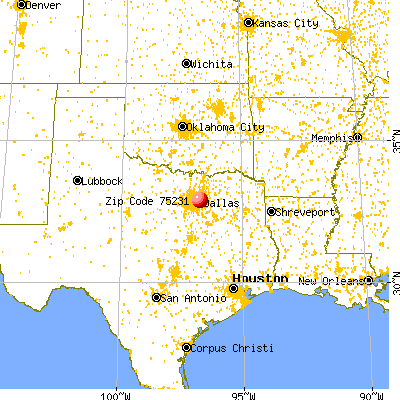
Land area: 5.6 sq. mi. Water area: 0.0 sq. mi.
Population density: 7,135 people per square mile
(high).
OSM Map
General Map
Google Map
MSN Map
OSM Map
General Map
Google Map
MSN Map
OSM Map
General Map
Google Map
MSN Map
OSM Map
General Map
Google Map
MSN Map
Please wait while loading the map...
Real estate property taxes paid for housing units in 2022:
This zip code:
1.5% ($7,509)
Texas:
1.5% ($4,050)
Median real estate property taxes paid for housing units with mortgages in 2022: $9,191 (1.6%) Median real estate property taxes paid for housing units with no mortgage in 2022: $6,358 (1.3%)
Estimated median house/condo value in 2022: $515,276
75231:
$515,276
Texas:
$275,400
According to our research of Texas and other state lists, there were 49 registered sex offenders living in 75231 zip code as of April 27, 2024. The ratio of all residents to sex offenders in zip code 75231 is 823 to 1. The ratio of registered sex offenders to all residents in this zip code is lower than the state average.
Median resident age:
This zip code:
32.1 years
Texas median age:
35.6 years
Average household size:
This zip code:
2.1 people
Texas:
2.6 people
Averages for the 2020 tax year for zip code 75231, filed in 2021:
Average Adjusted Gross Income (AGI) in 2020: $67,446 (Individual Income Tax Returns)
Here:
$67,446
State:
$77,054
Salary/wage: $55,016 (reported on 85.6% of returns)
Here:
$55,016
State:
$62,766
(% of AGI for various income ranges: 1404.4% for AGIs below $25k, 3935.3% for AGIs $25k-50k, 6916.3% for AGIs $50k-75k, 10628.3% for AGIs $75k-100k, 18728.1% for AGIs $100k-200k, 81748.6% for AGIs over 200k)
Taxable interest for individuals: $4,461 (reported on 17.0% of returns)
This zip code:
$4,461
Texas:
$2,665
(% of AGI for various income ranges: 3.0% for AGIs below $25k, 7.6% for AGIs $25k-50k, 30.4% for AGIs $50k-75k, 77.2% for AGIs $75k-100k, 191.2% for AGIs $100k-200k, 3033.6% for AGIs over 200k)
Ordinary dividends: $12,414 (reported on 14.7% of returns)
Here:
$12,414
State:
$10,044
(% of AGI for various income ranges: 11.4% for AGIs below $25k, 23.5% for AGIs $25k-50k, 100.4% for AGIs $50k-75k, 294.1% for AGIs $75k-100k, 957.6% for AGIs $100k-200k, 5889.4% for AGIs over 200k)
Net capital gain/loss in AGI: +$39,483 (reported on 14.8% of returns)
Here:
+$39,483
State:
+$39,590
(% of AGI for various income ranges: 3.7% for AGIs below $25k, 11.3% for AGIs $25k-50k, 74.8% for AGIs $50k-75k, 293.7% for AGIs $75k-100k, 840.0% for AGIs $100k-200k, 26490.0% for AGIs over 200k)
Profit/loss from business: +$11,060 (reported on 24.1% of returns)
Here:
+$11,060
State:
+$10,888
(% of AGI for various income ranges: 105.6% for AGIs below $25k, 117.7% for AGIs $25k-50k, 160.5% for AGIs $50k-75k, 350.9% for AGIs $75k-100k, 1194.4% for AGIs $100k-200k, 6775.8% for AGIs over 200k)
Taxable individual retirement arrangement distribution: $27,293 (reported on 4.5% of returns)
75231:
$27,293
Texas:
$24,740
(% of AGI for various income ranges: 12.9% for AGIs below $25k, 22.5% for AGIs $25k-50k, 105.8% for AGIs $50k-75k, 348.3% for AGIs $75k-100k, 1197.9% for AGIs $100k-200k, 2390.3% for AGIs over 200k)
Self-employed (Keogh) retirement plans: $33,636 (reported on 0.6% of returns)
75231:
$33,636
Texas:
$29,298
(% of AGI for various income ranges: 61.5% for AGIs $100k-200k, 911.7% for AGIs over 200k)
Total itemized deductions: $41,596 (reported on 7.5% of returns)
Here:
$41,596
State:
$40,428
(% of AGI for various income ranges: 32.6% for AGIs below $25k, 89.6% for AGIs $25k-50k, 252.1% for AGIs $50k-75k, 508.0% for AGIs $75k-100k, 1590.4% for AGIs $100k-200k, 9061.9% for AGIs over 200k)
Charity contributions: $16,122 (reported on 6.4% of returns)
Here:
$16,122
State:
$18,201
(% of AGI for various income ranges: 2.8% for AGIs below $25k, 20.1% for AGIs $25k-50k, 54.0% for AGIs $50k-75k, 109.1% for AGIs $75k-100k, 429.9% for AGIs $100k-200k, 3585.3% for AGIs over 200k)
Taxes paid: $8,169 (reported on 7.4% of returns)
75231:
$8,169
State:
$7,821
(% of AGI for various income ranges: 5.7% for AGIs below $25k, 18.0% for AGIs $25k-50k, 49.3% for AGIs $50k-75k, 142.2% for AGIs $75k-100k, 412.6% for AGIs $100k-200k, 1486.1% for AGIs over 200k)
Earned income credit: $2,434 (reported on 21.9% of returns)
Here:
$2,434
State:
$2,584
(% of AGI for various income ranges: 120.9% for AGIs below $25k, 73.0% for AGIs $25k-50k, 1.6% for AGIs $50k-75k)
Percentage of individuals using paid preparers for their 2020 taxes: 90.5%
Here:
90%
State:
92%
(% for various income ranges: 88.8% for AGIs below $25k, 90.9% for AGIs $25k-50k, 92.5% for AGIs $50k-75k, 91.7% for AGIs $75k-100k, 90.7% for AGIs $100k-200k, 93.0% for AGIs over 200k)
Averages for the 2012 tax year for zip code 75231, filed in 2013:
Average Adjusted Gross Income (AGI) in 2012: $54,074 (Individual Income Tax Returns)
Here:
$54,074
State:
$65,384
Salary/wage: $41,795 (reported on 87.2% of returns)
Here:
$41,795
State:
$52,524
(% of AGI for various income ranges: 87.2% for AGIs below $25k, 90.6% for AGIs $25k-50k, 78.8% for AGIs $50k-75k, 67.6% for AGIs $75k-100k, 71.5% for AGIs $100k-200k, 48.4% for AGIs over 200k)
Taxable interest for individuals: $3,318 (reported on 17.1% of returns)
This zip code:
$3,318
Texas:
$2,372
(% of AGI for various income ranges: 0.5% for AGIs below $25k, 0.3% for AGIs $25k-50k, 0.6% for AGIs $50k-75k, 1.0% for AGIs $75k-100k, 0.9% for AGIs $100k-200k, 1.7% for AGIs over 200k)
Ordinary dividends: $11,587 (reported on 13.7% of returns)
Here:
$11,587
State:
$9,721
(% of AGI for various income ranges: 1.2% for AGIs below $25k, 1.3% for AGIs $25k-50k, 2.4% for AGIs $50k-75k, 3.5% for AGIs $75k-100k, 3.3% for AGIs $100k-200k, 4.0% for AGIs over 200k)
Net capital gain/loss in AGI: +$25,729 (reported on 11.9% of returns)
Here:
+$25,729
State:
+$35,319
(% of AGI for various income ranges: 0.5% for AGIs $50k-75k, 1.3% for AGIs $75k-100k, 2.0% for AGIs $100k-200k, 12.6% for AGIs over 200k)
Profit/loss from business: +$15,092 (reported on 19.8% of returns)
Here:
+$15,092
State:
+$13,732
(% of AGI for various income ranges: 7.9% for AGIs below $25k, 2.1% for AGIs $25k-50k, 4.6% for AGIs $50k-75k, 6.8% for AGIs $75k-100k, 6.6% for AGIs $100k-200k, 5.6% for AGIs over 200k)
Taxable individual retirement arrangement distribution: $21,282 (reported on 5.3% of returns)
75231:
$21,282
Texas:
$19,511
(% of AGI for various income ranges: 0.8% for AGIs below $25k, 1.2% for AGIs $25k-50k, 2.9% for AGIs $50k-75k, 4.1% for AGIs $75k-100k, 3.9% for AGIs $100k-200k, 1.8% for AGIs over 200k)
Self-employment retirement plans: $29,600 (reported on 0.9% of returns)
75231:
$29,600
Texas:
$23,938
(% of AGI for various income ranges: 0.2% for AGIs $25k-50k, 0.4% for AGIs $100k-200k, 1.0% for AGIs over 200k)
Total itemized deductions: $29,913 (16% of AGI, reported on 17.0% of returns)
Here:
$29,913
State:
$24,724
Here:
16.3% of AGI
State:
15.9% of AGI
(% of AGI for various income ranges: 3.5% for AGIs below $25k, 5.8% for AGIs $25k-50k, 10.9% for AGIs $50k-75k, 12.9% for AGIs $75k-100k, 12.5% for AGIs $100k-200k, 10.8% for AGIs over 200k)
Charity contributions: $8,443 (reported on 14.0% of returns)
Here:
$8,443
State:
$6,808
(% of AGI for various income ranges: 0.3% for AGIs below $25k, 0.8% for AGIs $25k-50k, 1.9% for AGIs $50k-75k, 2.2% for AGIs $75k-100k, 2.3% for AGIs $100k-200k, 3.4% for AGIs over 200k)
Taxes paid: $9,020 (reported on 16.4% of returns)
75231:
$9,020
State:
$6,921
(% of AGI for various income ranges: 0.9% for AGIs below $25k, 1.2% for AGIs $25k-50k, 2.5% for AGIs $50k-75k, 3.5% for AGIs $75k-100k, 4.6% for AGIs $100k-200k, 3.2% for AGIs over 200k)
Earned income credit: $2,708 (reported on 29.6% of returns)
Here:
$2,708
State:
$2,570
(% of AGI for various income ranges: 9.1% for AGIs below $25k, 1.3% for AGIs $25k-50k)
Percentage of individuals using paid preparers for their 2012 taxes: 61.7%
Here:
62%
State:
51%
(% for various income ranges: 65.8% for AGIs below $25k, 57.3% for AGIs $25k-50k, 52.0% for AGIs $50k-75k, 52.8% for AGIs $75k-100k, 54.6% for AGIs $100k-200k, 66.2% for AGIs over 200k)
Averages for the 2004 tax year for zip code 75231, filed in 2005:
Average Adjusted Gross Income (AGI) in 2004: $49,054 (Individual Income Tax Returns)
Here:
$49,054
State:
$47,881
Salary/wage: $37,167 (reported on 88.4% of returns)
Here:
$37,167
State:
$41,947
(% of AGI for various income ranges: 130.4% for AGIs below $10k, 91.5% for AGIs $10k-25k, 92.2% for AGIs $25k-50k, 77.9% for AGIs $50k-75k, 69.9% for AGIs $75k-100k, 50.2% for AGIs over 100k)
Taxable interest for individuals: $3,560 (reported on 23.3% of returns)
This zip code:
$3,560
Texas:
$2,255
(% of AGI for various income ranges: 3.5% for AGIs below $10k, 0.9% for AGIs $10k-25k, 0.9% for AGIs $25k-50k, 1.9% for AGIs $50k-75k, 1.9% for AGIs $75k-100k, 2.0% for AGIs over 100k)
Taxable dividends: $7,017 (reported on 15.4% of returns)
Here:
$7,017
State:
$4,261
(% of AGI for various income ranges: 4.2% for AGIs below $10k, 0.8% for AGIs $10k-25k, 1.1% for AGIs $25k-50k, 2.5% for AGIs $50k-75k, 2.2% for AGIs $75k-100k, 2.8% for AGIs over 100k)
Net capital gain/loss: +$26,390 (reported on 13.1% of returns)
Here:
+$26,390
State:
+$16,110
(% of AGI for various income ranges: -0.7% for AGIs below $10k, 0.3% for AGIs $10k-25k, 0.2% for AGIs $25k-50k, 0.4% for AGIs $50k-75k, 1.3% for AGIs $75k-100k, 12.3% for AGIs over 100k)
Profit/loss from business: +$15,848 (reported on 15.0% of returns)
Here:
+$15,848
State:
+$11,013
(% of AGI for various income ranges: 19.5% for AGIs below $10k, 3.4% for AGIs $10k-25k, 1.0% for AGIs $25k-50k, 5.0% for AGIs $50k-75k, 6.4% for AGIs $75k-100k, 5.8% for AGIs over 100k)
IRA payment deduction: $3,064 (reported on 1.6% of returns)
75231:
$3,064
Texas:
$3,120
(% of AGI for various income ranges: 0.1% for AGIs $10k-25k, 0.1% for AGIs $25k-50k, 0.2% for AGIs $50k-75k, 0.3% for AGIs $75k-100k, 0.1% for AGIs over 100k)
Self-employed pension: $22,389 (reported on 1.1% of returns)
Here:
$22,389
Texas:
$16,401
(% of AGI for various income ranges: 0.3% for AGIs $50k-75k, 0.6% for AGIs $75k-100k, 0.8% for AGIs over 100k)
Total itemized deductions: $23,054 (15% of AGI, reported on 17.7% of returns)
Here:
$23,054
State:
$19,631
Here:
14.8% of AGI
State:
18.9% of AGI
(% of AGI for various income ranges: 10.4% for AGIs below $10k, 3.8% for AGIs $10k-25k, 6.8% for AGIs $25k-50k, 12.9% for AGIs $50k-75k, 15.9% for AGIs $75k-100k, 8.5% for AGIs over 100k)
Charity contributions deductions: $7,432 (4% of AGI, reported on 15.7% of returns)
Here:
$7,432
State:
$4,753
Here:
4.4% of AGI
State:
4.2% of AGI
(% of AGI for various income ranges: 0.4% for AGIs below $10k, 0.6% for AGIs $10k-25k, 1.1% for AGIs $25k-50k, 2.4% for AGIs $50k-75k, 2.7% for AGIs $75k-100k, 3.2% for AGIs over 100k)
Total tax: $13,881 (reported on 58.7% of returns)
75231:
$13,881
State:
$9,058
(% of AGI for various income ranges: 4.1% for AGIs below $10k, 2.8% for AGIs $10k-25k, 6.3% for AGIs $25k-50k, 11.9% for AGIs $50k-75k, 13.2% for AGIs $75k-100k, 24.2% for AGIs over 100k)
Earned income credit: $2,015 (reported on 30.9% of returns)
Here:
$2,015
State:
$2,024
Percentage of individuals using paid preparers for their 2004 taxes: 64.0%
Here:
64%
State:
57%
(% for various income ranges: 62.3% for AGIs below $10k, 72.0% for AGIs $10k-25k, 58.0% for AGIs $25k-50k, 50.4% for AGIs $50k-75k, 52.5% for AGIs $75k-100k, 63.1% for AGIs over 100k)
Likely homosexual households (counted as self-reported same-sex unmarried-partner households)
Lesbian couples: 0.1% of all households
Gay men: 0.2% of all households
Household received Food Stamps/SNAP in the past 12 months: 2,147 Household did not receive Food Stamps/SNAP in the past 12 months: 16,556
Women who had a birth in the past 12 months: 522 (394 now married, 129 unmarried) Women who did not have a birth in the past 12 months: 10,213 (3,694 now married, 6,544 unmarried)
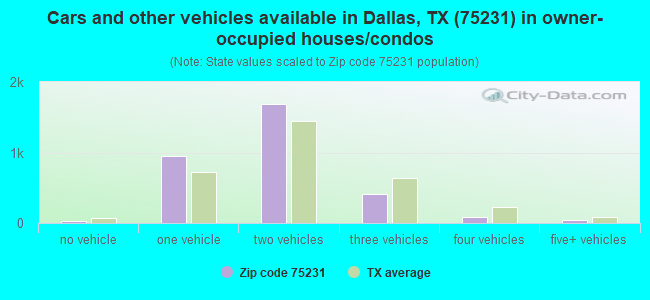
Housing units in zip code 75231 with a mortgage: 1,572 (87 second mortgage, 58 both second mortgage and home equity loan) Houses without a mortgage: 6
Median monthly owner costs for units with a mortgage: $2,662 Median monthly owner costs for units without a mortgage: $1,045
Residents with income below the poverty level in 2022:
This zip code:
18.1%
Whole state:
14.0%
Residents with income below 50% of the poverty level in 2022:
This zip code:
11.5%
Whole state:
7.4%
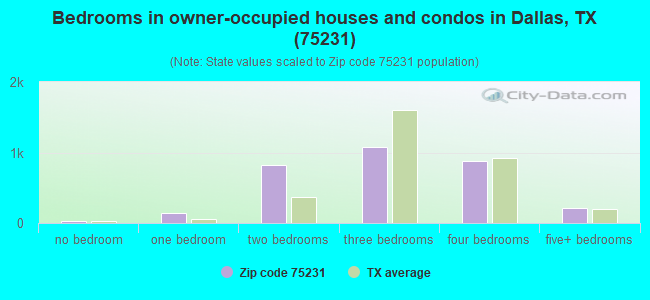
Median number of rooms in houses and condos:
Here:
6.9
State:
6.3
Median number of rooms in apartments:
Here:
3.5
State:
4.0
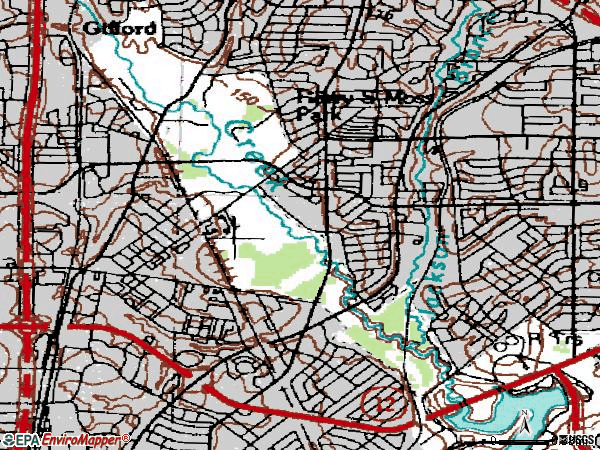
Notable locations in this zip code not listed on our city pages
Notable locations in zip code 75231: Glen Lakes Country Club (A), Meadows Rehabilitation Center (B), Dallas Fire - Rescue Station 37 (C), Reynolds Childrens Home (D). Display/hide their locations on the map
Churches in zip code 75231 include: Vickery Baptist Church (A), North Dallas Community Assembly of God Church (B), Evangelistic Missonary Baptist Church (C), Forest Meadow Baptist Church (D), Gaston Oaks Baptist Church (E), Bethel Flora Church (F), Iranian Baptist Church of Dallas (G), Town North Bible Church (H). Display/hide their locations on the map
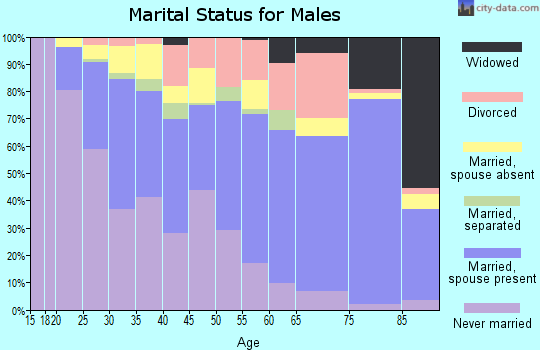
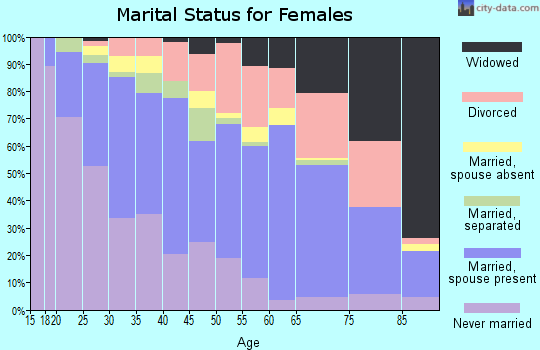
5,191 married couples with children.
3,693 single-parent households (696 men, 2,997 women).
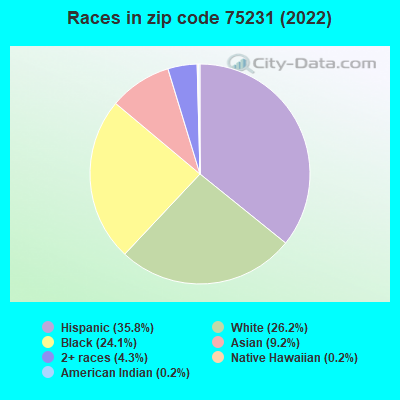
52.0% of residents of 75231 zip code speak English at home.
31.1% of residents speak Spanish at home (48% very well, 21% well, 20% not well, 11% not at all).
5.0% of residents speak other Indo-European language at home (48% very well, 38% well, 8% not well, 5% not at all).
4.6% of residents speak Asian or Pacific Island language at home (23% very well, 38% well, 21% not well, 18% not at all).
6.6% of residents speak other language at home (61% very well, 26% well, 12% not well, 1% not at all).
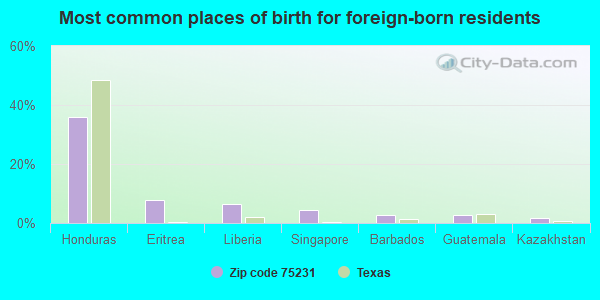
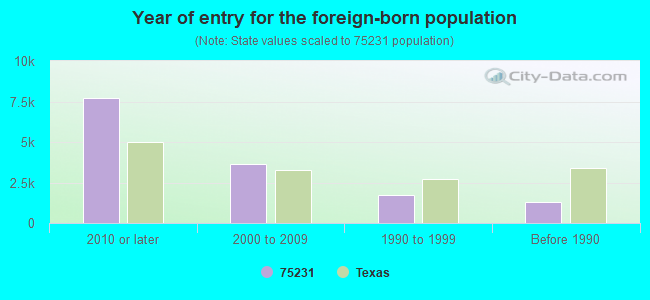
Foreign born population: 12,446 (31.0%) (26.5% of them are naturalized citizens)
Facilities with environmental interests located in this zip code:
ABRAMS CLEANERS (6780 ABRAMS ROAD #119 in DALLAS, TX)
AIR MINOR (AIRS/AFS) Business SIC classification: DRYCLEANING PLANTS, EXCEPT RUG CLEANING
BAKER DRY CLEANING (8447 PARK LANE in DALLAS, TX)
AIR MINOR (AIRS/AFS) Business SIC classification: DRYCLEANING PLANTS, EXCEPT RUG CLEANING
Housing units lacking complete plumbing facilities: 0.8% Housing units lacking complete kitchen facilities: 0.9%
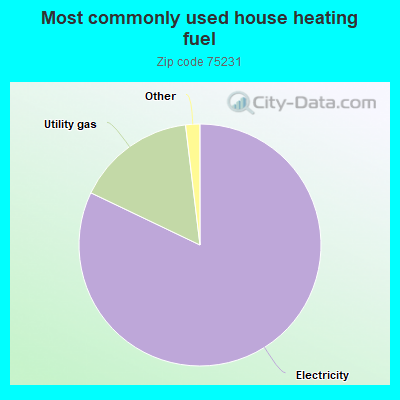
82.1%Electricity
16.0%Utility gas
0.9%No fuel used
0.6%Bottled, tank, or LP gas
Population in 1990: 35,407. Population change in the 1990s: +16,922 (+47.8%).
Place of birth for U.S.-born residents:
This state: 17,605
Northeast: 963
Midwest: 2,822
South: 3,550
West: 1,712
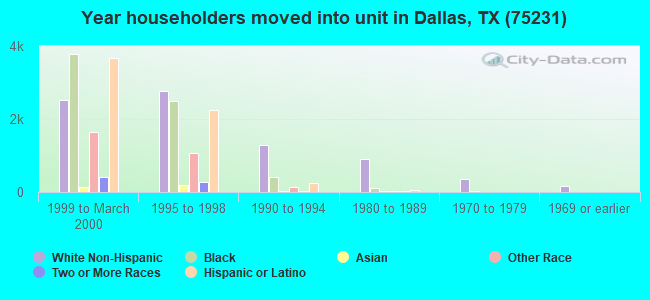
27% of the 75231 zip code residents lived in the same house 5 years ago. Out of people who lived in different houses, 66% lived in this county. Out of people who lived in different counties, 50% lived in Texas.
82% of the 75231 zip code residents lived in the same house 1 year ago. Out of people who lived in different houses, 57% moved from this county. Out of people who lived in different houses, 19% moved from different county within same state. Out of people who lived in different houses, 13% moved from different state. Out of people who lived in different houses, 9% moved from abroad.
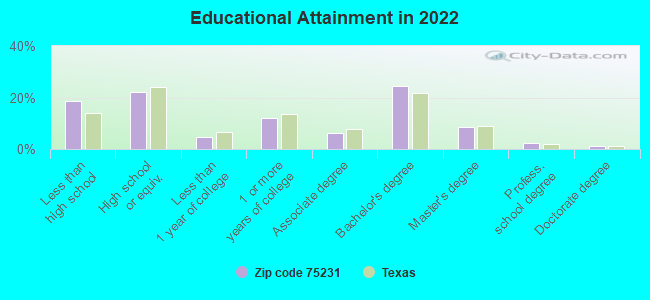
Private vs. public school enrollment:
Students in private schools in grades 1 to 8 (elementary and middle school): 116
Here:
3.1%
Texas:
8.8%
Students in private schools in grades 9 to 12 (high school): 146
Here:
8.1%
Texas:
8.0%
Students in private undergraduate colleges: 388
Here:
19.3%
Texas:
16.2%
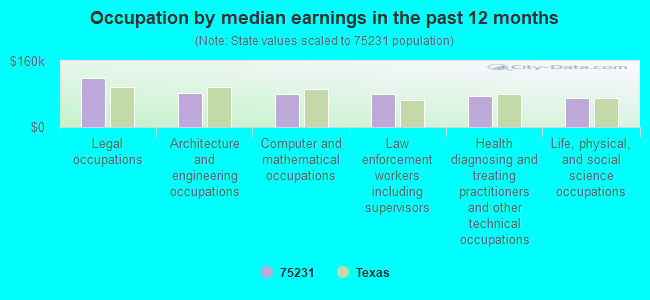
Occupation by median earnings in the past 12 months ($)
118,859Legal occupations
81,889Architecture and engineering occupations
81,160Computer and mathematical occupations
79,455Law enforcement workers including supervisors
74,193Health diagnosing and treating practitioners and other technical occupations
69,132Life, physical, and social science occupations
Companies with federal contracts located in this zip code:
THE TRUSTEES OF L&B (8750 N. CENTRAL EXPRESSWAY in DALLAS, TX) : $2,773,450 in 24 contractsfrom 1999 to 2006
Contracts for Lease or Rental of Facilities -- Office Buildings by Public Buildings Service Signed by year:2000: $500,000; 2001: $419,000; 2002: $737,366; 2003: $791,333; 2004: $0; 2005: $133,834; 2006: $66,917.
Biggest contracts:
$149,528 with Public Buildings Service for Lease or Rental of Facilities -- Office Buildings. Taking place in FL. Signed on 2003-06-15. Completion date: 2003-06-15.
$149,528, same as above.Signed on 2003-09-15. Completion date: 2003-09-15.
$148,000, same as above.Signed on 2002-09-15. Completion date: 2002-09-15.
$147,683, same as above.Signed on 2003-09-15. Completion date: 2003-09-15.
CANTINE ARMAMENT, INC (8750 N CENTRAL EXPY in DALLAS, TX; small business) : $850,293 in 8 contractsfrom 2002 to 2006
Contracts for Technical Representation Services -- Aircraft and Airframe Structural Components, Logistics Support Services by U.S. Special Operations Command, Department of Defense Signed by year:2000: $0; 2001: $0; 2002: $153,392; 2003: $271,618; 2004: $264,283; 2005: $91,000; 2006: $70,000.
Biggest contracts:
$177,915 with U.S. Special Operations Command for Technical Representation Services -- Aircraft and Airframe Structural Components. Taking place in KY. Signed on 2004-04-01. Completion date: 2005-03-31.
$169,920 with Department of Defense for Technical Representation Services -- Aircraft and Airframe Structural Components. Taking place in KY. Signed on 2003-04-01. Completion date: 2004-03-31.
$144,248, same as above.Signed on 2002-06-10. Completion date: 2002-03-30.
$101,698, same as above.Signed on 2003-02-04. Completion date: 2003-03-31.
CDM FEDERAL PROGRAMS CORPORATI (ONE GLEN LAKES in DALLAS, TX) : $510,767 in 4 contractsfrom 2004 to 2006
$464,941 with Army for Architect - Engineer Services (including landscaping, interior layout, and designing). Signed on 2006-06-13. Completion date: 2006-12-13.
$21,534, same as above.Signed on 2005-09-20. Completion date: 2005-07-15.
$20,000, same as above.Signed on 2004-08-30. Completion date: 2005-08-29.
$4,292, same as above.Signed on 2005-09-30. Completion date: 2005-07-15.
JELNICK ROBERT J (6780 Abrams Road, #103 in Dallas, TX; small business) : $415,120 in 5 contractsfrom 2004 to 2006
Contracts for Personal Services Contracts by Departmental Offices Signed by year:2000: $0; 2001: $0; 2002: $0; 2003: $0; 2004: $216,248; 2005: -$66,370; 2006: $265,242.
Biggest contracts:
$240,649 with Departmental Offices for Personal Services Contracts. Taking place in DC. Signed on 2006-01-13. Completion date: 2011-12-15.
$118,304, same as above.Signed on 2004-04-08. Completion date: 2005-04-08.
$97,944, same as above.Signed on 2004-09-20. Completion date: 2005-04-08.
$24,593, same as above.Signed on 2006-06-27. Completion date: 2007-01-15.
GLOBE COMPOSITE SOLUTIONS LTD (10440 N CENTRAL EXPRESSWAY in DALLAS, TX; small business) : $225,085 in 2 contractsfrom 2005 to 2006
$136,635 with Navy for Miscellaneous Fabricated Nonmetallic Materials. Taking place in MA. Signed on 2005-09-30. Completion date: 2006-06-07.
$88,450, same as above.Signed on 2006-01-30. Completion date: 2006-12-28.
MICROGRAFX, INC (8144 WALNUT HILL LANE in DALLAS, TX; small business) : $104,950 in 2 contractsfrom 2000 to 2001
$75,000 with Federal Technology Service for ADP Support Equipment. Taking place in MD. Signed on 2000-12-15. Completion date: 2001-01-15.
$29,950 with Air Force for ADP Software. Signed on 2001-04-30. Completion date: 2001-05-29.
OPTICAL SURVEILLANCE SYSTEMS I (10830 NORTH CENTRAL EXPRES in DALLAS, TX; small business) : $87,932 in 2 contractsin 2001
$55,062 with Navy for Photographic Equipment and Accessories. Signed on 2001-09-25. Completion date: 2001-10-15.
$32,870, same as above.Signed on 2001-09-25. Completion date: 2001-10-15.
ACTIVE RELATIONSHIPS CENTER (9400 N CENTRAL EXPY STE 31 in DALLAS, TX; small business) : $18,240 in 3 contractsfrom 2003 to 2005
$8,796 with Air Force for Books and Pamphlets. Signed on 2005-09-28. Completion date: 2005-10-24.
$5,100 with Army for Other Education and Training Services. Signed on 2003-02-12. Completion date: 2003-02-21.
$4,344 with Army for Lectures For Training. Signed on 2005-09-01. Completion date: 2005-09-23.
NORRIS DESIGN, LLC (7502 GREENVILLE AVENUE, SU in DALLAS, TX; small business)
$3,845 with Air Force for Office Furniture. Signed on 2004-07-06. Completion date: 2004-07-07.
Top industries in this zip code by the number of employees in 2005:
Health Care and Social Assistance: Offices of Physicians (except Mental Health Specialists) (100-249 employees: 1 establishment, 50-99 employees: 7 establishments, 20-49 employees: 26 establishments, 10-19 employees: 34 establishments, 5-9 employees: 42 establishments, 1-4 employees: 105 establishments)
Health Care and Social Assistance: General Medical and Surgical Hospitals (over 1000: 1, 20-49: 1)
Management of Companies and Enterprises: Corporate, Subsidiary, and Regional Managing Offices (500-999: 1, 100-249: 2, 50-99: 2, 20-49: 4, 10-19: 4, 1-4: 6)
Administrative and Support and Waste Management and Remediation Services: All Other Travel Arrangement and Reservation Services (500-999: 1, 5-9: 1)
Health Care and Social Assistance: Home Health Care Services (100-249: 1, 50-99: 3, 20-49: 6, 10-19: 2, 5-9: 2, 1-4: 1)
Finance and Insurance: Insurance Agencies and Brokerages (100-249: 2, 50-99: 1, 20-49: 1, 10-19: 5, 5-9: 9, 1-4: 24)
Administrative and Support and Waste Management and Remediation Services: Temporary Help Services (100-249: 1, 50-99: 4, 20-49: 3, 10-19: 1, 5-9: 1, 1-4: 3)
People in group quarters in 2010:
375 people in nursing facilities/skilled-nursing facilities
3 people in mental (psychiatric) hospitals and psychiatric units in other hospitals
People in group quarters in 2000:
393 people in nursing homes
176 people in other noninstitutional group quarters
84 people in mental (psychiatric) hospitals or wards
10 people in orthopedic wards and institutions for the physically handicapped
7 people in homes for the mentally retarded
Fatal accident statistics in 2014:
Fatal accident count: 4
Vehicles involved in fatal accidents: 5
Fatal accidents caused by drunken drivers: 0
Fatalities: 4
Persons involved in fatal accidents: 11
Pedestrians involved in fatal accidents: 2
Fatal accident statistics in 2013:
Fatal accident count: 1
Vehicles involved in fatal accidents: 4
Fatal accidents caused by drunken drivers: 1
Fatalities: 1
Persons involved in fatal accidents: 4
Pedestrians involved in fatal accidents: 0
Home Mortgage Disclosure Act Aggregated Statistics For Year 2009 (Based on 8 full and 10 partial tracts)
A) FHA, FSA/RHS & VA Home Purchase Loans
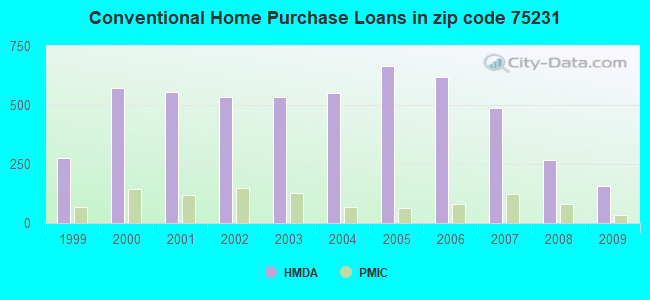
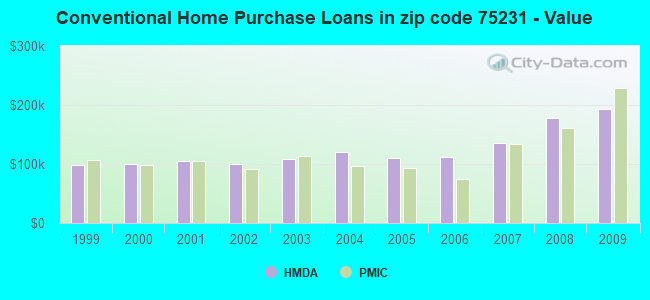
B) Conventional Home Purchase Loans
C) Refinancings
D) Home Improvement Loans
E) Loans on Dwellings For 5+ Families
F) Non-occupant Loans on < 5 Family Dwellings (A B C & D)
Number
Average Value
Number
Average Value
Number
Average Value
Number
Average Value
Number
Average Value
Number
Average Value
LOANS ORIGINATED
72
$161,340
156
$192,681
493
$201,521
27
$88,133
4
$2,290,800
20
$150,082
APPLICATIONS APPROVED, NOT ACCEPTED
5
$90,394
8
$186,436
33
$155,296
3
$47,450
0
$0
1
$32,570
APPLICATIONS DENIED
15
$87,623
17
$143,820
100
$162,632
23
$42,815
0
$0
11
$104,986
APPLICATIONS WITHDRAWN
13
$140,621
18
$193,976
83
$181,823
9
$87,842
0
$0
1
$186,960
FILES CLOSED FOR INCOMPLETENESS
4
$47,622
5
$167,964
24
$194,393
4
$37,435
0
$0
0
$0
Aggregated Statistics For Year 2008 (Based on 8 full and 10 partial tracts)
A) FHA, FSA/RHS & VA Home Purchase Loans
B) Conventional Home Purchase Loans
C) Refinancings
D) Home Improvement Loans
E) Loans on Dwellings For 5+ Families
F) Non-occupant Loans on < 5 Family Dwellings (A B C & D)
G) Loans On Manufactured Home Dwelling (A B C & D)
Number
Average Value
Number
Average Value
Number
Average Value
Number
Average Value
Number
Average Value
Number
Average Value
Number
Average Value
LOANS ORIGINATED
50
$138,657
269
$177,216
209
$186,076
44
$68,914
4
$1,054,415
56
$122,485
1
$53,000
APPLICATIONS APPROVED, NOT ACCEPTED
6
$180,268
30
$144,847
33
$137,035
4
$357,845
0
$0
9
$35,270
2
$49,645
APPLICATIONS DENIED
15
$76,947
53
$107,186
111
$150,029
39
$58,994
0
$0
22
$75,993
9
$26,890
APPLICATIONS WITHDRAWN
9
$147,918
43
$196,650
41
$165,376
10
$114,935
0
$0
12
$81,304
0
$0
FILES CLOSED FOR INCOMPLETENESS
0
$0
2
$318,620
13
$216,411
0
$0
0
$0
0
$0
0
$0
Aggregated Statistics For Year 2007 (Based on 8 full and 10 partial tracts)
A) FHA, FSA/RHS & VA Home Purchase Loans
B) Conventional Home Purchase Loans
C) Refinancings
D) Home Improvement Loans
E) Loans on Dwellings For 5+ Families
F) Non-occupant Loans on < 5 Family Dwellings (A B C & D)
G) Loans On Manufactured Home Dwelling (A B C & D)
Number
Average Value
Number
Average Value
Number
Average Value
Number
Average Value
Number
Average Value
Number
Average Value
Number
Average Value
LOANS ORIGINATED
26
$82,398
487
$135,840
153
$178,754
59
$69,051
9
$1,937,451
79
$78,587
1
$23,000
APPLICATIONS APPROVED, NOT ACCEPTED
0
$0
76
$129,086
39
$161,746
16
$44,056
0
$0
11
$58,205
0
$0
APPLICATIONS DENIED
4
$37,235
126
$143,563
163
$102,044
54
$59,154
0
$0
82
$54,683
3
$31,863
APPLICATIONS WITHDRAWN
4
$105,738
60
$208,483
54
$141,611
10
$36,567
0
$0
13
$36,985
1
$108,320
FILES CLOSED FOR INCOMPLETENESS
0
$0
11
$117,176
20
$134,386
4
$28,750
0
$0
5
$121,232
0
$0
Aggregated Statistics For Year 2006 (Based on 8 full and 10 partial tracts)
A) FHA, FSA/RHS & VA Home Purchase Loans
B) Conventional Home Purchase Loans
C) Refinancings
D) Home Improvement Loans
E) Loans on Dwellings For 5+ Families
F) Non-occupant Loans on < 5 Family Dwellings (A B C & D)
G) Loans On Manufactured Home Dwelling (A B C & D)
Number
Average Value
Number
Average Value
Number
Average Value
Number
Average Value
Number
Average Value
Number
Average Value
Number
Average Value
LOANS ORIGINATED
26
$99,382
620
$111,066
161
$161,207
63
$56,668
8
$3,440,334
108
$59,893
1
$20,060
APPLICATIONS APPROVED, NOT ACCEPTED
1
$132,340
88
$114,295
31
$111,196
11
$24,495
0
$0
23
$66,335
0
$0
APPLICATIONS DENIED
7
$77,721
155
$74,144
128
$110,933
34
$52,106
2
$716,000
66
$32,181
2
$29,650
APPLICATIONS WITHDRAWN
0
$0
62
$70,574
98
$143,141
13
$61,455
3
$1,879,343
23
$64,389
0
$0
FILES CLOSED FOR INCOMPLETENESS
0
$0
23
$111,569
21
$151,645
2
$24,885
0
$0
5
$85,820
0
$0
Aggregated Statistics For Year 2005 (Based on 8 full and 10 partial tracts)
A) FHA, FSA/RHS & VA Home Purchase Loans
B) Conventional Home Purchase Loans
C) Refinancings
D) Home Improvement Loans
E) Loans on Dwellings For 5+ Families
F) Non-occupant Loans on < 5 Family Dwellings (A B C & D)
G) Loans On Manufactured Home Dwelling (A B C & D)
Number
Average Value
Number
Average Value
Number
Average Value
Number
Average Value
Number
Average Value
Number
Average Value
Number
Average Value
LOANS ORIGINATED
20
$98,430
664
$110,123
251
$152,127
65
$68,913
14
$1,344,891
99
$56,457
0
$0
APPLICATIONS APPROVED, NOT ACCEPTED
5
$63,944
111
$85,222
47
$103,658
10
$31,966
4
$627,600
23
$77,355
2
$46,370
APPLICATIONS DENIED
9
$53,212
183
$78,464
183
$115,472
41
$26,818
4
$1,312,738
81
$44,054
4
$18,728
APPLICATIONS WITHDRAWN
1
$67,400
91
$115,448
128
$147,031
29
$147,236
0
$0
30
$82,693
0
$0
FILES CLOSED FOR INCOMPLETENESS
0
$0
28
$108,398
32
$165,454
2
$14,930
0
$0
0
$0
0
$0
Aggregated Statistics For Year 2004 (Based on 8 full and 10 partial tracts)
A) FHA, FSA/RHS & VA Home Purchase Loans
B) Conventional Home Purchase Loans
C) Refinancings
D) Home Improvement Loans
E) Loans on Dwellings For 5+ Families
F) Non-occupant Loans on < 5 Family Dwellings (A B C & D)
G) Loans On Manufactured Home Dwelling (A B C & D)
Number
Average Value
Number
Average Value
Number
Average Value
Number
Average Value
Number
Average Value
Number
Average Value
Number
Average Value
LOANS ORIGINATED
22
$89,312
552
$121,149
433
$138,831
60
$61,215
6
$3,930,155
113
$55,999
0
$0
APPLICATIONS APPROVED, NOT ACCEPTED
4
$52,155
124
$86,881
61
$119,673
9
$45,033
0
$0
13
$40,569
0
$0
APPLICATIONS DENIED
6
$92,158
190
$94,499
236
$131,720
33
$45,510
0
$0
70
$59,826
3
$26,333
APPLICATIONS WITHDRAWN
2
$119,865
68
$112,935
143
$118,857
11
$80,366
0
$0
19
$80,898
2
$54,745
FILES CLOSED FOR INCOMPLETENESS
1
$108,300
41
$111,922
44
$148,847
0
$0
0
$0
3
$94,350
0
$0
Aggregated Statistics For Year 2003 (Based on 8 full and 10 partial tracts)
A) FHA, FSA/RHS & VA Home Purchase Loans
B) Conventional Home Purchase Loans
C) Refinancings
D) Home Improvement Loans
E) Loans on Dwellings For 5+ Families
F) Non-occupant Loans on < 5 Family Dwellings (A B C & D)
Number
Average Value
Number
Average Value
Number
Average Value
Number
Average Value
Number
Average Value
Number
Average Value
LOANS ORIGINATED
29
$85,586
535
$108,372
1,167
$141,087
57
$74,376
19
$1,357,447
144
$56,705
APPLICATIONS APPROVED, NOT ACCEPTED
2
$107,220
82
$103,164
132
$133,616
22
$43,625
0
$0
18
$42,416
APPLICATIONS DENIED
22
$75,276
144
$81,009
287
$102,430
33
$39,938
1
$720,000
93
$43,366
APPLICATIONS WITHDRAWN
2
$103,885
110
$114,255
265
$119,394
2
$28,690
0
$0
18
$38,089
FILES CLOSED FOR INCOMPLETENESS
3
$136,033
18
$85,856
31
$146,735
0
$0
2
$2,987,965
3
$132,883
Aggregated Statistics For Year 2002 (Based on 5 full and 10 partial tracts)
A) FHA, FSA/RHS & VA Home Purchase Loans
B) Conventional Home Purchase Loans
C) Refinancings
D) Home Improvement Loans
E) Loans on Dwellings For 5+ Families
F) Non-occupant Loans on < 5 Family Dwellings (A B C & D)
Number
Average Value
Number
Average Value
Number
Average Value
Number
Average Value
Number
Average Value
Number
Average Value
LOANS ORIGINATED
40
$85,600
536
$100,355
694
$151,346
48
$32,145
2
$4,613,970
120
$54,694
APPLICATIONS APPROVED, NOT ACCEPTED
2
$76,455
83
$71,683
123
$113,527
25
$34,127
0
$0
25
$38,947
APPLICATIONS DENIED
6
$43,000
128
$55,469
170
$112,720
30
$22,798
2
$3,077,990
54
$48,609
APPLICATIONS WITHDRAWN
10
$41,768
57
$96,122
117
$131,506
6
$29,277
2
$3,496,000
22
$66,949
FILES CLOSED FOR INCOMPLETENESS
4
$80,408
19
$70,785
33
$165,343
0
$0
2
$6,948,750
5
$33,920
Aggregated Statistics For Year 2001 (Based on 5 full and 10 partial tracts)
A) FHA, FSA/RHS & VA Home Purchase Loans
B) Conventional Home Purchase Loans
C) Refinancings
D) Home Improvement Loans
E) Loans on Dwellings For 5+ Families
F) Non-occupant Loans on < 5 Family Dwellings (A B C & D)
Number
Average Value
Number
Average Value
Number
Average Value
Number
Average Value
Number
Average Value
Number
Average Value
LOANS ORIGINATED
64
$75,214
554
$104,465
503
$140,932
74
$33,651
5
$9,274,528
78
$52,299
APPLICATIONS APPROVED, NOT ACCEPTED
5
$46,394
57
$98,838
50
$106,302
11
$36,703
0
$0
15
$41,534
APPLICATIONS DENIED
8
$68,041
169
$68,488
130
$100,702
30
$18,764
2
$2,730,000
39
$30,877
APPLICATIONS WITHDRAWN
10
$62,396
41
$110,468
90
$110,459
9
$49,101
1
$4,161,000
17
$55,361
FILES CLOSED FOR INCOMPLETENESS
1
$74,000
25
$88,794
17
$127,522
3
$18,210
4
$5,016,815
7
$49,696
Aggregated Statistics For Year 2000 (Based on 5 full and 10 partial tracts)
A) FHA, FSA/RHS & VA Home Purchase Loans
B) Conventional Home Purchase Loans
C) Refinancings
D) Home Improvement Loans
E) Loans on Dwellings For 5+ Families
F) Non-occupant Loans on < 5 Family Dwellings (A B C & D)
Number
Average Value
Number
Average Value
Number
Average Value
Number
Average Value
Number
Average Value
Number
Average Value
LOANS ORIGINATED
52
$61,256
574
$99,464
103
$108,160
50
$35,489
2
$2,588,000
60
$41,350
APPLICATIONS APPROVED, NOT ACCEPTED
6
$93,033
72
$66,037
23
$95,569
25
$35,417
0
$0
6
$28,445
APPLICATIONS DENIED
7
$45,523
207
$57,380
30
$75,061
16
$19,966
2
$680,000
17
$75,427
APPLICATIONS WITHDRAWN
11
$50,968
53
$92,468
29
$117,693
2
$7,965
4
$6,809,728
10
$25,185
FILES CLOSED FOR INCOMPLETENESS
5
$50,234
10
$58,201
10
$105,889
1
$41,610
0
$0
0
$0
Aggregated Statistics For Year 1999 (Based on 3 full and 6 partial tracts)
A) FHA, FSA/RHS & VA Home Purchase Loans
B) Conventional Home Purchase Loans
C) Refinancings
D) Home Improvement Loans
E) Loans on Dwellings For 5+ Families
F) Non-occupant Loans on < 5 Family Dwellings (A B C & D)
2002 - 2018 National Fire Incident Reporting System (NFIRS) incidents
Based on the data from the years 2002 - 2018 the average number of fires per year is 84. The highest number of fire incidents - 251 took place in 2003, and the least - 1 in 2005. The data has a declining trend.
When looking into fire subcategories, the most incidents belonged to: Outside Fires (38.1%), and Other (25.3%).
Fire incident types reported to NFIRS in Zip Code 75231


 Nearest zip codes: 75238, 75243, 75225, 75214, 75206, 75251.


 Based on the data from the years 2002 - 2018 the average number of fires per year is 84. The highest number of fire incidents - 251 took place in 2003, and the least - 1 in 2005. The data has a declining trend.
 When looking into fire subcategories, the most incidents belonged to: Outside Fires (38.1%), and Other (25.3%).