Estimated zip code population in 2022: 34,929 Zip code population in 2010: 32,950 Zip code population in 2000: 35,557
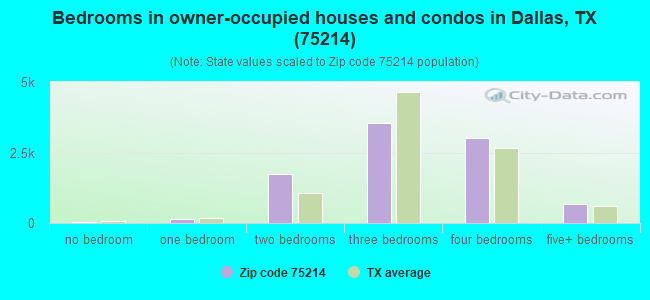
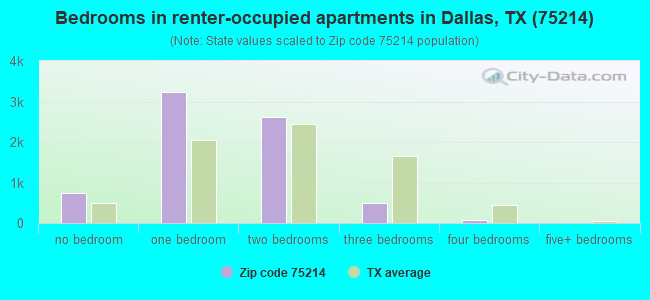
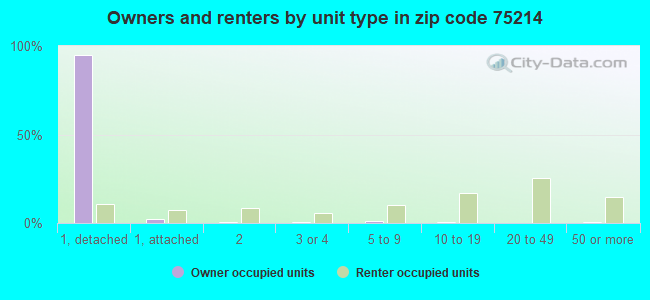
Houses and condos: 17,761 Renter-occupied apartments: 7,101
% of renters here:
44%
State:
38%
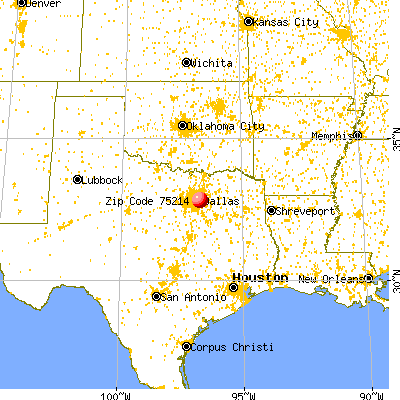
March 2022 cost of living index in zip code 75214: 98.2 (near average, U.S. average is 100)
Land area: 7.2 sq. mi. Water area: 0.2 sq. mi.
Population density: 4,827 people per square mile
(average).
OSM Map
General Map
Google Map
MSN Map
OSM Map
General Map
Google Map
MSN Map
OSM Map
General Map
Google Map
MSN Map
OSM Map
General Map
Google Map
MSN Map
Please wait while loading the map...
Real estate property taxes paid for housing units in 2022:
This zip code:
1.4% ($10,460)
Texas:
1.5% ($4,050)
Median real estate property taxes paid for housing units with mortgages in 2022: $10,505 (1.3%) Median real estate property taxes paid for housing units with no mortgage in 2022: $9,560 (1.6%)
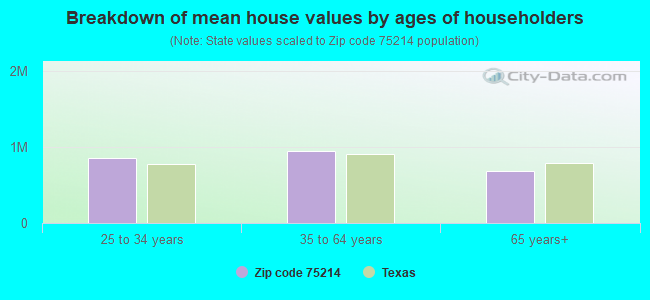
Estimated median house/condo value in 2022: $751,796
75214:
$751,796
Texas:
$275,400
According to our research of Texas and other state lists, there were 87 registered sex offenders living in 75214 zip code as of April 27, 2024. The ratio of all residents to sex offenders in zip code 75214 is 397 to 1. The ratio of registered sex offenders to all residents in this zip code is near the state average.
Median resident age:
This zip code:
37.5 years
Texas median age:
35.6 years
Average household size:
This zip code:
2.1 people
Texas:
2.6 people
Averages for the 2020 tax year for zip code 75214, filed in 2021:
Average Adjusted Gross Income (AGI) in 2020: $198,531 (Individual Income Tax Returns)
Here:
$198,531
State:
$77,054
Salary/wage: $149,131 (reported on 81.2% of returns)
Here:
$149,131
State:
$62,766
(% of AGI for various income ranges: 1196.3% for AGIs below $25k, 3642.4% for AGIs $25k-50k, 6668.1% for AGIs $50k-75k, 10066.3% for AGIs $75k-100k, 19603.7% for AGIs $100k-200k, 109509.2% for AGIs over 200k)
Taxable interest for individuals: $4,349 (reported on 43.0% of returns)
This zip code:
$4,349
Texas:
$2,665
(% of AGI for various income ranges: 25.0% for AGIs below $25k, 43.8% for AGIs $25k-50k, 52.8% for AGIs $50k-75k, 111.3% for AGIs $75k-100k, 276.4% for AGIs $100k-200k, 1815.0% for AGIs over 200k)
Ordinary dividends: $15,081 (reported on 41.7% of returns)
Here:
$15,081
State:
$10,044
(% of AGI for various income ranges: 68.9% for AGIs below $25k, 126.5% for AGIs $25k-50k, 216.1% for AGIs $50k-75k, 389.7% for AGIs $75k-100k, 953.4% for AGIs $100k-200k, 6081.7% for AGIs over 200k)
Net capital gain/loss in AGI: +$64,869 (reported on 39.9% of returns)
Here:
+$64,869
State:
+$39,590
(% of AGI for various income ranges: 40.8% for AGIs below $25k, 116.0% for AGIs $25k-50k, 216.8% for AGIs $50k-75k, 353.3% for AGIs $75k-100k, 1174.3% for AGIs $100k-200k, 30598.5% for AGIs over 200k)
Profit/loss from business: +$32,685 (reported on 23.4% of returns)
Here:
+$32,685
State:
+$10,888
(% of AGI for various income ranges: 182.9% for AGIs below $25k, 262.9% for AGIs $25k-50k, 343.0% for AGIs $50k-75k, 729.1% for AGIs $75k-100k, 1480.6% for AGIs $100k-200k, 6461.7% for AGIs over 200k)
Taxable individual retirement arrangement distribution: $28,082 (reported on 9.4% of returns)
75214:
$28,082
Texas:
$24,740
(% of AGI for various income ranges: 54.9% for AGIs below $25k, 107.8% for AGIs $25k-50k, 208.4% for AGIs $50k-75k, 370.3% for AGIs $75k-100k, 932.7% for AGIs $100k-200k, 1600.6% for AGIs over 200k)
Self-employed (Keogh) retirement plans: $38,037 (reported on 3.1% of returns)
75214:
$38,037
Texas:
$29,298
(% of AGI for various income ranges: 38.8% for AGIs $50k-75k, 113.7% for AGIs $100k-200k, 1320.0% for AGIs over 200k)
Total itemized deductions: $41,941 (reported on 25.6% of returns)
Here:
$41,941
State:
$40,428
(% of AGI for various income ranges: 131.3% for AGIs below $25k, 263.1% for AGIs $25k-50k, 435.7% for AGIs $50k-75k, 927.1% for AGIs $75k-100k, 1843.6% for AGIs $100k-200k, 9833.6% for AGIs over 200k)
Charity contributions: $15,636 (reported on 21.9% of returns)
Here:
$15,636
State:
$18,201
(% of AGI for various income ranges: 10.0% for AGIs below $25k, 29.5% for AGIs $25k-50k, 57.2% for AGIs $50k-75k, 148.2% for AGIs $75k-100k, 359.0% for AGIs $100k-200k, 3709.1% for AGIs over 200k)
Taxes paid: $9,166 (reported on 25.4% of returns)
75214:
$9,166
State:
$7,821
(% of AGI for various income ranges: 32.0% for AGIs below $25k, 50.7% for AGIs $25k-50k, 113.4% for AGIs $50k-75k, 260.9% for AGIs $75k-100k, 559.7% for AGIs $100k-200k, 1902.3% for AGIs over 200k)
Earned income credit: $1,846 (reported on 8.2% of returns)
Here:
$1,846
State:
$2,584
(% of AGI for various income ranges: 74.0% for AGIs below $25k, 35.7% for AGIs $25k-50k)
Percentage of individuals using paid preparers for their 2020 taxes: 91.9%
Here:
92%
State:
92%
(% for various income ranges: 87.6% for AGIs below $25k, 91.9% for AGIs $25k-50k, 93.0% for AGIs $50k-75k, 92.8% for AGIs $75k-100k, 92.0% for AGIs $100k-200k, 94.7% for AGIs over 200k)
Averages for the 2012 tax year for zip code 75214, filed in 2013:
Average Adjusted Gross Income (AGI) in 2012: $120,986 (Individual Income Tax Returns)
Here:
$120,986
State:
$65,384
Salary/wage: $98,084 (reported on 81.2% of returns)
Here:
$98,084
State:
$52,524
(% of AGI for various income ranges: 71.1% for AGIs below $25k, 79.8% for AGIs $25k-50k, 75.2% for AGIs $50k-75k, 73.3% for AGIs $75k-100k, 76.1% for AGIs $100k-200k, 59.1% for AGIs over 200k)
Taxable interest for individuals: $2,981 (reported on 41.8% of returns)
This zip code:
$2,981
Texas:
$2,372
(% of AGI for various income ranges: 1.3% for AGIs below $25k, 0.8% for AGIs $25k-50k, 1.1% for AGIs $50k-75k, 1.2% for AGIs $75k-100k, 0.8% for AGIs $100k-200k, 1.1% for AGIs over 200k)
Ordinary dividends: $11,064 (reported on 35.8% of returns)
Here:
$11,064
State:
$9,721
(% of AGI for various income ranges: 5.2% for AGIs below $25k, 2.7% for AGIs $25k-50k, 2.6% for AGIs $50k-75k, 2.7% for AGIs $75k-100k, 2.8% for AGIs $100k-200k, 3.5% for AGIs over 200k)
Net capital gain/loss in AGI: +$32,918 (reported on 29.9% of returns)
Here:
+$32,918
State:
+$35,319
(% of AGI for various income ranges: 0.4% for AGIs below $25k, 0.6% for AGIs $25k-50k, 0.8% for AGIs $50k-75k, 1.3% for AGIs $75k-100k, 1.7% for AGIs $100k-200k, 12.8% for AGIs over 200k)
Profit/loss from business: +$28,582 (reported on 23.0% of returns)
Here:
+$28,582
State:
+$13,732
(% of AGI for various income ranges: 13.0% for AGIs below $25k, 5.4% for AGIs $25k-50k, 6.0% for AGIs $50k-75k, 6.3% for AGIs $75k-100k, 6.7% for AGIs $100k-200k, 4.5% for AGIs over 200k)
Taxable individual retirement arrangement distribution: $27,213 (reported on 11.1% of returns)
75214:
$27,213
Texas:
$19,511
(% of AGI for various income ranges: 3.2% for AGIs below $25k, 2.6% for AGIs $25k-50k, 3.6% for AGIs $50k-75k, 3.5% for AGIs $75k-100k, 2.8% for AGIs $100k-200k, 2.1% for AGIs over 200k)
Self-employment retirement plans: $30,153 (reported on 2.7% of returns)
75214:
$30,153
Texas:
$23,938
(% of AGI for various income ranges: 0.2% for AGIs below $25k, 0.2% for AGIs $50k-75k, 0.3% for AGIs $75k-100k, 0.5% for AGIs $100k-200k, 0.9% for AGIs over 200k)
Total itemized deductions: $31,051 (14% of AGI, reported on 43.6% of returns)
Here:
$31,051
State:
$24,724
Here:
14.0% of AGI
State:
15.9% of AGI
(% of AGI for various income ranges: 12.8% for AGIs below $25k, 10.1% for AGIs $25k-50k, 13.0% for AGIs $50k-75k, 13.7% for AGIs $75k-100k, 13.7% for AGIs $100k-200k, 9.9% for AGIs over 200k)
Charity contributions: $7,456 (reported on 36.9% of returns)
Here:
$7,456
State:
$6,808
(% of AGI for various income ranges: 0.9% for AGIs below $25k, 1.0% for AGIs $25k-50k, 1.6% for AGIs $50k-75k, 1.8% for AGIs $75k-100k, 2.1% for AGIs $100k-200k, 2.6% for AGIs over 200k)
Taxes paid: $10,668 (reported on 42.9% of returns)
75214:
$10,668
State:
$6,921
(% of AGI for various income ranges: 3.4% for AGIs below $25k, 2.6% for AGIs $25k-50k, 4.0% for AGIs $50k-75k, 4.7% for AGIs $75k-100k, 5.1% for AGIs $100k-200k, 3.4% for AGIs over 200k)
Earned income credit: $1,880 (reported on 10.0% of returns)
Here:
$1,880
State:
$2,570
(% of AGI for various income ranges: 4.5% for AGIs below $25k, 0.4% for AGIs $25k-50k)
Percentage of individuals using paid preparers for their 2012 taxes: 51.3%
Here:
51%
State:
51%
(% for various income ranges: 50.1% for AGIs below $25k, 43.5% for AGIs $25k-50k, 44.8% for AGIs $50k-75k, 48.3% for AGIs $75k-100k, 53.2% for AGIs $100k-200k, 69.3% for AGIs over 200k)
Averages for the 2004 tax year for zip code 75214, filed in 2005:
Average Adjusted Gross Income (AGI) in 2004: $81,725 (Individual Income Tax Returns)
Here:
$81,725
State:
$47,881
Salary/wage: $70,575 (reported on 79.2% of returns)
Here:
$70,575
State:
$41,947
(% of AGI for various income ranges: 2210.3% for AGIs below $10k, 71.1% for AGIs $10k-25k, 80.5% for AGIs $25k-50k, 74.2% for AGIs $50k-75k, 77.8% for AGIs $75k-100k, 63.4% for AGIs over 100k)
Taxable interest for individuals: $3,638 (reported on 50.3% of returns)
This zip code:
$3,638
Texas:
$2,255
(% of AGI for various income ranges: 321.1% for AGIs below $10k, 4.0% for AGIs $10k-25k, 2.1% for AGIs $25k-50k, 2.4% for AGIs $50k-75k, 2.0% for AGIs $75k-100k, 2.0% for AGIs over 100k)
Taxable dividends: $5,398 (reported on 37.2% of returns)
Here:
$5,398
State:
$4,261
(% of AGI for various income ranges: 296.7% for AGIs below $10k, 3.1% for AGIs $10k-25k, 1.7% for AGIs $25k-50k, 2.2% for AGIs $50k-75k, 1.9% for AGIs $75k-100k, 2.5% for AGIs over 100k)
Net capital gain/loss: +$16,519 (reported on 32.4% of returns)
Here:
+$16,519
State:
+$16,110
(% of AGI for various income ranges: 6.0% for AGIs below $10k, -1.0% for AGIs $10k-25k, 0.7% for AGIs $25k-50k, 1.9% for AGIs $50k-75k, 1.3% for AGIs $75k-100k, 9.3% for AGIs over 100k)
Profit/loss from business: +$24,884 (reported on 21.7% of returns)
Here:
+$24,884
State:
+$11,013
(% of AGI for various income ranges: 204.9% for AGIs below $10k, 9.9% for AGIs $10k-25k, 5.5% for AGIs $25k-50k, 5.7% for AGIs $50k-75k, 5.6% for AGIs $75k-100k, 6.8% for AGIs over 100k)
IRA payment deduction: $3,263 (reported on 2.8% of returns)
75214:
$3,263
Texas:
$3,120
(% of AGI for various income ranges: 9.8% for AGIs below $10k, 0.2% for AGIs $10k-25k, 0.2% for AGIs $25k-50k, 0.2% for AGIs $50k-75k, 0.1% for AGIs $75k-100k, 0.1% for AGIs over 100k)
Self-employed pension: $19,102 (reported on 2.9% of returns)
Here:
$19,102
Texas:
$16,401
(% of AGI for various income ranges: 0.1% for AGIs $10k-25k, 0.2% for AGIs $25k-50k, 0.3% for AGIs $50k-75k, 0.4% for AGIs $75k-100k, 0.9% for AGIs over 100k)
Total itemized deductions: $23,449 (16% of AGI, reported on 42.3% of returns)
Here:
$23,449
State:
$19,631
Here:
16.3% of AGI
State:
18.9% of AGI
(% of AGI for various income ranges: 542.5% for AGIs below $10k, 13.2% for AGIs $10k-25k, 12.2% for AGIs $25k-50k, 15.0% for AGIs $50k-75k, 16.2% for AGIs $75k-100k, 10.9% for AGIs over 100k)
Charity contributions deductions: $5,053 (3% of AGI, reported on 36.5% of returns)
Here:
$5,053
State:
$4,753
Here:
3.3% of AGI
State:
4.2% of AGI
(% of AGI for various income ranges: 22.0% for AGIs below $10k, 1.4% for AGIs $10k-25k, 1.5% for AGIs $25k-50k, 2.2% for AGIs $50k-75k, 2.3% for AGIs $75k-100k, 2.4% for AGIs over 100k)
Total tax: $18,650 (reported on 81.5% of returns)
75214:
$18,650
State:
$9,058
(% of AGI for various income ranges: 119.2% for AGIs below $10k, 4.9% for AGIs $10k-25k, 8.9% for AGIs $25k-50k, 12.4% for AGIs $50k-75k, 13.3% for AGIs $75k-100k, 22.4% for AGIs over 100k)
Earned income credit: $1,675 (reported on 10.3% of returns)
Here:
$1,675
State:
$2,024
Percentage of individuals using paid preparers for their 2004 taxes: 54.4%
Here:
54%
State:
57%
(% for various income ranges: 53.1% for AGIs below $10k, 60.3% for AGIs $10k-25k, 47.4% for AGIs $25k-50k, 50.8% for AGIs $50k-75k, 51.1% for AGIs $75k-100k, 61.4% for AGIs over 100k)
Likely homosexual households (counted as self-reported same-sex unmarried-partner households)
Lesbian couples: 0.3% of all households
Gay men: 0.4% of all households
Household received Food Stamps/SNAP in the past 12 months: 476 Household did not receive Food Stamps/SNAP in the past 12 months: 15,726
Women who had a birth in the past 12 months: 463 (424 now married, 44 unmarried) Women who did not have a birth in the past 12 months: 8,962 (4,027 now married, 4,932 unmarried)
Housing units in zip code 75214 with a mortgage: 5,863 (613 second mortgage, 243 both second mortgage and home equity loan) Houses without a mortgage: 44
Median monthly owner costs for units with a mortgage: $3,815 Median monthly owner costs for units without a mortgage: $1,295
Residents with income below the poverty level in 2022:
This zip code:
5.7%
Whole state:
14.0%
Residents with income below 50% of the poverty level in 2022:
This zip code:
2.3%
Whole state:
7.4%
Median number of rooms in houses and condos:
Here:
7.2
State:
6.3
Median number of rooms in apartments:
Here:
3.4
State:
4.0
Notable locations in this zip code not listed on our city pages
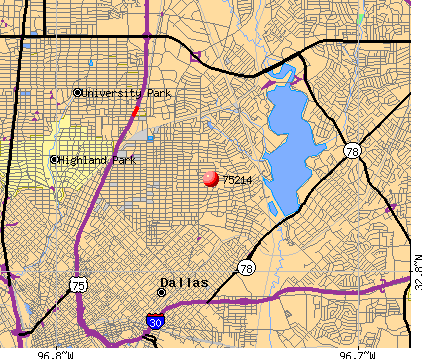
Notable locations in zip code 75214: Lakewood Country Club (A), Munger Place Historic District (B), Dallas Fire - Rescue Station 55 (C), Roger D McIntosh House (D). Display/hide their locations on the map
Churches in zip code 75214 include: Saint Paul Church (A), Emmanuel Pentecostal Church (B), San Juan Fellowship United Methodist Church (C), Lakewood Presbyterian Church (D), All Saints Episcopal Church (E), First United Lutheran Church (F), Saint Pauls Evangelical and Reformed Church (G), Trinity Lutheran Church (H), Junius Heights Baptist Church (I). Display/hide their locations on the map
Parks in zip code 75214 include: Ridge Wood Park (1), White Rock Lake Park (2), White Rock West Park (3), Tokalon Park (4), Tietz Park (5), Randall Park (6). Display/hide their locations on the map
5,816 married couples with children.
1,135 single-parent households (323 men, 812 women).
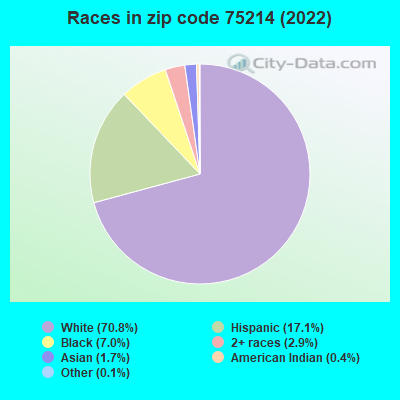
84.8% of residents of 75214 zip code speak English at home.
12.3% of residents speak Spanish at home (65% very well, 12% well, 16% not well, 6% not at all).
1.8% of residents speak other Indo-European language at home (82% very well, 15% well, 2% not well).
0.6% of residents speak Asian or Pacific Island language at home (75% very well, 20% well, 5% not well).
0.2% of residents speak other language at home (64% very well, 36% well).
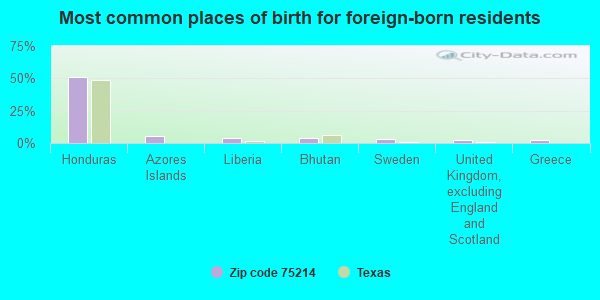
Foreign born population: 2,979 (8.5%) (41.6% of them are naturalized citizens)
Facilities with environmental interests located in this zip code:
1.25 CLEANERS (6434 MOCKINGBIRD SUITE 111 in DALLAS, TX)
(Resource Conservation and Recovery Act (tracking hazardous waste)) Alternative names: ONE TENTY-FIVE CLNRS
1.25 CLEANERS (9090 SKILLMAN ST SUITE 192 A in DALLAS, TX)
(Resource Conservation and Recovery Act (tracking hazardous waste)) Alternative names: ONE TWENTY-FIVE CLNRS
Housing units lacking complete plumbing facilities: 0.9% Housing units lacking complete kitchen facilities: 1.7%
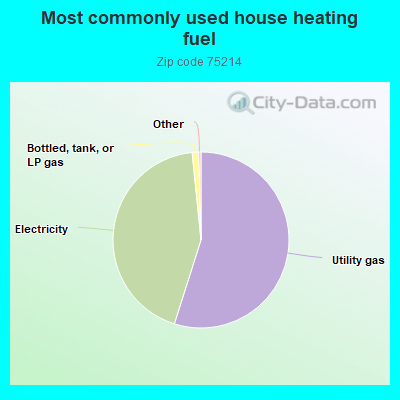
54.9%Utility gas
43.5%Electricity
1.2%Bottled, tank, or LP gas
Population in 1990: 32,618. Population change in the 1990s: +2,939 (+9.0%).
Place of birth for U.S.-born residents:
This state: 19,105
Northeast: 2,200
Midwest: 3,094
South: 4,591
West: 2,435
47% of the 75214 zip code residents lived in the same house 5 years ago. Out of people who lived in different houses, 68% lived in this county. Out of people who lived in different counties, 50% lived in Texas.
87% of the 75214 zip code residents lived in the same house 1 year ago. Out of people who lived in different houses, 62% moved from this county. Out of people who lived in different houses, 10% moved from different county within same state. Out of people who lived in different houses, 24% moved from different state. Out of people who lived in different houses, 3% moved from abroad.
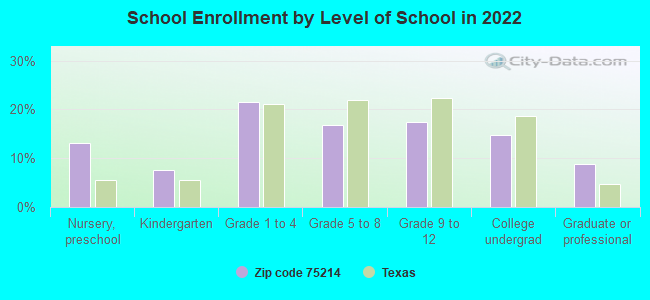
Private vs. public school enrollment:
Students in private schools in grades 1 to 8 (elementary and middle school): 752
Here:
25.7%
Texas:
8.8%
Students in private schools in grades 9 to 12 (high school): 234
Here:
17.7%
Texas:
8.0%
Students in private undergraduate colleges: 374
Here:
33.8%
Texas:
16.2%
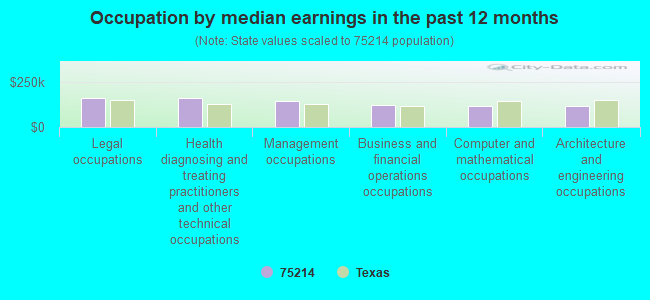
Occupation by median earnings in the past 12 months ($)
161,613Legal occupations
157,514Health diagnosing and treating practitioners and other technical occupations
142,184Management occupations
119,208Business and financial operations occupations
117,662Computer and mathematical occupations
113,404Architecture and engineering occupations
Companies with federal contracts located in this zip code:
LEETEX CONSTRUCTION LLC (6301 GASTON AVE in DALLAS, TX; small business) : $4,807,873 in 27 contractsfrom 2004 to 2006
Contracts for Construction of Structures and Facilities -- Other Administrative Facilities and Service Buildings, Construction -- Basic Research (R&D), Construction of Structures and Facilities -- Recreational Buildings, Maintenance, Repair or Alteration of Real Property -- Religious Facilities, and moreby Army, Bureau of Engraving and Printing, U.S. Army Corps of Engineers - civil program financing only, HOUSING AND URBAN DEVELOPMENT, Department of, and others Signed by year:2000: $0; 2001: $0; 2002: $0; 2003: $0; 2004: $165,054; 2005: $1,033,897; 2006: $3,608,922.
Biggest contracts:
$2,825,000 with Army for Construction of Structures and Facilities -- Other Administrative Facilities and Service Buildings. Signed on 2006-05-19. Completion date: 2007-01-22.
$391,000 with Bureau of Engraving and Printing for Construction -- Basic Research (R&D). Signed on 2006-04-06. Completion date: 2006-09-24.
$268,239 with Bureau of Engraving and Printing for Construction -- Basic Research (R&D). Taking place in DC. Signed on 2005-07-22. Effective on 2005-08-03. Completion date: 2006-02-07.
$225,000 with Army for Construction of Structures and Facilities -- Recreational Buildings. Signed on 2005-06-30. Completion date: 2005-10-14.
LEETEX/HILL & WILKINSON LLC (6301 GASTON AVE in DALLAS, TX; small business) : $876,245 in 4 contractsfrom 2004 to 2005
$496,300 with Army for Maintenance, Repair or Alteration of Real Property -- Highways, Roads, Streets, Bridges, and Railways (includes resurfacing). Signed on 2005-09-28. Completion date: 2006-03-31.
$217,413 with Army for Maintenance, Repair or Alteration of Real Property -- Maintenance Buildings. Signed on 2004-09-10. Completion date: 2005-03-31.
$162,332 with Bureau of Engraving and Printing for Construction of Structures and Facilities -- Production Buildings. Signed on 2004-03-22. Completion date: 2004-07-21.
$200 with Army for Construction of Structures and Facilities -- Maintenance Buildings. Signed on 2005-08-24. Completion date: 2007-06-30.
COMEDICA INCORPORATED (2201 TUCKER STREET in DALLAS, TX; small business) : $168,640 in 8 contractsfrom 2000 to 2005
Contracts for Medical and Surgical Instruments, Equipment, and Supplies, Maintenance, Repair and Rebuilding of Equipment -- Instruments and Laboratory Equipment, Maintenance, Repair and Rebuilding of Equipment -- Medical, Dental, and Veterinary Equipment and Supplies by Army Signed by year:2000: $66,222; 2001: $0; 2002: -$1,878; 2003: $0; 2004: $70,056; 2005: $34,240; 2006: $0.
Biggest contracts:
$66,222 with Army for Medical and Surgical Instruments, Equipment, and Supplies. Signed on 2000-09-29. Completion date: 2000-10-15.
$35,028 with Army for Maintenance, Repair and Rebuilding of Equipment -- Instruments and Laboratory Equipment. Signed on 2004-11-04. Completion date: 2005-10-30.
$35,028, same as above.Signed on 2004-01-29. Completion date: 2004-09-30.
$34,240 with Army for Maintenance, Repair and Rebuilding of Equipment -- Medical, Dental, and Veterinary Equipment and Supplies. Signed on 2005-11-10. Completion date: 2006-09-30.
Top industries in this zip code by the number of employees in 2005:
2002 - 2018 National Fire Incident Reporting System (NFIRS) incidents
According to the data from the years 2002 - 2018 the average number of fire incidents per year is 43. The highest number of reported fire incidents - 122 took place in 2003, and the least - 0 in 2008. The data has a decreasing trend.
When looking into fire subcategories, the most reports belonged to: Outside Fires (49.4%), and Mobile Property/Vehicle Fires (17.1%).
Fire incident types reported to NFIRS in Zip Code 75214


 Nearest zip codes: 75206, 75223, 75246, 75231, 75218, 75205.


 According to the data from the years 2002 - 2018 the average number of fire incidents per year is 43. The highest number of reported fire incidents - 122 took place in 2003, and the least - 0 in 2008. The data has a decreasing trend.
 When looking into fire subcategories, the most reports belonged to: Outside Fires (49.4%), and Mobile Property/Vehicle Fires (17.1%).