Estimated zip code population in 2022: 34,517
Zip code population in 2010: 27,823
Zip code population in 2000: 24,592
Houses and condos: 16,737
Renter-occupied apartments: 6,904
% of renters here:
44%State:
38%
March 2022 cost of living index in zip code 75605: 83.9
(less than average, U.S. average is 100)
Land area: 79.2
sq. mi.
Water area: 0.2
sq. mi.
Population density: 436 people per square mile (low).
OSM Map
General Map
Google Map
MSN Map
OSM Map
General Map
Google Map
MSN Map
OSM Map
General Map
Google Map
MSN Map
OSM Map
General Map
Google Map
MSN Map
Please wait while loading the map...
Real estate property taxes paid for housing units in 2022:
This zip code:
1.3% ($3,347)Texas:
1.5% ($4,050)
Median real estate property taxes paid for housing units with mortgages in 2022: $3,639 (1.3%)
Median real estate property taxes paid for housing units with no mortgage in 2022: $3,002 (1.2%)
Profiles of local businesses
Business Search - 14 Million verified businesses
Males: 16,539 Females: 17,977
For population 25 years and over in 75605:
High school or higher: 94.9%Bachelor's degree or higher: 31.0%Graduate or professional degree: 10.5%Unemployed: 2.1%Mean travel time to work (commute): 21.6 minutes
For population 15 years and over in 75605:
Never married: 28.6%Now married: 51.9%Separated: 1.5%Widowed: 6.7%Divorced: 11.3%
Zip code 75605 compared to state average:
Unemployed percentage below state average. Hispanic race population percentage significantly below state average. Foreign-born population percentage significantly below state average. Length of stay since moving in significantly above state average. 25,317 73.4% White 5,107 14.8% Black 2,179 6.3% Hispanic or Latino 1,132 3.3% Two or more races 639 1.9% Asian 124 0.4% Some other race 16 0.05% American Indian
Data:
Median household income ($)
Median household income (% change since 2000)
Household income diversity
Ratio of average income to average house value (%)
Ratio of average income to average rent
Median household income ($) - White
Median household income ($) - Black or African American
Median household income ($) - Asian
Median household income ($) - Hispanic or Latino
Median household income ($) - American Indian and Alaska Native
Median household income ($) - Multirace
Median household income ($) - Other Race
Median household income for houses/condos with a mortgage ($)
Median household income for apartments without a mortgage ($)
Races - White alone (%)
Races - White alone (% change since 2000)
Races - Black alone (%)
Races - Black alone (% change since 2000)
Races - American Indian alone (%)
Races - American Indian alone (% change since 2000)
Races - Asian alone (%)
Races - Asian alone (% change since 2000)
Races - Hispanic (%)
Races - Hispanic (% change since 2000)
Races - Native Hawaiian and Other Pacific Islander alone (%)
Races - Native Hawaiian and Other Pacific Islander alone (% change since 2000)
Races - Two or more races (%)
Races - Two or more races (% change since 2000)
Races - Other race alone (%)
Races - Other race alone (% change since 2000)
Racial diversity
Unemployment (%)
Unemployment (% change since 2000)
Unemployment (%) - White
Unemployment (%) - Black or African American
Unemployment (%) - Asian
Unemployment (%) - Hispanic or Latino
Unemployment (%) - American Indian and Alaska Native
Unemployment (%) - Multirace
Unemployment (%) - Other Race
Population density (people per square mile)
Population - Males (%)
Population - Females (%)
Population - Males (%) - White
Population - Males (%) - Black or African American
Population - Males (%) - Asian
Population - Males (%) - Hispanic or Latino
Population - Males (%) - American Indian and Alaska Native
Population - Males (%) - Multirace
Population - Males (%) - Other Race
Population - Females (%) - White
Population - Females (%) - Black or African American
Population - Females (%) - Asian
Population - Females (%) - Hispanic or Latino
Population - Females (%) - American Indian and Alaska Native
Population - Females (%) - Multirace
Population - Females (%) - Other Race
Coronavirus confirmed cases (May 08, 2024)
Deaths caused by coronavirus (May 08, 2024)
Coronavirus confirmed cases (per 100k population) (May 08, 2024)
Deaths caused by coronavirus (per 100k population) (May 08, 2024)
Daily increase in number of cases (May 08, 2024)
Weekly increase in number of cases (May 08, 2024)
Cases doubled (in days) (May 08, 2024)
Hospitalized patients (Apr 18, 2022)
Negative test results (Apr 18, 2022)
Total test results (Apr 18, 2022)
COVID Vaccine doses distributed (per 100k population) (Sep 19, 2023)
COVID Vaccine doses administered (per 100k population) (Sep 19, 2023)
COVID Vaccine doses distributed (Sep 19, 2023)
COVID Vaccine doses administered (Sep 19, 2023)
Likely homosexual households (%)
Likely homosexual households (% change since 2000)
Likely homosexual households - Lesbian couples (%)
Likely homosexual households - Lesbian couples (% change since 2000)
Likely homosexual households - Gay men (%)
Likely homosexual households - Gay men (% change since 2000)
Cost of living index
Median gross rent ($)
Median contract rent ($)
Median monthly housing costs ($)
Median house or condo value ($)
Median house or condo value ($ change since 2000)
Mean house or condo value by units in structure - 1, detached ($)
Mean house or condo value by units in structure - 1, attached ($)
Mean house or condo value by units in structure - 2 ($)
Mean house or condo value by units in structure by units in structure - 3 or 4 ($)
Mean house or condo value by units in structure - 5 or more ($)
Mean house or condo value by units in structure - Boat, RV, van, etc. ($)
Mean house or condo value by units in structure - Mobile home ($)
Median house or condo value ($) - White
Median house or condo value ($) - Black or African American
Median house or condo value ($) - Asian
Median house or condo value ($) - Hispanic or Latino
Median house or condo value ($) - American Indian and Alaska Native
Median house or condo value ($) - Multirace
Median house or condo value ($) - Other Race
Median resident age
Resident age diversity
Median resident age - Males
Median resident age - Females
Median resident age - White
Median resident age - Black or African American
Median resident age - Asian
Median resident age - Hispanic or Latino
Median resident age - American Indian and Alaska Native
Median resident age - Multirace
Median resident age - Other Race
Median resident age - Males - White
Median resident age - Males - Black or African American
Median resident age - Males - Asian
Median resident age - Males - Hispanic or Latino
Median resident age - Males - American Indian and Alaska Native
Median resident age - Males - Multirace
Median resident age - Males - Other Race
Median resident age - Females - White
Median resident age - Females - Black or African American
Median resident age - Females - Asian
Median resident age - Females - Hispanic or Latino
Median resident age - Females - American Indian and Alaska Native
Median resident age - Females - Multirace
Median resident age - Females - Other Race
Commute - mean travel time to work (minutes)
Travel time to work - Less than 5 minutes (%)
Travel time to work - Less than 5 minutes (% change since 2000)
Travel time to work - 5 to 9 minutes (%)
Travel time to work - 5 to 9 minutes (% change since 2000)
Travel time to work - 10 to 19 minutes (%)
Travel time to work - 10 to 19 minutes (% change since 2000)
Travel time to work - 20 to 29 minutes (%)
Travel time to work - 20 to 29 minutes (% change since 2000)
Travel time to work - 30 to 39 minutes (%)
Travel time to work - 30 to 39 minutes (% change since 2000)
Travel time to work - 40 to 59 minutes (%)
Travel time to work - 40 to 59 minutes (% change since 2000)
Travel time to work - 60 to 89 minutes (%)
Travel time to work - 60 to 89 minutes (% change since 2000)
Travel time to work - 90 or more minutes (%)
Travel time to work - 90 or more minutes (% change since 2000)
Marital status - Never married (%)
Marital status - Now married (%)
Marital status - Separated (%)
Marital status - Widowed (%)
Marital status - Divorced (%)
Median family income ($)
Median family income (% change since 2000)
Median non-family income ($)
Median non-family income (% change since 2000)
Median per capita income ($)
Median per capita income (% change since 2000)
Median family income ($) - White
Median family income ($) - Black or African American
Median family income ($) - Asian
Median family income ($) - Hispanic or Latino
Median family income ($) - American Indian and Alaska Native
Median family income ($) - Multirace
Median family income ($) - Other Race
Median year house/condo built
Median year apartment built
Year house built - Built 2005 or later (%)
Year house built - Built 2000 to 2004 (%)
Year house built - Built 1990 to 1999 (%)
Year house built - Built 1980 to 1989 (%)
Year house built - Built 1970 to 1979 (%)
Year house built - Built 1960 to 1969 (%)
Year house built - Built 1950 to 1959 (%)
Year house built - Built 1940 to 1949 (%)
Year house built - Built 1939 or earlier (%)
Average household size
Household density (households per square mile)
Average household size - White
Average household size - Black or African American
Average household size - Asian
Average household size - Hispanic or Latino
Average household size - American Indian and Alaska Native
Average household size - Multirace
Average household size - Other Race
Occupied housing units (%)
Vacant housing units (%)
Owner occupied housing units (%)
Renter occupied housing units (%)
Vacancy status - For rent (%)
Vacancy status - For sale only (%)
Vacancy status - Rented or sold, not occupied (%)
Vacancy status - For seasonal, recreational, or occasional use (%)
Vacancy status - For migrant workers (%)
Vacancy status - Other vacant (%)
Residents with income below the poverty level (%)
Residents with income below 50% of the poverty level (%)
Children below poverty level (%)
Poor families by family type - Married-couple family (%)
Poor families by family type - Male, no wife present (%)
Poor families by family type - Female, no husband present (%)
Poverty status for native-born residents (%)
Poverty status for foreign-born residents (%)
Poverty among high school graduates not in families (%)
Poverty among people who did not graduate high school not in families (%)
Residents with income below the poverty level (%) - White
Residents with income below the poverty level (%) - Black or African American
Residents with income below the poverty level (%) - Asian
Residents with income below the poverty level (%) - Hispanic or Latino
Residents with income below the poverty level (%) - American Indian and Alaska Native
Residents with income below the poverty level (%) - Multirace
Residents with income below the poverty level (%) - Other Race
Air pollution - Air Quality Index (AQI)
Air pollution - CO
Air pollution - NO2
Air pollution - SO2
Air pollution - Ozone
Air pollution - PM10
Air pollution - PM25
Air pollution - Pb
Crime - Murders per 100,000 population
Crime - Rapes per 100,000 population
Crime - Robberies per 100,000 population
Crime - Assaults per 100,000 population
Crime - Burglaries per 100,000 population
Crime - Thefts per 100,000 population
Crime - Auto thefts per 100,000 population
Crime - Arson per 100,000 population
Crime - City-data.com crime index
Crime - Violent crime index
Crime - Property crime index
Crime - Murders per 100,000 population (5 year average)
Crime - Rapes per 100,000 population (5 year average)
Crime - Robberies per 100,000 population (5 year average)
Crime - Assaults per 100,000 population (5 year average)
Crime - Burglaries per 100,000 population (5 year average)
Crime - Thefts per 100,000 population (5 year average)
Crime - Auto thefts per 100,000 population (5 year average)
Crime - Arson per 100,000 population (5 year average)
Crime - City-data.com crime index (5 year average)
Crime - Violent crime index (5 year average)
Crime - Property crime index (5 year average)
1996 Presidential Elections Results (%) - Democratic Party (Clinton)
1996 Presidential Elections Results (%) - Republican Party (Dole)
1996 Presidential Elections Results (%) - Other
2000 Presidential Elections Results (%) - Democratic Party (Gore)
2000 Presidential Elections Results (%) - Republican Party (Bush)
2000 Presidential Elections Results (%) - Other
2004 Presidential Elections Results (%) - Democratic Party (Kerry)
2004 Presidential Elections Results (%) - Republican Party (Bush)
2004 Presidential Elections Results (%) - Other
2008 Presidential Elections Results (%) - Democratic Party (Obama)
2008 Presidential Elections Results (%) - Republican Party (McCain)
2008 Presidential Elections Results (%) - Other
2012 Presidential Elections Results (%) - Democratic Party (Obama)
2012 Presidential Elections Results (%) - Republican Party (Romney)
2012 Presidential Elections Results (%) - Other
2016 Presidential Elections Results (%) - Democratic Party (Clinton)
2016 Presidential Elections Results (%) - Republican Party (Trump)
2016 Presidential Elections Results (%) - Other
2020 Presidential Elections Results (%) - Democratic Party (Biden)
2020 Presidential Elections Results (%) - Republican Party (Trump)
2020 Presidential Elections Results (%) - Other
Ancestries Reported - Arab (%)
Ancestries Reported - Czech (%)
Ancestries Reported - Danish (%)
Ancestries Reported - Dutch (%)
Ancestries Reported - English (%)
Ancestries Reported - French (%)
Ancestries Reported - French Canadian (%)
Ancestries Reported - German (%)
Ancestries Reported - Greek (%)
Ancestries Reported - Hungarian (%)
Ancestries Reported - Irish (%)
Ancestries Reported - Italian (%)
Ancestries Reported - Lithuanian (%)
Ancestries Reported - Norwegian (%)
Ancestries Reported - Polish (%)
Ancestries Reported - Portuguese (%)
Ancestries Reported - Russian (%)
Ancestries Reported - Scotch-Irish (%)
Ancestries Reported - Scottish (%)
Ancestries Reported - Slovak (%)
Ancestries Reported - Subsaharan African (%)
Ancestries Reported - Swedish (%)
Ancestries Reported - Swiss (%)
Ancestries Reported - Ukrainian (%)
Ancestries Reported - United States (%)
Ancestries Reported - Welsh (%)
Ancestries Reported - West Indian (%)
Ancestries Reported - Other (%)
Educational Attainment - No schooling completed (%)
Educational Attainment - Less than high school (%)
Educational Attainment - High school or equivalent (%)
Educational Attainment - Less than 1 year of college (%)
Educational Attainment - 1 or more years of college (%)
Educational Attainment - Associate degree (%)
Educational Attainment - Bachelor's degree (%)
Educational Attainment - Master's degree (%)
Educational Attainment - Professional school degree (%)
Educational Attainment - Doctorate degree (%)
School Enrollment - Nursery, preschool (%)
School Enrollment - Kindergarten (%)
School Enrollment - Grade 1 to 4 (%)
School Enrollment - Grade 5 to 8 (%)
School Enrollment - Grade 9 to 12 (%)
School Enrollment - College undergrad (%)
School Enrollment - Graduate or professional (%)
School Enrollment - Not enrolled in school (%)
School enrollment - Public schools (%)
School enrollment - Private schools (%)
School enrollment - Not enrolled (%)
Median number of rooms in houses and condos
Median number of rooms in apartments
Housing units lacking complete plumbing facilities (%)
Housing units lacking complete kitchen facilities (%)
Density of houses
Urban houses (%)
Rural houses (%)
Households with people 60 years and over (%)
Households with people 65 years and over (%)
Households with people 75 years and over (%)
Households with one or more nonrelatives (%)
Households with no nonrelatives (%)
Population in households (%)
Family households (%)
Nonfamily households (%)
Population in families (%)
Family households with own children (%)
Median number of bedrooms in owner occupied houses
Mean number of bedrooms in owner occupied houses
Median number of bedrooms in renter occupied houses
Mean number of bedrooms in renter occupied houses
Median number of vehichles in owner occupied houses
Mean number of vehichles in owner occupied houses
Median number of vehichles in renter occupied houses
Mean number of vehichles in renter occupied houses
Mortgage status - with mortgage (%)
Mortgage status - with second mortgage (%)
Mortgage status - with home equity loan (%)
Mortgage status - with both second mortgage and home equity loan (%)
Mortgage status - without a mortgage (%)
Average family size
Average family size - White
Average family size - Black or African American
Average family size - Asian
Average family size - Hispanic or Latino
Average family size - American Indian and Alaska Native
Average family size - Multirace
Average family size - Other Race
Geographical mobility - Same house 1 year ago (%)
Geographical mobility - Moved within same county (%)
Geographical mobility - Moved from different county within same state (%)
Geographical mobility - Moved from different state (%)
Geographical mobility - Moved from abroad (%)
Place of birth - Born in state of residence (%)
Place of birth - Born in other state (%)
Place of birth - Native, outside of US (%)
Place of birth - Foreign born (%)
Housing units in structures - 1, detached (%)
Housing units in structures - 1, attached (%)
Housing units in structures - 2 (%)
Housing units in structures - 3 or 4 (%)
Housing units in structures - 5 to 9 (%)
Housing units in structures - 10 to 19 (%)
Housing units in structures - 20 to 49 (%)
Housing units in structures - 50 or more (%)
Housing units in structures - Mobile home (%)
Housing units in structures - Boat, RV, van, etc. (%)
House/condo owner moved in on average (years ago)
Renter moved in on average (years ago)
Year householder moved into unit - Moved in 1999 to March 2000 (%)
Year householder moved into unit - Moved in 1995 to 1998 (%)
Year householder moved into unit - Moved in 1990 to 1994 (%)
Year householder moved into unit - Moved in 1980 to 1989 (%)
Year householder moved into unit - Moved in 1970 to 1979 (%)
Year householder moved into unit - Moved in 1969 or earlier (%)
Means of transportation to work - Drove car alone (%)
Means of transportation to work - Carpooled (%)
Means of transportation to work - Public transportation (%)
Means of transportation to work - Bus or trolley bus (%)
Means of transportation to work - Streetcar or trolley car (%)
Means of transportation to work - Subway or elevated (%)
Means of transportation to work - Railroad (%)
Means of transportation to work - Ferryboat (%)
Means of transportation to work - Taxicab (%)
Means of transportation to work - Motorcycle (%)
Means of transportation to work - Bicycle (%)
Means of transportation to work - Walked (%)
Means of transportation to work - Other means (%)
Working at home (%)
Industry diversity
Most Common Industries - Agriculture, forestry, fishing and hunting, and mining (%)
Most Common Industries - Agriculture, forestry, fishing and hunting (%)
Most Common Industries - Mining, quarrying, and oil and gas extraction (%)
Most Common Industries - Construction (%)
Most Common Industries - Manufacturing (%)
Most Common Industries - Wholesale trade (%)
Most Common Industries - Retail trade (%)
Most Common Industries - Transportation and warehousing, and utilities (%)
Most Common Industries - Transportation and warehousing (%)
Most Common Industries - Utilities (%)
Most Common Industries - Information (%)
Most Common Industries - Finance and insurance, and real estate and rental and leasing (%)
Most Common Industries - Finance and insurance (%)
Most Common Industries - Real estate and rental and leasing (%)
Most Common Industries - Professional, scientific, and management, and administrative and waste management services (%)
Most Common Industries - Professional, scientific, and technical services (%)
Most Common Industries - Management of companies and enterprises (%)
Most Common Industries - Administrative and support and waste management services (%)
Most Common Industries - Educational services, and health care and social assistance (%)
Most Common Industries - Educational services (%)
Most Common Industries - Health care and social assistance (%)
Most Common Industries - Arts, entertainment, and recreation, and accommodation and food services (%)
Most Common Industries - Arts, entertainment, and recreation (%)
Most Common Industries - Accommodation and food services (%)
Most Common Industries - Other services, except public administration (%)
Most Common Industries - Public administration (%)
Occupation diversity
Most Common Occupations - Management, business, science, and arts occupations (%)
Most Common Occupations - Management, business, and financial occupations (%)
Most Common Occupations - Management occupations (%)
Most Common Occupations - Business and financial operations occupations (%)
Most Common Occupations - Computer, engineering, and science occupations (%)
Most Common Occupations - Computer and mathematical occupations (%)
Most Common Occupations - Architecture and engineering occupations (%)
Most Common Occupations - Life, physical, and social science occupations (%)
Most Common Occupations - Education, legal, community service, arts, and media occupations (%)
Most Common Occupations - Community and social service occupations (%)
Most Common Occupations - Legal occupations (%)
Most Common Occupations - Education, training, and library occupations (%)
Most Common Occupations - Arts, design, entertainment, sports, and media occupations (%)
Most Common Occupations - Healthcare practitioners and technical occupations (%)
Most Common Occupations - Health diagnosing and treating practitioners and other technical occupations (%)
Most Common Occupations - Health technologists and technicians (%)
Most Common Occupations - Service occupations (%)
Most Common Occupations - Healthcare support occupations (%)
Most Common Occupations - Protective service occupations (%)
Most Common Occupations - Fire fighting and prevention, and other protective service workers including supervisors (%)
Most Common Occupations - Law enforcement workers including supervisors (%)
Most Common Occupations - Food preparation and serving related occupations (%)
Most Common Occupations - Building and grounds cleaning and maintenance occupations (%)
Most Common Occupations - Personal care and service occupations (%)
Most Common Occupations - Sales and office occupations (%)
Most Common Occupations - Sales and related occupations (%)
Most Common Occupations - Office and administrative support occupations (%)
Most Common Occupations - Natural resources, construction, and maintenance occupations (%)
Most Common Occupations - Farming, fishing, and forestry occupations (%)
Most Common Occupations - Construction and extraction occupations (%)
Most Common Occupations - Installation, maintenance, and repair occupations (%)
Most Common Occupations - Production, transportation, and material moving occupations (%)
Most Common Occupations - Production occupations (%)
Most Common Occupations - Transportation occupations (%)
Most Common Occupations - Material moving occupations (%)
People in Group quarters - Institutionalized population (%)
People in Group quarters - Correctional institutions (%)
People in Group quarters - Federal prisons and detention centers (%)
People in Group quarters - Halfway houses (%)
People in Group quarters - Local jails and other confinement facilities (including police lockups) (%)
People in Group quarters - Military disciplinary barracks (%)
People in Group quarters - State prisons (%)
People in Group quarters - Other types of correctional institutions (%)
People in Group quarters - Nursing homes (%)
People in Group quarters - Hospitals/wards, hospices, and schools for the handicapped (%)
People in Group quarters - Hospitals/wards and hospices for chronically ill (%)
People in Group quarters - Hospices or homes for chronically ill (%)
People in Group quarters - Military hospitals or wards for chronically ill (%)
People in Group quarters - Other hospitals or wards for chronically ill (%)
People in Group quarters - Hospitals or wards for drug/alcohol abuse (%)
People in Group quarters - Mental (Psychiatric) hospitals or wards (%)
People in Group quarters - Schools, hospitals, or wards for the mentally retarded (%)
People in Group quarters - Schools, hospitals, or wards for the physically handicapped (%)
People in Group quarters - Institutions for the deaf (%)
People in Group quarters - Institutions for the blind (%)
People in Group quarters - Orthopedic wards and institutions for the physically handicapped (%)
People in Group quarters - Wards in general hospitals for patients who have no usual home elsewhere (%)
People in Group quarters - Wards in military hospitals for patients who have no usual home elsewhere (%)
People in Group quarters - Juvenile institutions (%)
People in Group quarters - Long-term care (%)
People in Group quarters - Homes for abused, dependent, and neglected children (%)
People in Group quarters - Residential treatment centers for emotionally disturbed children (%)
People in Group quarters - Training schools for juvenile delinquents (%)
People in Group quarters - Short-term care, detention or diagnostic centers for delinquent children (%)
People in Group quarters - Type of juvenile institution unknown (%)
People in Group quarters - Noninstitutionalized population (%)
People in Group quarters - College dormitories (includes college quarters off campus) (%)
People in Group quarters - Military quarters (%)
People in Group quarters - On base (%)
People in Group quarters - Barracks, unaccompanied personnel housing (UPH), (Enlisted/Officer), ;and similar group living quarters for military personnel (%)
People in Group quarters - Transient quarters for temporary residents (%)
People in Group quarters - Military ships (%)
People in Group quarters - Group homes (%)
People in Group quarters - Homes or halfway houses for drug/alcohol abuse (%)
People in Group quarters - Homes for the mentally ill (%)
People in Group quarters - Homes for the mentally retarded (%)
People in Group quarters - Homes for the physically handicapped (%)
People in Group quarters - Other group homes (%)
People in Group quarters - Religious group quarters (%)
People in Group quarters - Dormitories (%)
People in Group quarters - Agriculture workers' dormitories on farms (%)
People in Group quarters - Job Corps and vocational training facilities (%)
People in Group quarters - Other workers' dormitories (%)
People in Group quarters - Crews of maritime vessels (%)
People in Group quarters - Other nonhousehold living situations (%)
People in Group quarters - Other noninstitutional group quarters (%)
Residents speaking English at home (%)
Residents speaking English at home - Born in the United States (%)
Residents speaking English at home - Native, born elsewhere (%)
Residents speaking English at home - Foreign born (%)
Residents speaking Spanish at home (%)
Residents speaking Spanish at home - Born in the United States (%)
Residents speaking Spanish at home - Native, born elsewhere (%)
Residents speaking Spanish at home - Foreign born (%)
Residents speaking other language at home (%)
Residents speaking other language at home - Born in the United States (%)
Residents speaking other language at home - Native, born elsewhere (%)
Residents speaking other language at home - Foreign born (%)
Class of Workers - Employee of private company (%)
Class of Workers - Self-employed in own incorporated business (%)
Class of Workers - Private not-for-profit wage and salary workers (%)
Class of Workers - Local government workers (%)
Class of Workers - State government workers (%)
Class of Workers - Federal government workers (%)
Class of Workers - Self-employed workers in own not incorporated business and Unpaid family workers (%)
House heating fuel used in houses and condos - Utility gas (%)
House heating fuel used in houses and condos - Bottled, tank, or LP gas (%)
House heating fuel used in houses and condos - Electricity (%)
House heating fuel used in houses and condos - Fuel oil, kerosene, etc. (%)
House heating fuel used in houses and condos - Coal or coke (%)
House heating fuel used in houses and condos - Wood (%)
House heating fuel used in houses and condos - Solar energy (%)
House heating fuel used in houses and condos - Other fuel (%)
House heating fuel used in houses and condos - No fuel used (%)
House heating fuel used in apartments - Utility gas (%)
House heating fuel used in apartments - Bottled, tank, or LP gas (%)
House heating fuel used in apartments - Electricity (%)
House heating fuel used in apartments - Fuel oil, kerosene, etc. (%)
House heating fuel used in apartments - Coal or coke (%)
House heating fuel used in apartments - Wood (%)
House heating fuel used in apartments - Solar energy (%)
House heating fuel used in apartments - Other fuel (%)
House heating fuel used in apartments - No fuel used (%)
Armed forces status - In Armed Forces (%)
Armed forces status - Civilian (%)
Armed forces status - Civilian - Veteran (%)
Armed forces status - Civilian - Nonveteran (%)
Fatal accidents locations in years 2005-2021
Fatal accidents locations in 2005
Fatal accidents locations in 2006
Fatal accidents locations in 2007
Fatal accidents locations in 2008
Fatal accidents locations in 2009
Fatal accidents locations in 2010
Fatal accidents locations in 2011
Fatal accidents locations in 2012
Fatal accidents locations in 2013
Fatal accidents locations in 2014
Fatal accidents locations in 2015
Fatal accidents locations in 2016
Fatal accidents locations in 2017
Fatal accidents locations in 2018
Fatal accidents locations in 2019
Fatal accidents locations in 2020
Fatal accidents locations in 2021
Alcohol use - People drinking some alcohol every month (%)
Alcohol use - People not drinking at all (%)
Alcohol use - Average days/month drinking alcohol
Alcohol use - Average drinks/week
Alcohol use - Average days/year people drink much
Audiometry - Average condition of hearing (%)
Audiometry - People that can hear a whisper from across a quiet room (%)
Audiometry - People that can hear normal voice from across a quiet room (%)
Audiometry - Ears ringing, roaring, buzzing (%)
Audiometry - Had a job exposure to loud noise (%)
Audiometry - Had off-work exposure to loud noise (%)
Blood Pressure & Cholesterol - Has high blood pressure (%)
Blood Pressure & Cholesterol - Checking blood pressure at home (%)
Blood Pressure & Cholesterol - Frequently checking blood cholesterol (%)
Blood Pressure & Cholesterol - Has high cholesterol level (%)
Consumer Behavior - Money monthly spent on food at supermarket/grocery store
Consumer Behavior - Money monthly spent on food at other stores
Consumer Behavior - Money monthly spent on eating out
Consumer Behavior - Money monthly spent on carryout/delivered foods
Consumer Behavior - Income spent on food at supermarket/grocery store (%)
Consumer Behavior - Income spent on food at other stores (%)
Consumer Behavior - Income spent on eating out (%)
Consumer Behavior - Income spent on carryout/delivered foods (%)
Current Health Status - General health condition (%)
Current Health Status - Blood donors (%)
Current Health Status - Has blood ever tested for HIV virus (%)
Current Health Status - Left-handed people (%)
Dermatology - People using sunscreen (%)
Diabetes - Diabetics (%)
Diabetes - Had a blood test for high blood sugar (%)
Diabetes - People taking insulin (%)
Diet Behavior & Nutrition - Diet health (%)
Diet Behavior & Nutrition - Milk product consumption (# of products/month)
Diet Behavior & Nutrition - Meals not home prepared (#/week)
Diet Behavior & Nutrition - Meals from fast food or pizza place (#/week)
Diet Behavior & Nutrition - Ready-to-eat foods (#/month)
Diet Behavior & Nutrition - Frozen meals/pizza (#/month)
Drug Use - People that ever used marijuana or hashish (%)
Drug Use - Ever used hard drugs (%)
Drug Use - Ever used any form of cocaine (%)
Drug Use - Ever used heroin (%)
Drug Use - Ever used methamphetamine (%)
Health Insurance - People covered by health insurance (%)
Kidney Conditions-Urology - Avg. # of times urinating at night
Medical Conditions - People with asthma (%)
Medical Conditions - People with anemia (%)
Medical Conditions - People with psoriasis (%)
Medical Conditions - People with overweight (%)
Medical Conditions - Elderly people having difficulties in thinking or remembering (%)
Medical Conditions - People who ever received blood transfusion (%)
Medical Conditions - People having trouble seeing even with glass/contacts (%)
Medical Conditions - People with arthritis (%)
Medical Conditions - People with gout (%)
Medical Conditions - People with congestive heart failure (%)
Medical Conditions - People with coronary heart disease (%)
Medical Conditions - People with angina pectoris (%)
Medical Conditions - People who ever had heart attack (%)
Medical Conditions - People who ever had stroke (%)
Medical Conditions - People with emphysema (%)
Medical Conditions - People with thyroid problem (%)
Medical Conditions - People with chronic bronchitis (%)
Medical Conditions - People with any liver condition (%)
Medical Conditions - People who ever had cancer or malignancy (%)
Mental Health - People who have little interest in doing things (%)
Mental Health - People feeling down, depressed, or hopeless (%)
Mental Health - People who have trouble sleeping or sleeping too much (%)
Mental Health - People feeling tired or having little energy (%)
Mental Health - People with poor appetite or overeating (%)
Mental Health - People feeling bad about themself (%)
Mental Health - People who have trouble concentrating on things (%)
Mental Health - People moving or speaking slowly or too fast (%)
Mental Health - People having thoughts they would be better off dead (%)
Oral Health - Average years since last visit a dentist
Oral Health - People embarrassed because of mouth (%)
Oral Health - People with gum disease (%)
Oral Health - General health of teeth and gums (%)
Oral Health - Average days a week using dental floss/device
Oral Health - Average days a week using mouthwash for dental problem
Oral Health - Average number of teeth
Pesticide Use - Households using pesticides to control insects (%)
Pesticide Use - Households using pesticides to kill weeds (%)
Physical Activity - People doing vigorous-intensity work activities (%)
Physical Activity - People doing moderate-intensity work activities (%)
Physical Activity - People walking or bicycling (%)
Physical Activity - People doing vigorous-intensity recreational activities (%)
Physical Activity - People doing moderate-intensity recreational activities (%)
Physical Activity - Average hours a day doing sedentary activities
Physical Activity - Average hours a day watching TV or videos
Physical Activity - Average hours a day using computer
Physical Functioning - People having limitations keeping them from working (%)
Physical Functioning - People limited in amount of work they can do (%)
Physical Functioning - People that need special equipment to walk (%)
Physical Functioning - People experiencing confusion/memory problems (%)
Physical Functioning - People requiring special healthcare equipment (%)
Prescription Medications - Average number of prescription medicines taking
Preventive Aspirin Use - Adults 40+ taking low-dose aspirin (%)
Reproductive Health - Vaginal deliveries (%)
Reproductive Health - Cesarean deliveries (%)
Reproductive Health - Deliveries resulted in a live birth (%)
Reproductive Health - Pregnancies resulted in a delivery (%)
Reproductive Health - Women breastfeeding newborns (%)
Reproductive Health - Women that had a hysterectomy (%)
Reproductive Health - Women that had both ovaries removed (%)
Reproductive Health - Women that have ever taken birth control pills (%)
Reproductive Health - Women taking birth control pills (%)
Reproductive Health - Women that have ever used Depo-Provera or injectables (%)
Reproductive Health - Women that have ever used female hormones (%)
Sexual Behavior - People 18+ that ever had sex (vaginal, anal, or oral) (%)
Sexual Behavior - Males 18+ that ever had vaginal sex with a woman (%)
Sexual Behavior - Males 18+ that ever performed oral sex on a woman (%)
Sexual Behavior - Males 18+ that ever had anal sex with a woman (%)
Sexual Behavior - Males 18+ that ever had any sex with a man (%)
Sexual Behavior - Females 18+ that ever had vaginal sex with a man (%)
Sexual Behavior - Females 18+ that ever performed oral sex on a man (%)
Sexual Behavior - Females 18+ that ever had anal sex with a man (%)
Sexual Behavior - Females 18+ that ever had any kind of sex with a woman (%)
Sexual Behavior - Average age people first had sex
Sexual Behavior - Average number of female sex partners in lifetime (males 18+)
Sexual Behavior - Average number of female vaginal sex partners in lifetime (males 18+)
Sexual Behavior - Average age people first performed oral sex on a woman (18+)
Sexual Behavior - Average number of woman performed oral sex on in lifetime (18+)
Sexual Behavior - Average number of male sex partners in lifetime (males 18+)
Sexual Behavior - Average number of male anal sex partners in lifetime (males 18+)
Sexual Behavior - Average age people first performed oral sex on a man (18+)
Sexual Behavior - Average number of male oral sex partners in lifetime (18+)
Sexual Behavior - People using protection when performing oral sex (%)
Sexual Behavior - Average number of times people have vaginal or anal sex a year
Sexual Behavior - People having sex without condom (%)
Sexual Behavior - Average number of male sex partners in lifetime (females 18+)
Sexual Behavior - Average number of male vaginal sex partners in lifetime (females 18+)
Sexual Behavior - Average number of female sex partners in lifetime (females 18+)
Sexual Behavior - Circumcised males 18+ (%)
Sleep Disorders - Average hours sleeping at night
Sleep Disorders - People that has trouble sleeping (%)
Smoking-Cigarette Use - People smoking cigarettes (%)
Taste & Smell - People 40+ having problems with smell (%)
Taste & Smell - People 40+ having problems with taste (%)
Taste & Smell - People 40+ that ever had wisdom teeth removed (%)
Taste & Smell - People 40+ that ever had tonsils teeth removed (%)
Taste & Smell - People 40+ that ever had a loss of consciousness because of a head injury (%)
Taste & Smell - People 40+ that ever had a broken nose or other serious injury to face or skull (%)
Taste & Smell - People 40+ that ever had two or more sinus infections (%)
Weight - Average height (inches)
Weight - Average weight (pounds)
Weight - Average BMI
Weight - People that are obese (%)
Weight - People that ever were obese (%)
Weight - People trying to lose weight (%)
Urban population: 23,498
Rural population: 11,018
Estimated median house/condo value in 2022: $265,680
75605:
$265,680Texas:
$275,400
According to our research of Texas and other state lists, there were 56 registered sex offenders living in 75605 zip code as of May 08, 2024 . The ratio of all residents to sex offenders in zip code 75605 is 530 to 1.The ratio of registered sex offenders to all residents in this zip code is near the state average.
Median resident age: This zip code:
39.5 yearsTexas median age:
35.6 years
Average household size: This zip code:
2.2 peopleTexas:
2.6 people
Averages for the 2020 tax year for zip code 75605, filed in 2021:
Average Adjusted Gross Income (AGI) in 2020: $79,402 (Individual Income Tax Returns) Here:
$79,402State:
$77,054
Salary/wage: $64,273 (reported on 80.2% of returns )Here:
$64,273State:
$62,766
(% of AGI for various income ranges: 1237.4% for AGIs below $25k , 3374.8% for AGIs $25k-50k , 6093.1% for AGIs $50k-75k , 8995.2% for AGIs $75k-100k , 16499.6% for AGIs $100k-200k , 66959.4% for AGIs over 200k ) Taxable interest for individuals: $2,392 (reported on 36.8% of returns )This zip code:
$2,392Texas:
$2,665
(% of AGI for various income ranges: 21.1% for AGIs below $25k , 27.6% for AGIs $25k-50k , 53.2% for AGIs $50k-75k , 118.6% for AGIs $75k-100k , 181.9% for AGIs $100k-200k , 2183.8% for AGIs over 200k ) Ordinary dividends: $8,749 (reported on 20.0% of returns )(% of AGI for various income ranges: 28.2% for AGIs below $25k , 48.0% for AGIs $25k-50k , 128.2% for AGIs $50k-75k , 235.9% for AGIs $75k-100k , 431.6% for AGIs $100k-200k , 4125.3% for AGIs over 200k ) Net capital gain/loss in AGI: +$19,899 (reported on 19.8% of returns )Here:
+$19,899State:
+$39,590
(% of AGI for various income ranges: 11.3% for AGIs below $25k , 34.9% for AGIs $25k-50k , 123.1% for AGIs $50k-75k , 184.0% for AGIs $75k-100k , 675.4% for AGIs $100k-200k , 13619.4% for AGIs over 200k ) Profit/loss from business: +$9,422 (reported on 20.0% of returns )Here:
+$9,422State:
+$10,888
(% of AGI for various income ranges: 38.6% for AGIs below $25k , 92.1% for AGIs $25k-50k , 121.4% for AGIs $50k-75k , 222.8% for AGIs $75k-100k , 450.2% for AGIs $100k-200k , 4273.8% for AGIs over 200k ) Taxable individual retirement arrangement distribution: $21,580 (reported on 12.0% of returns )75605:
$21,580Texas:
$24,740
(% of AGI for various income ranges: 79.3% for AGIs below $25k , 139.2% for AGIs $25k-50k , 311.2% for AGIs $50k-75k , 537.8% for AGIs $75k-100k , 929.1% for AGIs $100k-200k , 2738.4% for AGIs over 200k ) Self-employed (Keogh) retirement plans: $23,417 (reported on 0.4% of returns )75605:
$23,417Texas:
$29,298
(% of AGI for various income ranges: 11.9% for AGIs $25k-50k , 337.2% for AGIs over 200k ) Total itemized deductions: $42,275 (reported on 8.8% of returns )Here:
$42,275State:
$40,428
(% of AGI for various income ranges: 52.8% for AGIs below $25k , 125.1% for AGIs $25k-50k , 375.9% for AGIs $50k-75k , 626.7% for AGIs $75k-100k , 994.5% for AGIs $100k-200k , 7388.1% for AGIs over 200k ) Charity contributions: $18,859 (reported on 7.3% of returns )Here:
$18,859State:
$18,201
(% of AGI for various income ranges: 4.3% for AGIs below $25k , 17.9% for AGIs $25k-50k , 72.9% for AGIs $50k-75k , 102.8% for AGIs $75k-100k , 349.0% for AGIs $100k-200k , 4001.6% for AGIs over 200k ) Taxes paid: $7,040 (reported on 8.4% of returns )(% of AGI for various income ranges: 7.3% for AGIs below $25k , 19.1% for AGIs $25k-50k , 57.3% for AGIs $50k-75k , 77.4% for AGIs $75k-100k , 200.7% for AGIs $100k-200k , 1088.8% for AGIs over 200k ) Earned income credit: $2,324 (reported on 15.2% of returns )(% of AGI for various income ranges: 97.0% for AGIs below $25k , 65.5% for AGIs $25k-50k , 1.8% for AGIs $50k-75k ) Percentage of individuals using paid preparers for their 2020 taxes: 93.3%(% for various income ranges: 92.0% for AGIs below $25k , 94.1% for AGIs $25k-50k , 93.8% for AGIs $50k-75k , 93.8% for AGIs $75k-100k , 93.5% for AGIs $100k-200k , 95.3% for AGIs over 200k )
Averages for the 2012 tax year for zip code 75605, filed in 2013:
Average Adjusted Gross Income (AGI) in 2012: $79,574 (Individual Income Tax Returns) Here:
$79,574State:
$65,384
Salary/wage: $58,944 (reported on 82.8% of returns )Here:
$58,944State:
$52,524
(% of AGI for various income ranges: 74.6% for AGIs below $25k , 77.5% for AGIs $25k-50k , 76.0% for AGIs $50k-75k , 77.2% for AGIs $75k-100k , 78.3% for AGIs $100k-200k , 36.5% for AGIs over 200k ) Taxable interest for individuals: $2,015 (reported on 37.9% of returns )This zip code:
$2,015Texas:
$2,372
(% of AGI for various income ranges: 1.7% for AGIs below $25k , 0.8% for AGIs $25k-50k , 0.9% for AGIs $50k-75k , 0.7% for AGIs $75k-100k , 0.7% for AGIs $100k-200k , 1.1% for AGIs over 200k ) Ordinary dividends: $6,684 (reported on 20.7% of returns )(% of AGI for various income ranges: 2.0% for AGIs below $25k , 1.3% for AGIs $25k-50k , 1.5% for AGIs $50k-75k , 1.2% for AGIs $75k-100k , 1.1% for AGIs $100k-200k , 2.4% for AGIs over 200k ) Net capital gain/loss in AGI: +$23,730 (reported on 17.5% of returns )Here:
+$23,730State:
+$35,319
(% of AGI for various income ranges: 0.3% for AGIs $25k-50k , 0.8% for AGIs $50k-75k , 1.0% for AGIs $75k-100k , 1.1% for AGIs $100k-200k , 12.1% for AGIs over 200k ) Profit/loss from business: +$19,829 (reported on 17.6% of returns )Here:
+$19,829State:
+$13,732
(% of AGI for various income ranges: 6.3% for AGIs below $25k , 3.1% for AGIs $25k-50k , 2.8% for AGIs $50k-75k , 2.6% for AGIs $75k-100k , 4.2% for AGIs $100k-200k , 5.6% for AGIs over 200k ) Taxable individual retirement arrangement distribution: $19,613 (reported on 12.7% of returns )75605:
$19,613Texas:
$19,511
(% of AGI for various income ranges: 4.3% for AGIs below $25k , 3.5% for AGIs $25k-50k , 3.5% for AGIs $50k-75k , 3.6% for AGIs $75k-100k , 3.2% for AGIs $100k-200k , 2.6% for AGIs over 200k ) Self-employment retirement plans: $21,578 (reported on 0.7% of returns )75605:
$21,578Texas:
$23,938
Total itemized deductions: $26,160 (15% of AGI, reported on 30.2% of returns )Here:
$26,160State:
$24,724
Here:
15.5% of AGIState:
15.9% of AGI
(% of AGI for various income ranges: 9.7% for AGIs below $25k , 9.4% for AGIs $25k-50k , 11.0% for AGIs $50k-75k , 10.9% for AGIs $75k-100k , 11.9% for AGIs $100k-200k , 8.3% for AGIs over 200k ) Charity contributions: $8,244 (reported on 24.8% of returns )(% of AGI for various income ranges: 1.3% for AGIs below $25k , 1.5% for AGIs $25k-50k , 2.3% for AGIs $50k-75k , 2.3% for AGIs $75k-100k , 3.3% for AGIs $100k-200k , 2.7% for AGIs over 200k ) Taxes paid: $5,643 (reported on 29.5% of returns )(% of AGI for various income ranges: 1.5% for AGIs below $25k , 1.8% for AGIs $25k-50k , 2.3% for AGIs $50k-75k , 2.5% for AGIs $75k-100k , 3.0% for AGIs $100k-200k , 1.6% for AGIs over 200k ) Earned income credit: $2,147 (reported on 13.7% of returns )(% of AGI for various income ranges: 5.3% for AGIs below $25k , 0.9% for AGIs $25k-50k ) Percentage of individuals using paid preparers for their 2012 taxes: 53.4%(% for various income ranges: 47.3% for AGIs below $25k , 51.2% for AGIs $25k-50k , 55.8% for AGIs $50k-75k , 54.7% for AGIs $75k-100k , 59.9% for AGIs $100k-200k , 79.4% for AGIs over 200k )
Averages for the 2004 tax year for zip code 75605, filed in 2005:
Average Adjusted Gross Income (AGI) in 2004: $53,030 (Individual Income Tax Returns) Here:
$53,030State:
$47,881
Salary/wage: $44,202 (reported on 82.1% of returns )Here:
$44,202State:
$41,947
(% of AGI for various income ranges: 194.5% for AGIs below $10k , 73.2% for AGIs $10k-25k , 77.0% for AGIs $25k-50k , 78.0% for AGIs $50k-75k , 79.1% for AGIs $75k-100k , 55.1% for AGIs over 100k ) Taxable interest for individuals: $2,046 (reported on 47.5% of returns )This zip code:
$2,046Texas:
$2,255
(% of AGI for various income ranges: 17.2% for AGIs below $10k , 3.4% for AGIs $10k-25k , 2.1% for AGIs $25k-50k , 1.8% for AGIs $50k-75k , 1.5% for AGIs $75k-100k , 1.3% for AGIs over 100k ) Taxable dividends: $2,977 (reported on 27.3% of returns )(% of AGI for various income ranges: 9.8% for AGIs below $10k , 1.7% for AGIs $10k-25k , 1.2% for AGIs $25k-50k , 1.2% for AGIs $50k-75k , 1.2% for AGIs $75k-100k , 1.7% for AGIs over 100k ) Net capital gain/loss: +$9,837 (reported on 21.9% of returns )Here:
+$9,837State:
+$16,110
(% of AGI for various income ranges: -4.8% for AGIs below $10k , 0.3% for AGIs $10k-25k , 0.2% for AGIs $25k-50k , 0.6% for AGIs $50k-75k , 1.8% for AGIs $75k-100k , 8.4% for AGIs over 100k ) Profit/loss from business: +$14,848 (reported on 18.2% of returns )Here:
+$14,848State:
+$11,013
(% of AGI for various income ranges: 0.0% for AGIs below $10k , 5.2% for AGIs $10k-25k , 2.4% for AGIs $25k-50k , 3.5% for AGIs $50k-75k , 3.1% for AGIs $75k-100k , 7.4% for AGIs over 100k ) IRA payment deduction: $3,342 (reported on 2.7% of returns )(% of AGI for various income ranges: 0.2% for AGIs $10k-25k , 0.2% for AGIs $25k-50k , 0.2% for AGIs $50k-75k , 0.2% for AGIs $75k-100k , 0.1% for AGIs over 100k ) Self-employed pension: $16,870 (reported on 1.0% of returns )Here:
$16,870Texas:
$16,401
(% of AGI for various income ranges: 0.1% for AGIs $50k-75k , 0.1% for AGIs $75k-100k , 0.6% for AGIs over 100k ) Total itemized deductions: $19,117 (19% of AGI, reported on 29.1% of returns )Here:
$19,117State:
$19,631
Here:
19.0% of AGIState:
18.9% of AGI
(% of AGI for various income ranges: 26.6% for AGIs below $10k , 8.7% for AGIs $10k-25k , 9.7% for AGIs $25k-50k , 11.3% for AGIs $50k-75k , 13.1% for AGIs $75k-100k , 9.6% for AGIs over 100k ) Charity contributions deductions: $6,124 (6% of AGI, reported on 25.6% of returns )Here:
5.8% of AGIState:
4.2% of AGI
(% of AGI for various income ranges: 2.3% for AGIs below $10k , 1.2% for AGIs $10k-25k , 2.0% for AGIs $25k-50k , 2.6% for AGIs $50k-75k , 3.3% for AGIs $75k-100k , 3.6% for AGIs over 100k ) Total tax: $9,672 (reported on 76.5% of returns )(% of AGI for various income ranges: 6.6% for AGIs below $10k , 4.2% for AGIs $10k-25k , 7.0% for AGIs $25k-50k , 9.1% for AGIs $50k-75k , 10.9% for AGIs $75k-100k , 21.1% for AGIs over 100k ) Earned income credit: $1,711 (reported on 13.1% of returns )Percentage of individuals using paid preparers for their 2004 taxes: 58.0%(% for various income ranges: 49.6% for AGIs below $10k , 59.8% for AGIs $10k-25k , 59.1% for AGIs $25k-50k , 60.1% for AGIs $50k-75k , 57.1% for AGIs $75k-100k , 65.3% for AGIs over 100k )
Estimated median household income in 2022: This zip code:
$72,825Texas:
$72,284
Nearest zip codes: 75601 ,
75604 ,
75640 ,
75693 ,
75602 ,
75603 .
Longview Zip Code Map
Percentage of family households: This zip code:
42.4%Texas:
50.5%
Percentage of households with unmarried partners: This zip code:
3.3%Texas:
48.7%
Likely homosexual households (counted as self-reported same-sex unmarried-partner households)
Lesbian couples: 0.1% of all households Gay men: 0.1% of all households
Household received Food Stamps/SNAP in the past 12 months: 1,061Household did not receive Food Stamps/SNAP in the past 12 months: 14,478
Women who had a birth in the past 12 months: 438 (182 now married , 249 unmarried) Women who did not have a birth in the past 12 months: 7,777 (3,709 now married , 4,058 unmarried)
Housing units in zip code 75605 with a mortgage: 5,012 (178
second mortgage , 28
home equity loan , 158
both second mortgage and home equity loan )
Houses without a mortgage: 87
Median monthly owner costs for units with a mortgage: $1,653
Median monthly owner costs for units without a mortgage: $632
Residents with income below the poverty level in 2022:
This zip code:
12.3%Whole state:
14.0%
Residents with income below 50% of the poverty level in 2022:
This zip code:
5.0%Whole state:
7.4%
Median number of rooms in houses and condos: Median number of rooms in apartments: Notable locations in this zip code not listed on our city pages
Click to draw/clear zip code borders Notable locations in zip code 75605: (A) , West Harrison Volunteer Fire Department Station 2 (B) , West Harrison Volunteer Fire Department Station 3 (C) , Longview Fire Department / Emergency Medical Services Station 8 (D) , Judson Metro Volunteer Fire Department (E) . Display/hide their locations on the map
Shopping Center: (1) . Display/hide its location on the map
Churches in zip code 75605 include: (A) , Summerfield Church (B) , Temple Emanu-el (C) , Winterfield Church (D) , Alpine Church (E) , Forest Hill Church (F) , Free Holiness Church (G) , Hebron Church (H) , Judson Church (I) . Display/hide their locations on the map
Cemeteries: (1) , Davis Cemetery (2) , George Cemetery (3) , Ray Cemetery (4) , Lily Hill Cemetery (5) . Display/hide their locations on the map
Reservoirs: (A) , Williams Lake (B) , Williams Lakes (C) , Virginia Lakes (D) , Little Lake (E) , Whitehurst Lake (F) , French Lake (G) , Stone Lake (H) . Display/hide their locations on the map
Streams, rivers, and creeks: (A) , School Branch (B) , Panther Creek (C) , Eagle Creek (D) , Elm Branch (E) , Flewelen Branch (F) , Glade Creek (G) , Hamby Branch (H) , Hog Branch (I) . Display/hide their locations on the map
Parks in zip code 75605 include: (1) , Akin Park (2) . Display/hide their locations on the map
Year house built (houses)
73 2020 or later3,192 2010 to 20192,174 2000 to 20092,564 1990 to 19992,987 1980 to 19893,646 1970 to 19791,054 1960 to 1969350 1950 to 1959112 1940 to 194966 1939 or earlier
Zip code 75605 household income distribution in 2022 905 Less than $10,000443 $10,000 to $14,999454 $15,000 to $19,999551 $20,000 to $24,999777 $25,000 to $29,999646 $30,000 to $34,999528 $35,000 to $39,999456 $40,000 to $44,999450 $45,000 to $49,9991,075 $50,000 to $59,9991,743 $60,000 to $74,9991,799 $75,000 to $99,9991,873 $100,000 to $124,9991,031 $125,000 to $149,9991,535 $150,000 to $199,9991,298 $200,000 or moreEstimate of home value of owner-occupied houses/condos in 2022 in zip code 75605 39 Less than $10,0007 $10,000 to $14,99961 $15,000 to $19,99923 $20,000 to $24,9996 $35,000 to $39,99942 $40,000 to $49,99957 $50,000 to $59,99928 $60,000 to $69,99989 $70,000 to $79,99974 $80,000 to $89,99917 $90,000 to $99,999295 $100,000 to $124,999287 $125,000 to $149,999851 $150,000 to $174,999977 $175,000 to $199,9991,309 $200,000 to $249,9991,437 $250,000 to $299,9991,000 $300,000 to $399,999715 $400,000 to $499,999612 $500,000 to $749,999212 $750,000 to $999,999217 $1,000,000 to $1,499,99922 $1,500,000 to $1,999,99966 $2,000,000 or moreRent paid by renters in 2022 in zip code 75605 33 Less than $100152 $200 to $24935 $350 to $39912 $450 to $49910 $500 to $54994 $550 to $599381 $600 to $649416 $650 to $699187 $700 to $749462 $750 to $7991,235 $800 to $899487 $900 to $9991,065 $1,000 to $1,249983 $1,250 to $1,499957 $1,500 to $1,999198 $2,000 to $2,49988 $2,500 to $2,99913 $3,000 to $3,49973 $3,500 or more27 No cash rent
Median gross rent in 2022: $1,182.
Median price asked for vacant for-sale houses and condos in 2022: $216,159.
Estimated median house (or condo) value in 2022 for: White Non-Hispanic householders: $277,929Black or African American householders: $239,275Asian householders: $231,381Some other race householders: $306,239Two or more races householders: $321,755Hispanic or Latino householders: $258,602Estimated median house or condo value in 2022: $265,680
75605:
$265,680Texas:
$275,400
Lower value quartile - upper value quartile: $202,015 - $362,212
Mean price in 2022: Detached houses: $341,234Here:
$341,234State:
$369,058
Townhouses or other attached units: $189,860Here:
$189,860State:
$327,631
Mobile homes: $62,198Here:
$62,198State:
$124,413
Housing units in structures:
One, detached: 9,725One, attached: 446Two: 2803 or 4: 8515 to 9: 1,32410 to 19: 1,14820 to 49: 74950 or more: 1,696Mobile homes: 562Unemployment : 2.1%
Means of transportation to work in zip code 75605 82.5% 15,049 Drove a car alone6.7% 1,216 Carpooled0.1% 11 Motorcycle0.3% 58 Bicycle0.7% 136 Walked0.4% 68 Other means6.6% 1,210 Worked at homeTravel time to work (commute) in zip code 75605 670 Less than 5 minutes2,249 5 to 9 minutes3,660 10 to 14 minutes3,293 15 to 19 minutes2,572 20 to 24 minutes756 25 to 29 minutes984 30 to 34 minutes213 35 to 39 minutes208 40 to 44 minutes740 45 to 59 minutes683 60 to 89 minutes598 90 or more minutes
Percentage of zip code residents living and working in this county: 77.0%
Household type by relationship:
Households: 34,517
Male householders: 7,590 (2,271 living alone ), Female householders: 7,993 (3,026 living alone )7,082 spouses (6,971 opposite-sex spouses ), 1,605 unmarried partners , (1,553 opposite-sex unmarried partners ), 8,333 children (7,534 natural , 335 adopted , 466 stepchildren ), 353 grandchildren , 83 brothers or sisters , 167 parents , 72 foster children , 286 other relatives , 461 non-relatives In group quarters: 846 (-1 institutionalized population )
Size of family households: 4,638 2-persons , 1,963 3-persons , 1,816 4-persons , 480 5-persons , 108 6-persons , 93 7-or-more-persons
Size of nonfamily households: 5,296 1-person , 1,232 2-persons , 51 3-persons , 6 5-persons
4,612 married couples with children. single-parent households (291 men , 1,439 women ).
91.5% of residents of 75605 zip code speak English at home. of residents speak Spanish at home (69% very well, 20% well, 8% not well, 3% not at all ).of residents speak other Indo-European language at home (91% very well, 9% well ).of residents speak Asian or Pacific Island language at home (82% very well, 10% well, 7% not well, 1% not at all ).of residents speak other language at home (85% very well, 15% well ).
Foreign born population: 1,660 (4.8%)
(56.9%
of them are naturalized citizens )
This zip code:
4.8%Whole state:
17.2%
34% Honduras 10% France 8% Kazakhstan 6% Japan 4% Thailand 4% Malaysia 2% Somalia 17% American 13% English 8% Irish 5% German 3% European 2% Italian 1% Scottish
Year of entry for the foreign-born population
767 2010 or later 518 2000 to 2009 149 1990 to 1999 479 Before 1990
There are
332 Other Medical Specialists in Zip Code 75605.
Facilities with environmental interests located in this zip code:
AUTOMOTIVE SPECIALISTS (5189 N US HIGHWAY 259 in LONGVIEW, TX)
(Resource Conservation and Recovery Act (tracking hazardous waste)) Alternative names: AUTOMOTIVE SPECIALTIES
Housing units lacking complete plumbing facilities: 0.5%
Housing units lacking complete kitchen facilities: 2.3%
70.7% Electricity 27.5% Utility gas 1.8% Bottled, tank, or LP gas
Population in 1990: 9,166. Population change in the 1990s: +15,426 (+168.3%).
Place of birth for U.S.-born residents:
This state: 23,147Northeast: 627Midwest: 1,644South: 5,324West: 1,783
51% of the 75605 zip code residents lived in the same house 5 years ago.
Out of people who lived in different houses, 53% lived in this county.
Out of people who lived in different counties, 50% lived in Texas.
86% of the 75605 zip code residents lived in the same house 1 year ago.
Out of people who lived in different houses, 47% moved from this county.
Out of people who lived in different houses, 44% moved from different county within same state.
Out of people who lived in different houses, 8% moved from different state.
Private vs. public school enrollment:
Students in private schools in grades 1 to 8 (elementary and middle school): 251
Students in private schools in grades 9 to 12 (high school): 203
Students in private undergraduate colleges: 340
Occupation by median earnings in the past 12 months ($)
106,606 Architecture and engineering occupations 92,113 Law enforcement workers including supervisors 90,181 Fire fighting and prevention, and other protective service workers including supervisors 86,163 Management occupations 76,865 Construction and extraction occupations 76,538 Computer and mathematical occupations
Companies with federal contracts located in this zip code:
CURTIS-MC KINLEY ROOFING & SHE (4515 ALPINE RD in LONGVIEW, TX; small business) in 15 contracts from 1999 to 2006
Contracts for Maintenance, Repair or Alteration of Real Property -- Other Administrative Facilities and Service Buildings, Maintenance, Repair or Alteration of Real Property -- Other Industrial Buildings, Maintenance, Repair or Alteration of Real Property -- Other Educational Buildings, Maintenance, Repair or Alteration of Real Property -- Miscellaneous Buildings, and more by ArmySigned by year: 2000: $21,216; 2001: $0; 2002: $0; 2003: $0; 2004: $0; 2005: $945,432; 2006: $62,397.
Biggest contracts: with Army for Maintenance, Repair or Alteration of Real Property -- Other Administrative Facilities and Service Buildings. Taking place in OK. Signed on 2005-09-20. Completion date: 2006-03-31.
with Army for Maintenance, Repair or Alteration of Real Property -- Other Administrative Facilities and Service Buildings. Taking place in LA. Signed on 2005-09-13. Completion date: 2006-03-31.
with Army for Maintenance, Repair or Alteration of Real Property -- Other Administrative Facilities and Service Buildings. Signed on 2005-09-21. Completion date: 2006-03-31.
with Army for Maintenance, Repair or Alteration of Real Property -- Other Industrial Buildings. Signed on 2005-08-17. Completion date: 2005-10-16.
KAY HARRELL (3793 RUPE HUFFMAN RD in LONGVIEW, TX; small business) in 6 contracts from 2003 to 2005
Contracts for Recreational Services, Guard Services by ArmySigned by year: 2000: $0; 2001: $0; 2002: $0; 2003: $4,020; 2004: $0; 2005: $10,477; 2006: $0.
Biggest contracts: with Army for Recreational Services. Signed on 2005-02-09. Completion date: 2005-09-30.
with Army for Guard Services. Signed on 2005-08-16. Completion date: 2006-02-28.
with Army for Recreational Services. Signed on 2003-10-08. Completion date: 2004-02-29.
, same as above. Signed on 2003-11-24. Completion date: 2004-02-29.
GOOLSBY, TAMMY (102 COMMANDER DR STE4 in LONGVIEW, TX; small business)
$3,513 with Army for Court Reporting Services. Signed on 2004-11-16. Completion date: 2004-11-16.
Top industries in this zip code by the number of employees in 2005:
Administrative and Support and Waste Management and Remediation Services: Temporary Help Services (500-999 employees: 1 establishment, 100-249 employees: 2 establishments, 10-19 employees: 1 establishment)Accommodation and Food Services: Full-Service Restaurants (100-249: 4, 50-99: 3, 20-49: 1, 10-19: 3, 5-9: 1, 1-4: 6)Health Care and Social Assistance: Home Health Care Services (500-999: 1, 20-49: 1, 10-19: 3, 5-9: 1, 1-4: 1)Health Care and Social Assistance: General Medical and Surgical Hospitals (500-999: 1)Accommodation and Food Services: Limited-Service Restaurants (100-249: 1, 50-99: 3, 20-49: 8, 10-19: 3, 5-9: 3, 1-4: 3)Health Care and Social Assistance: Offices of Physicians (except Mental Health Specialists) (250-499: 1, 20-49: 1, 10-19: 4, 5-9: 8, 1-4: 22)Health Care and Social Assistance: Nursing Care Facilities (100-249: 3)Other Services (except Public Administration): Religious Organizations (100-249: 1, 20-49: 2, 10-19: 9, 5-9: 7, 1-4: 10)
People in group quarters in 2010:
472 people in nursing facilities/skilled-nursing facilities
110 people in group homes intended for adults
67 people in hospitals with patients who have no usual home elsewhere
48 people in group homes for juveniles (non-correctional)
21 people in workers' group living quarters and job corps centers
People in group quarters in 2000:
438 people in nursing homes
47 people in hospitals or wards for drug/alcohol abuse
39 people in other group homes
27 people in mental (psychiatric) hospitals or wards
25 people in homes for the mentally retarded
18 people in unknown juvenile institutions
2 people in religious group quarters
Fatal accident statistics in 2014:
Fatal accident count: 5Vehicles involved in fatal accidents: 8Fatal accidents caused by drunken drivers: 3Fatalities: 5Persons involved in fatal accidents: 11Pedestrians involved in fatal accidents: 0
Fatal accident statistics in 2013:
Fatal accident count: 6Vehicles involved in fatal accidents: 10Fatal accidents caused by drunken drivers: 2Fatalities: 6Persons involved in fatal accidents: 15Pedestrians involved in fatal accidents: 0
Home Mortgage Disclosure Act Aggregated Statistics For Year 2009(Based on 2 full and 10 partial tracts) A) FHA, FSA/RHS & VA B) Conventional C) Refinancings D) Home Improvement Loans E) Loans on Dwellings For 5+ Families F) Non-occupant Loans on G) Loans On Manufactured Number Average Value Number Average Value Number Average Value Number Average Value Number Average Value Number Average Value Number Average Value
LOANS ORIGINATED 288 $148,678 474 $172,287 742 $140,661 105 $70,166 9 $1,547,923 145 $122,070 22 $43,850 APPLICATIONS APPROVED, NOT ACCEPTED 32 $140,617 55 $174,438 78 $144,536 3 $51,967 0 $0 13 $77,544 5 $41,272 APPLICATIONS DENIED 32 $137,721 57 $158,981 196 $136,316 40 $36,541 0 $0 5 $153,466 3 $48,363 APPLICATIONS WITHDRAWN 38 $139,927 45 $166,330 158 $169,178 13 $42,379 0 $0 12 $84,238 3 $44,450 FILES CLOSED FOR INCOMPLETENESS 13 $119,076 21 $246,918 47 $164,047 0 $0 0 $0 2 $155,310 2 $43,925
Aggregated Statistics For Year 2008(Based on 2 full and 10 partial tracts) A) FHA, FSA/RHS & VA B) Conventional C) Refinancings D) Home Improvement Loans E) Loans on Dwellings For 5+ Families F) Non-occupant Loans on G) Loans On Manufactured Number Average Value Number Average Value Number Average Value Number Average Value Number Average Value Number Average Value Number Average Value
LOANS ORIGINATED 243 $148,676 629 $161,397 387 $133,979 134 $48,972 2 $5,610,880 146 $110,953 19 $45,958 APPLICATIONS APPROVED, NOT ACCEPTED 9 $129,339 61 $106,102 58 $118,056 25 $31,590 0 $0 10 $89,282 29 $55,737 APPLICATIONS DENIED 36 $145,208 108 $134,889 195 $129,011 96 $42,855 0 $0 18 $76,428 25 $55,290 APPLICATIONS WITHDRAWN 18 $168,816 47 $148,196 98 $133,929 12 $52,652 0 $0 9 $72,780 0 $0 FILES CLOSED FOR INCOMPLETENESS 9 $152,541 10 $103,249 24 $140,544 0 $0 0 $0 2 $52,080 0 $0
Aggregated Statistics For Year 2007(Based on 2 full and 10 partial tracts) A) FHA, FSA/RHS & VA B) Conventional C) Refinancings D) Home Improvement Loans E) Loans on Dwellings For 5+ Families F) Non-occupant Loans on G) Loans On Manufactured Number Average Value Number Average Value Number Average Value Number Average Value Number Average Value Number Average Value Number Average Value
LOANS ORIGINATED 122 $129,809 903 $139,968 377 $117,131 146 $54,403 14 $1,367,273 138 $108,265 33 $51,183 APPLICATIONS APPROVED, NOT ACCEPTED 4 $102,125 104 $110,266 55 $111,212 48 $34,558 0 $0 4 $149,730 18 $48,363 APPLICATIONS DENIED 8 $111,788 151 $116,193 276 $116,401 106 $43,254 5 $2,739,664 42 $73,389 44 $42,637 APPLICATIONS WITHDRAWN 14 $119,526 71 $158,169 177 $112,105 17 $93,346 0 $0 12 $75,273 6 $80,280 FILES CLOSED FOR INCOMPLETENESS 4 $161,292 26 $138,875 44 $145,771 2 $112,735 0 $0 0 $0 0 $0
Aggregated Statistics For Year 2006(Based on 2 full and 10 partial tracts) A) FHA, FSA/RHS & VA B) Conventional C) Refinancings D) Home Improvement Loans E) Loans on Dwellings For 5+ Families F) Non-occupant Loans on G) Loans On Manufactured Number Average Value Number Average Value Number Average Value Number Average Value Number Average Value Number Average Value Number Average Value
LOANS ORIGINATED 99 $126,881 1,086 $127,486 364 $121,375 141 $49,878 2 $2,519,510 161 $94,516 19 $35,501 APPLICATIONS APPROVED, NOT ACCEPTED 7 $90,290 129 $96,382 38 $101,960 18 $41,129 0 $0 10 $65,493 27 $49,592 APPLICATIONS DENIED 2 $131,445 190 $88,156 234 $111,447 89 $34,220 2 $211,005 26 $56,685 40 $54,290 APPLICATIONS WITHDRAWN 23 $121,791 105 $114,181 182 $111,908 17 $57,954 0 $0 11 $142,075 2 $40,395 FILES CLOSED FOR INCOMPLETENESS 0 $0 47 $90,119 75 $141,064 3 $180,963 0 $0 5 $88,556 0 $0
Aggregated Statistics For Year 2005(Based on 2 full and 10 partial tracts) A) FHA, FSA/RHS & VA B) Conventional C) Refinancings D) Home Improvement Loans E) Loans on Dwellings For 5+ Families F) Non-occupant Loans on G) Loans On Manufactured Number Average Value Number Average Value Number Average Value Number Average Value Number Average Value Number Average Value Number Average Value
LOANS ORIGINATED 77 $123,164 918 $118,181 511 $107,962 105 $62,481 5 $1,873,940 125 $99,407 18 $37,573 APPLICATIONS APPROVED, NOT ACCEPTED 5 $98,038 100 $81,981 73 $84,548 18 $57,314 0 $0 9 $95,198 22 $41,750 APPLICATIONS DENIED 19 $98,687 164 $91,274 320 $104,374 77 $59,024 0 $0 8 $79,386 69 $54,825 APPLICATIONS WITHDRAWN 5 $103,284 91 $138,738 336 $128,162 61 $208,059 0 $0 12 $175,751 2 $45,340 FILES CLOSED FOR INCOMPLETENESS 2 $111,775 27 $113,121 119 $92,985 3 $74,143 0 $0 8 $99,205 2 $91,660
Aggregated Statistics For Year 2004(Based on 2 full and 10 partial tracts) A) FHA, FSA/RHS & VA B) Conventional C) Refinancings D) Home Improvement Loans E) Loans on Dwellings For 5+ Families F) Non-occupant Loans on G) Loans On Manufactured Number Average Value Number Average Value Number Average Value Number Average Value Number Average Value Number Average Value Number Average Value
LOANS ORIGINATED 114 $105,923 920 $120,434 703 $100,508 151 $47,445 4 $1,642,925 132 $77,604 25 $46,588 APPLICATIONS APPROVED, NOT ACCEPTED 3 $116,067 95 $103,579 95 $110,904 19 $39,221 0 $0 8 $69,008 16 $37,072 APPLICATIONS DENIED 11 $92,881 185 $72,668 378 $87,357 80 $36,560 0 $0 25 $88,592 56 $44,388 APPLICATIONS WITHDRAWN 7 $80,789 105 $88,608 317 $96,911 11 $73,305 2 $4,235,760 5 $74,004 2 $12,365 FILES CLOSED FOR INCOMPLETENESS 4 $98,975 33 $94,982 107 $105,368 3 $30,853 0 $0 2 $41,575 0 $0
Aggregated Statistics For Year 2003(Based on 2 full and 12 partial tracts) A) FHA, FSA/RHS & VA B) Conventional C) Refinancings D) Home Improvement Loans E) Loans on Dwellings For 5+ Families F) Non-occupant Loans on Number Average Value Number Average Value Number Average Value Number Average Value Number Average Value Number Average Value
LOANS ORIGINATED 121 $103,899 786 $113,918 1,338 $98,549 99 $38,488 2 $2,015,910 121 $78,576 APPLICATIONS APPROVED, NOT ACCEPTED 4 $89,310 62 $108,591 151 $89,715 36 $25,038 0 $0 20 $55,805 APPLICATIONS DENIED 21 $90,312 187 $80,883 418 $89,183 75 $23,695 0 $0 34 $100,914 APPLICATIONS WITHDRAWN 12 $109,058 61 $104,137 299 $102,934 9 $28,961 0 $0 3 $33,360 FILES CLOSED FOR INCOMPLETENESS 5 $84,468 26 $88,528 30 $95,358 2 $19,955 0 $0 0 $0
Aggregated Statistics For Year 2002(Based on 2 full and 10 partial tracts) A) FHA, FSA/RHS & VA B) Conventional C) Refinancings D) Home Improvement Loans E) Loans on Dwellings For 5+ Families F) Non-occupant Loans on Number Average Value Number Average Value Number Average Value Number Average Value Number Average Value Number Average Value
LOANS ORIGINATED 99 $103,935 771 $109,663 676 $98,918 86 $36,307 9 $2,150,897 144 $68,175 APPLICATIONS APPROVED, NOT ACCEPTED 6 $91,507 94 $81,023 93 $101,150 20 $21,540 0 $0 16 $44,772 APPLICATIONS DENIED 10 $85,616 147 $62,323 184 $67,540 58 $15,001 0 $0 12 $47,102 APPLICATIONS WITHDRAWN 9 $101,913 77 $84,736 158 $78,972 5 $36,022 0 $0 9 $72,381 FILES CLOSED FOR INCOMPLETENESS 2 $26,300 23 $54,048 29 $81,410 0 $0 1 $1,889,290 2 $53,585
Aggregated Statistics For Year 2001(Based on 2 full and 10 partial tracts) A) FHA, FSA/RHS & VA B) Conventional C) Refinancings D) Home Improvement Loans E) Loans on Dwellings For 5+ Families F) Non-occupant Loans on Number Average Value Number Average Value Number Average Value Number Average Value Number Average Value Number Average Value
LOANS ORIGINATED 118 $89,290 848 $105,535 459 $85,937 107 $20,829 0 $0 95 $63,623 APPLICATIONS APPROVED, NOT ACCEPTED 6 $85,588 104 $65,988 71 $81,234 18 $35,653 2 $134,135 2 $97,575 APPLICATIONS DENIED 15 $79,025 233 $53,770 178 $62,102 43 $22,157 0 $0 23 $53,929 APPLICATIONS WITHDRAWN 5 $68,022 61 $98,880 166 $67,296 7 $8,093 1 $1,990,120 10 $58,494 FILES CLOSED FOR INCOMPLETENESS 0 $0 31 $62,801 19 $51,537 0 $0 0 $0 5 $62,800
Aggregated Statistics For Year 2000(Based on 2 full and 10 partial tracts) A) FHA, FSA/RHS & VA B) Conventional C) Refinancings D) Home Improvement Loans E) Loans on Dwellings For 5+ Families F) Non-occupant Loans on Number Average Value Number Average Value Number Average Value Number Average Value Number Average Value Number Average Value
LOANS ORIGINATED 130 $80,710 743 $122,380 167 $84,081 92 $23,170 2 $1,255,040 70 $72,490 APPLICATIONS APPROVED, NOT ACCEPTED 20 $47,788 70 $71,228 32 $62,786 17 $39,337 0 $0 9 $90,222 APPLICATIONS DENIED 24 $47,694 264 $49,295 81 $70,658 49 $14,229 0 $0 7 $50,833 APPLICATIONS WITHDRAWN 11 $55,605 71 $90,067 60 $62,589 4 $31,802 0 $0 2 $12,275 FILES CLOSED FOR INCOMPLETENESS 2 $41,205 23 $54,906 5 $57,824 0 $0 0 $0 0 $0
Aggregated Statistics For Year 1999(Based on 1 full and 8 partial tracts) A) FHA, FSA/RHS & VA B) Conventional C) Refinancings D) Home Improvement Loans F) Non-occupant Loans on Number Average Value Number Average Value Number Average Value Number Average Value Number Average Value
LOANS ORIGINATED 68 $77,535 383 $100,084 228 $86,079 68 $26,034 31 $62,136 APPLICATIONS APPROVED, NOT ACCEPTED 1 $32,180 73 $59,508 32 $76,271 11 $15,828 6 $52,337 APPLICATIONS DENIED 9 $82,412 207 $50,227 56 $62,832 26 $22,078 20 $54,328 APPLICATIONS WITHDRAWN 2 $52,095 32 $70,670 57 $77,826 3 $27,670 1 $10,430 FILES CLOSED FOR INCOMPLETENESS 1 $74,190 12 $85,590 19 $77,439 0 $0 0 $0
Private Mortgage Insurance Companies Aggregated Statistics For Year 2009(Based on 2 full and 10 partial tracts) A) Conventional B) Refinancings Number Average Value Number Average Value
LOANS ORIGINATED 70 $176,301 41 $223,372 APPLICATIONS APPROVED, NOT ACCEPTED 23 $203,953 12 $204,109 APPLICATIONS DENIED 15 $204,828 9 $143,942 APPLICATIONS WITHDRAWN 0 $0 5 $283,326 FILES CLOSED FOR INCOMPLETENESS 0 $0 2 $157,695
Aggregated Statistics For Year 2008(Based on 2 full and 10 partial tracts) A) Conventional B) Refinancings C) Non-occupant Loans on Number Average Value Number Average Value Number Average Value
LOANS ORIGINATED 156 $167,146 28 $174,594 7 $51,553 APPLICATIONS APPROVED, NOT ACCEPTED 64 $155,062 14 $212,936 2 $28,240 APPLICATIONS DENIED 10 $167,763 2 $331,395 0 $0 APPLICATIONS WITHDRAWN 13 $224,468 3 $103,647 0 $0 FILES CLOSED FOR INCOMPLETENESS 8 $193,565 0 $0 3 $82,920
Aggregated Statistics For Year 2007(Based on 2 full and 10 partial tracts) A) Conventional B) Refinancings C) Non-occupant Loans on Number Average Value Number Average Value Number Average Value
LOANS ORIGINATED 236 $147,413 21 $206,014 16 $109,956 APPLICATIONS APPROVED, NOT ACCEPTED 42 $156,996 7 $159,759 5 $69,654 APPLICATIONS DENIED 3 $169,717 0 $0 0 $0 APPLICATIONS WITHDRAWN 15 $152,421 0 $0 0 $0 FILES CLOSED FOR INCOMPLETENESS 0 $0 0 $0 0 $0
Aggregated Statistics For Year 2006(Based on 2 full and 10 partial tracts) A) Conventional B) Refinancings C) Non-occupant Loans on Number Average Value Number Average Value Number Average Value
LOANS ORIGINATED 177 $143,458 27 $175,056 11 $84,440 APPLICATIONS APPROVED, NOT ACCEPTED 49 $132,998 4 $124,418 5 $98,250 APPLICATIONS DENIED 0 $0 0 $0 0 $0 APPLICATIONS WITHDRAWN 9 $156,090 1 $147,530 0 $0 FILES CLOSED FOR INCOMPLETENESS 4 $114,645 0 $0 2 $54,910
Aggregated Statistics For Year 2005(Based on 2 full and 10 partial tracts) A) Conventional B) Refinancings C) Non-occupant Loans on Number Average Value Number Average Value Number Average Value
LOANS ORIGINATED 162 $121,337 33 $121,024 7 $73,517 APPLICATIONS APPROVED, NOT ACCEPTED 32 $127,844 1 $88,290 0 $0 APPLICATIONS DENIED 3 $61,063 0 $0 0 $0 APPLICATIONS WITHDRAWN 15 $137,019 2 $86,735 0 $0 FILES CLOSED FOR INCOMPLETENESS 3 $52,760 0 $0 0 $0
Aggregated Statistics For Year 2004(Based on 2 full and 10 partial tracts) A) Conventional B) Refinancings C) Non-occupant Loans on Number Average Value Number Average Value Number Average Value
LOANS ORIGINATED 204 $124,777 48 $126,686 3 $79,733 APPLICATIONS APPROVED, NOT ACCEPTED 30 $124,443 19 $171,178 3 $48,443 APPLICATIONS DENIED 4 $108,955 0 $0 2 $78,025 APPLICATIONS WITHDRAWN 19 $103,341 4 $253,782 2 $392,200 FILES CLOSED FOR INCOMPLETENESS 0 $0 2 $154,300 2 $154,300
Aggregated Statistics For Year 2003(Based on 2 full and 12 partial tracts) A) Conventional B) Refinancings C) Non-occupant Loans on Number Average Value Number Average Value Number Average Value
LOANS ORIGINATED 227 $112,624 157 $112,997 5 $104,800 APPLICATIONS APPROVED, NOT ACCEPTED 34 $98,112 38 $145,250 0 $0 APPLICATIONS DENIED 3 $136,467 2 $72,165 0 $0 APPLICATIONS WITHDRAWN 7 $156,709 13 $111,904 6 $117,680 FILES CLOSED FOR INCOMPLETENESS 0 $0 0 $0 0 $0
Aggregated Statistics For Year 2002(Based on 2 full and 10 partial tracts) A) Conventional B) Refinancings C) Non-occupant Loans on Number Average Value Number Average Value Number Average Value
LOANS ORIGINATED 176 $110,853 73 $131,337 12 $72,808 APPLICATIONS APPROVED, NOT ACCEPTED 26 $101,114 12 $127,523 0 $0 APPLICATIONS DENIED 0 $0 0 $0 0 $0 APPLICATIONS WITHDRAWN 8 $123,072 3 $148,973 2 $56,475 FILES CLOSED FOR INCOMPLETENESS 0 $0 2 $25,425 0 $0
Aggregated Statistics For Year 2001(Based on 2 full and 10 partial tracts) A) Conventional B) Refinancings C) Non-occupant Loans on Number Average Value Number Average Value Number Average Value
LOANS ORIGINATED 181 $109,897 32 $124,835 5 $56,404 APPLICATIONS APPROVED, NOT ACCEPTED 20 $97,720 6 $135,465 0 $0 APPLICATIONS DENIED 2 $125,310 2 $69,980 0 $0 APPLICATIONS WITHDRAWN 4 $135,505 2 $59,355 0 $0 FILES CLOSED FOR INCOMPLETENESS 1 $55,190 0 $0 0 $0
Aggregated Statistics For Year 2000(Based on 2 full and 10 partial tracts) A) Conventional B) Refinancings C) Non-occupant Loans on Number Average Value Number Average Value Number Average Value
LOANS ORIGINATED 163 $98,472 13 $128,706 9 $81,761 APPLICATIONS APPROVED, NOT ACCEPTED 9 $79,670 2 $154,165 0 $0 APPLICATIONS DENIED 0 $0 2 $61,005 0 $0 APPLICATIONS WITHDRAWN 4 $94,550 3 $105,357 0 $0 FILES CLOSED FOR INCOMPLETENESS 2 $88,930 0 $0 0 $0
Aggregated Statistics For Year 1999(Based on 1 full and 6 partial tracts) A) Conventional B) Refinancings C) Non-occupant Loans on Number Average Value Number Average Value Number Average Value
LOANS ORIGINATED 99 $103,806 28 $104,558 2 $68,270 APPLICATIONS APPROVED, NOT ACCEPTED 10 $99,608 8 $134,740 0 $0 APPLICATIONS DENIED 3 $75,350 1 $151,370 0 $0 APPLICATIONS WITHDRAWN 7 $102,790 1 $72,350 0 $0 FILES CLOSED FOR INCOMPLETENESS 0 $0 1 $66,270 0 $0
2002 - 2018 National Fire Incident Reporting System (NFIRS) incidents See full 2006 National Fire Incident Reporting System statistics for zip code 75605, Texas
Most common first names in zip code 75605 among deceased individuals Name Count Lived (average)
James 88 73.5 years Mary 84 81.5 years Robert 73 72.7 years John 65 75.7 years William 65 76.5 years Charles 46 73.5 years Dorothy 45 80.2 years Helen 31 81.1 years George 29 77.5 years Billy 28 70.6 years
Most common last names in zip code 75605 among deceased individuals Last name Count Lived (average)
Smith 48 79.9 years Jones 43 76.2 years Williams 36 78.3 years Johnson 31 78.3 years Moore 25 77.5 years Brown 25 76.9 years Davis 24 76.2 years Wilson 22 75.8 years Martin 19 78.9 years Walker 18 81.7 years
Businesses in zip code 75605
Name Count Name Count
AT&T 4 Marriott 1 Academy Sports + Outdoors 1 Maurices 1 Aeropostale 1 Nike 4 Albertsons 1 Office Depot 1 American Eagle Outfitters 1 Old Navy 1 Applebee's 1 Olive Garden 1 Baskin-Robbins 1 Outback 1 Bath & Body Works 1 Outback Steakhouse 1 Best Western 1 Pac Sun 1 Burger King 1 Payless 1 Carl\s Jr. 1 Penske 1 Catherines 1 PetSmart 1 Chevrolet 1 Pizza Hut 1 Chick-Fil-A 2 Quiznos 1 Chuck E. Cheese's 1 RadioShack 1 Comfort Suites 1 Red Lobster 1 Discount Tire 1 Rue21 1 Famous Footwear 1 Ryan's Grill 1 FedEx 6 SAS Shoes 1 Firestone Complete Auto Care 1 SONIC Drive-In 1 Foot Locker 1 Sam's Club 1 GNC 1 Sears 1 GameStop 1 Sprint Nextel 1 H&R Block 2 Starbucks 3 Hilton 1 Subway 1 Hobby Lobby 1 T-Mobile 1 Holiday Inn 2 Taco Bell 1 Hollister Co. 1 Target 1 Home Depot 1 Toys"R"Us 1 Hot Topic 1 True Value 1 IHOP 1 U-Haul 2 JCPenney 1 UPS 7 Jack In The Box 1 Vans 2 Jones New York 3 Verizon Wireless 3 Journeys 1 Victoria's Secret 1 KFC 1 Waffle House 1 Kohl's 1 Walgreens 1 La Quinta 1 Walmart 1 Lane Bryant 1 Wendy's 1 Long John Silver's 1 Wingate 1 Lowe's 1
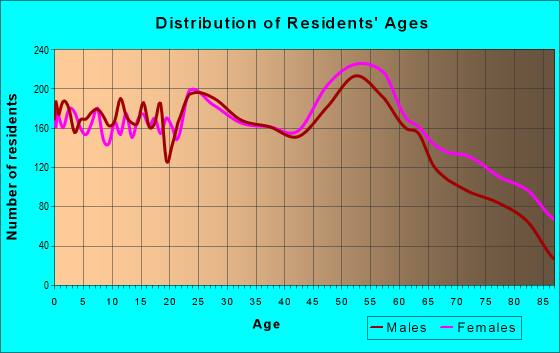
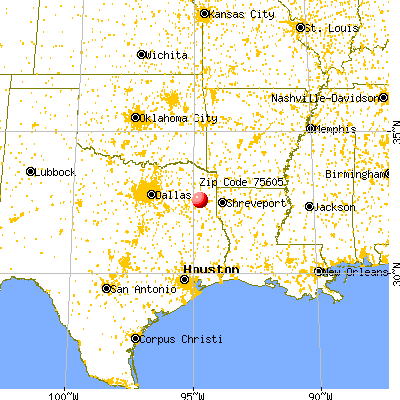


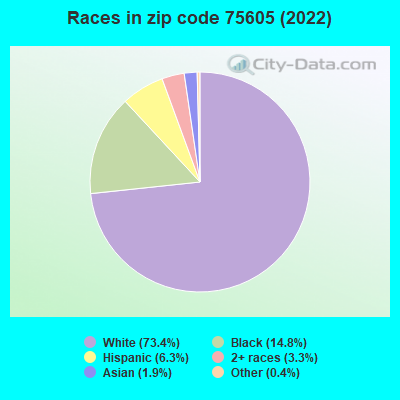


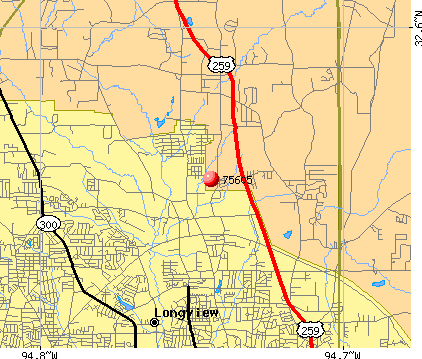 Nearest zip codes: 75601, 75604, 75640, 75693, 75602, 75603.
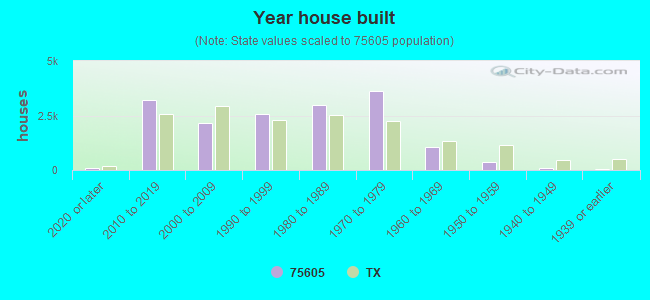
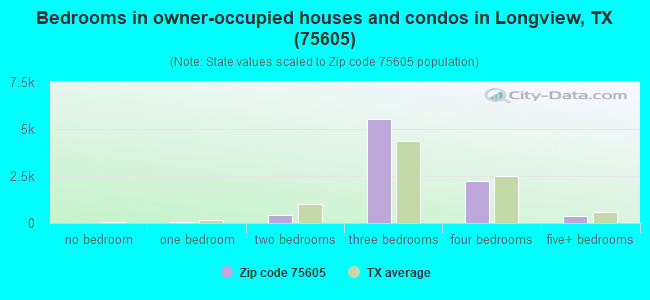
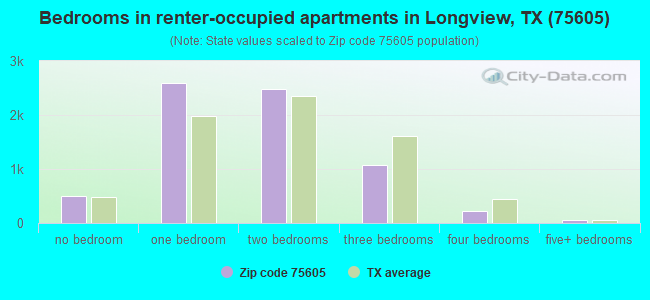
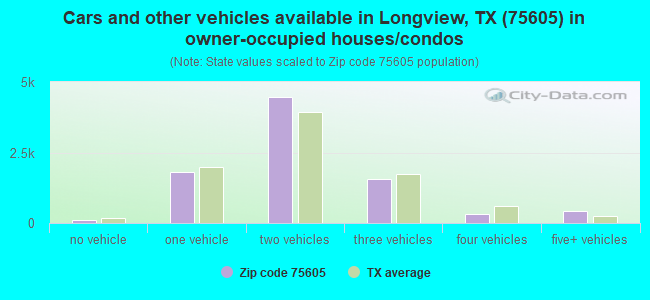
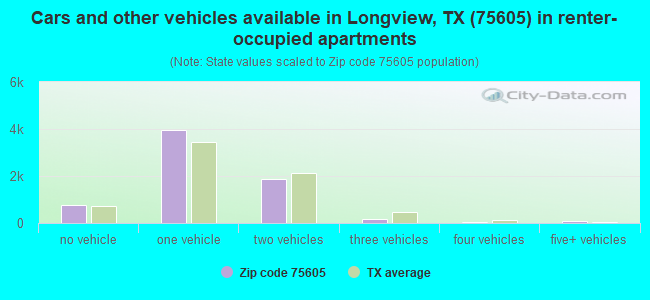


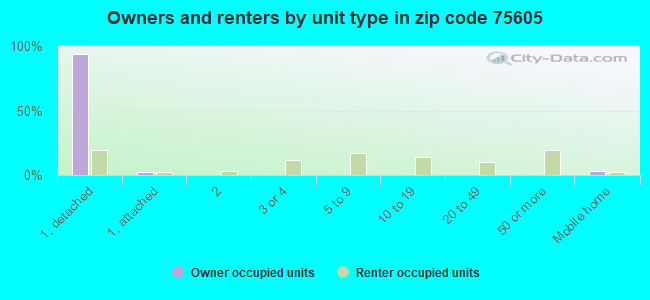
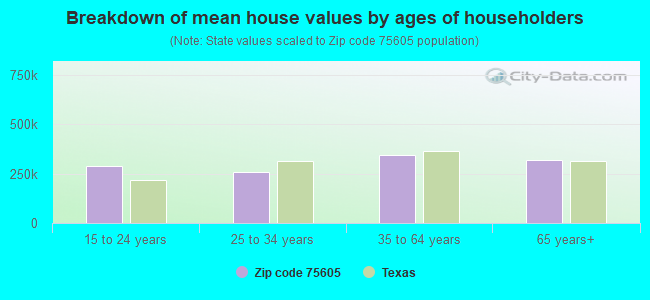


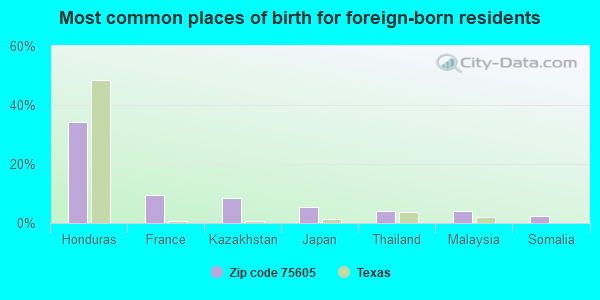
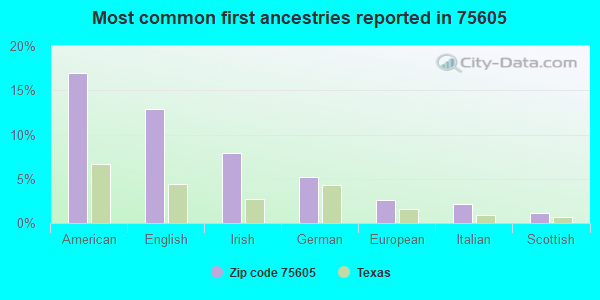
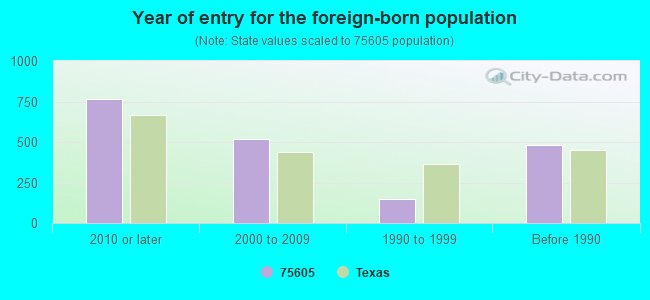


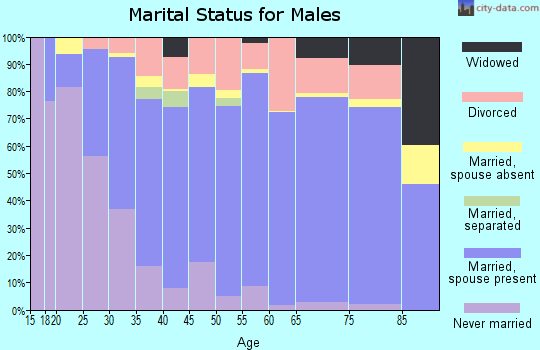
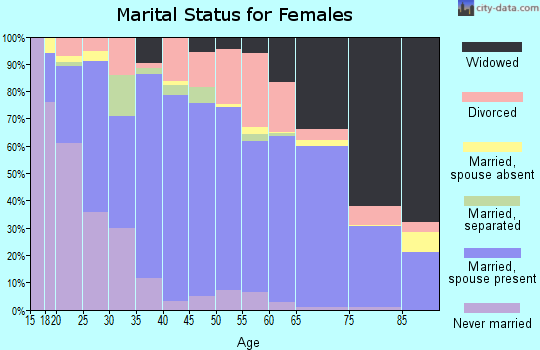
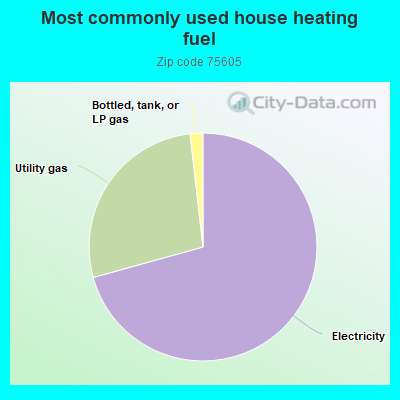
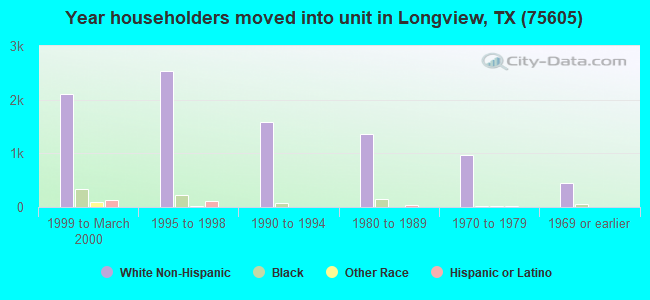
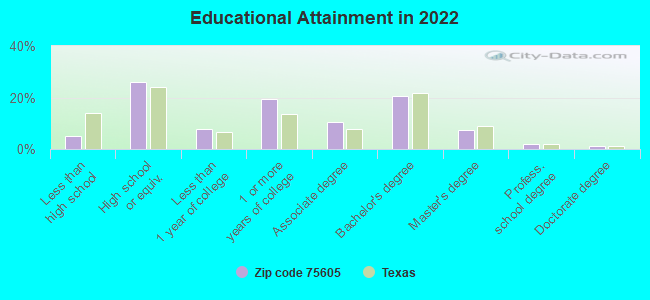
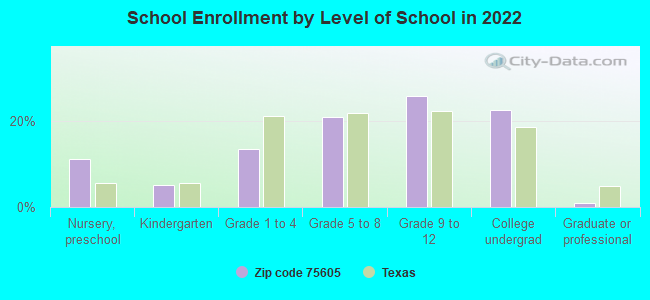
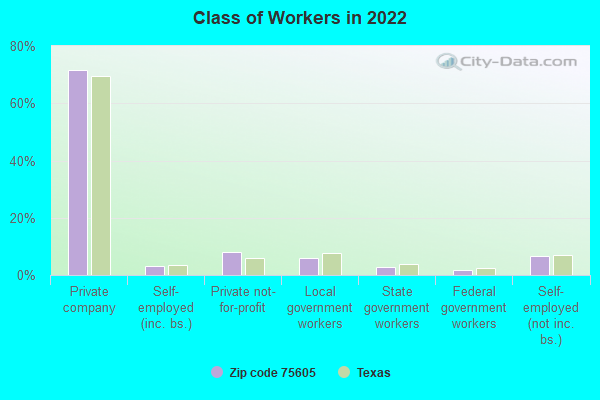
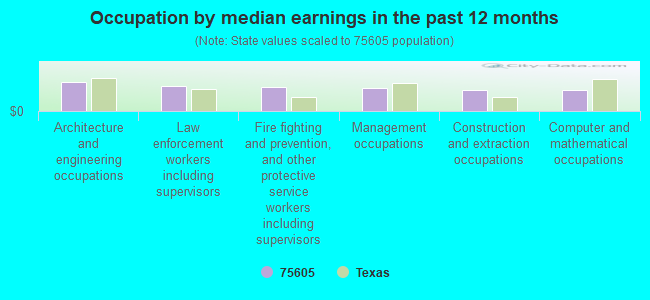
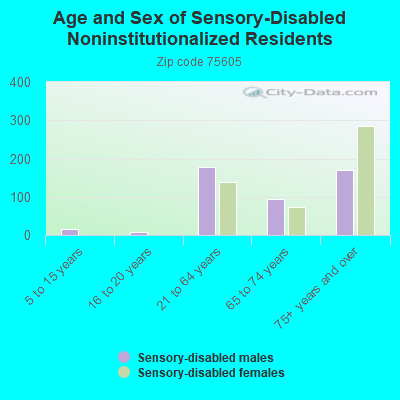
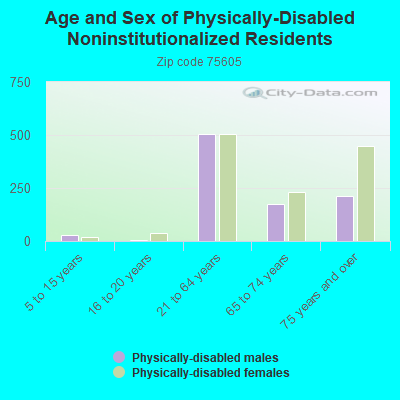
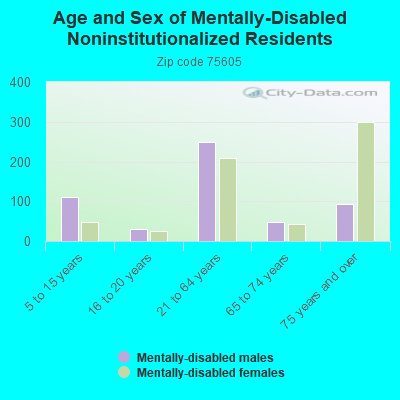
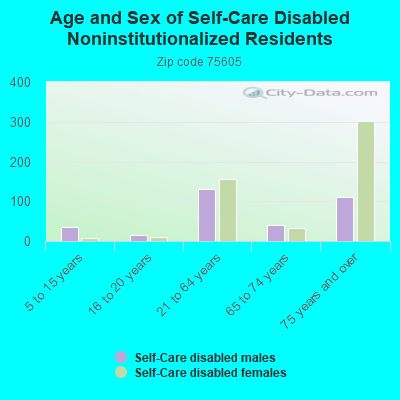
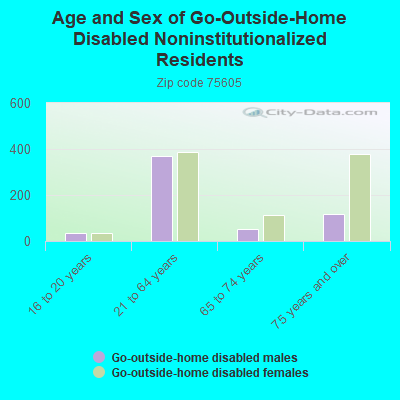
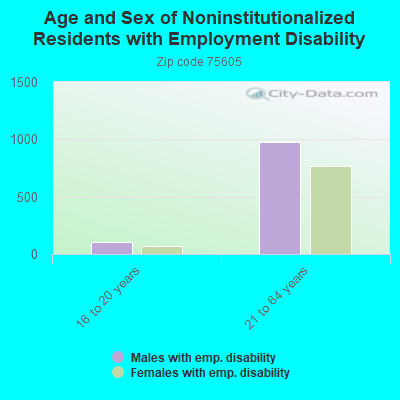
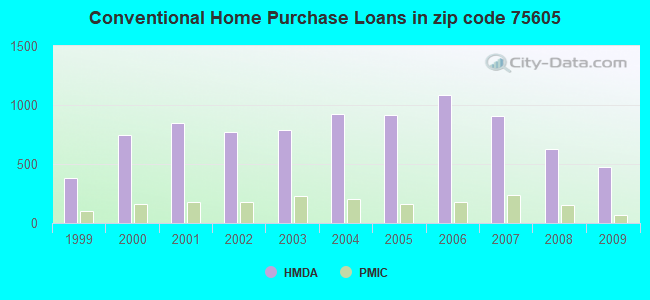
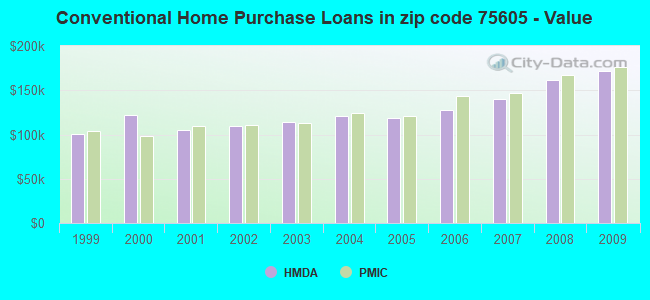
 Based on the data from the years 2002 - 2018 the average number of fire incidents per year is 88. The highest number of reported fire incidents - 142 took place in 2006, and the least - 46 in 2018. The data has a dropping trend.
 When looking into fire subcategories, the most incidents belonged to: Outside Fires (47.1%), and Structure Fires (33.2%).