Longview, Texas
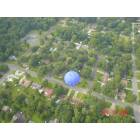
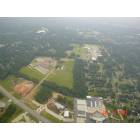
Longview: Ariel view of a neighborhood
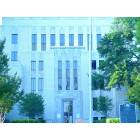
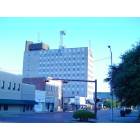
Longview: Gregg Cty Courthouse in Downtown
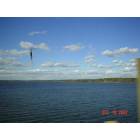
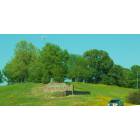
Longview: Lake O' The Pines
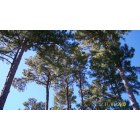
Longview: A view of some pretty Longview pine trees.
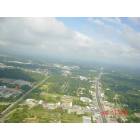
Longview: Ariel view of Longview
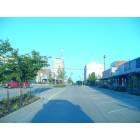
Longview: Tyler St. Renovation Downtown
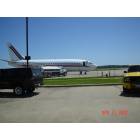
Longview: Airplane on runway at East Texas Regional
Longview: Ariel view of Pine Tree Junior High and High School from hot air balloon
Longview: Welcome to Longview
Longview: Downtown Longview
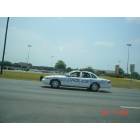
Longview: Police car on loop in front of mall
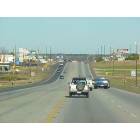
Longview: Loop 281 Longview, Tx
- add
your
Submit your own pictures of this city and show them to the world
- OSM Map
- General Map
- Google Map
- MSN Map
Population change since 2000: +12.5%
 |
| Males: 39,710 | |
| Females: 42,821 |
| Median resident age: | 38.1 years |
| Texas median age: | 35.6 years |
| Longview: | $65,897 |
| TX: | $72,284 |
Estimated per capita income in 2022: $33,874 (it was $18,768 in 2000)
Longview city income, earnings, and wages data
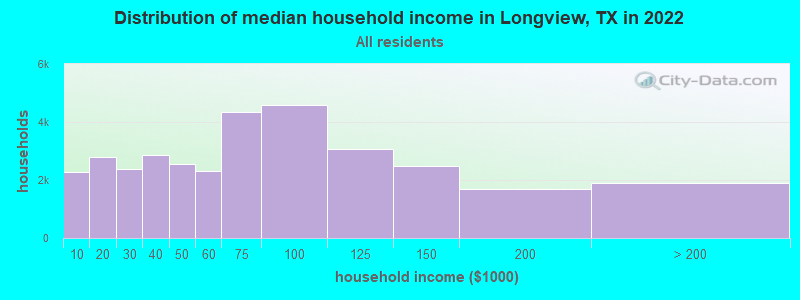
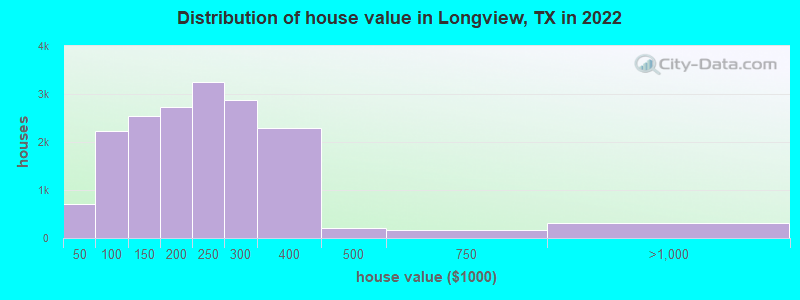
Estimated median house or condo value in 2022: $208,900 (it was $74,300 in 2000)
| Longview: | $208,900 |
| TX: | $275,400 |
Mean prices in 2022: all housing units: $252,219; detached houses: $265,702; townhouses or other attached units: $283,157; in 2-unit structures: $214,897; in 3-to-4-unit structures: $229,073; in 5-or-more-unit structures: $328,458; mobile homes: $94,749; occupied boats, rvs, vans, etc.: $26,929
Median gross rent in 2022: $1,084.
(7.5% for White Non-Hispanic residents, 24.9% for Black residents, 26.6% for Hispanic or Latino residents, 19.3% for American Indian residents, 27.9% for other race residents, 29.8% for two or more races residents)
Detailed information about poverty and poor residents in Longview, TX


Compare current foreclosures in Longview, TX:
| Photo | Address | Area | Beds / Baths | Price | Details |
|---|---|---|---|---|---|

|
#1
H G Moseley Pkwy
Longview, TX 75604
|
- sq. feet
|
3 baths 3 beds |
$329,900
|
show details |

|
#2
Hallsville Hts
Longview, TX 75602
|
- sq. feet
|
2 baths 3 beds |
show details | |

|
#3
Lori Ln
Longview, TX 75605
|
- sq. feet
|
2 baths 3 beds |
show details | |

|
#4
Mary Jane Dr
Longview, TX 75601
|
1,707 sq. feet
|
2 baths - beds |
show details | |

|
#5
Ferndale St
Longview, TX 75604
|
2,278 sq. feet
|
2 baths - beds |
show details | |

|
#6
Dowell Dr
Longview, TX 75604
|
1,783 sq. feet
|
2 baths - beds |
show details | |

|
#7
Johnson St
Longview, TX 75602
|
1,300 sq. feet
|
2 baths - beds |
show details | |

|
#8
Wood Pl
Longview, TX 75601
|
2,238 sq. feet
|
2 baths - beds |
show details | |

|
#9
Le Duke Blvd
Longview, TX 75601
|
3,435 sq. feet
|
3 baths - beds |
show details | |

|
#10
Camille Dr
Longview, TX 75605
|
1,841 sq. feet
|
2 baths - beds |
show details |
| Photo | Address | Area | Beds / Baths | Price | Details |
|---|---|---|---|---|---|

|
#11
Amberwood Dr
Longview, TX 75605
|
2,011 sq. feet
|
2 baths - beds |
show details | |

|
#12
Shady Ln
Longview, TX 75604
|
2,130 sq. feet
|
2 baths - beds |
show details | |

|
#13
Adams Rd
Longview, TX 75604
|
1,944 sq. feet
|
2 baths - beds |
show details | |

|
#14
Willow Oak Dr
Longview, TX 75601
|
1,968 sq. feet
|
2 baths - beds |
show details | |

|
#15
Walters St
Longview, TX 75603
|
1,144 sq. feet
|
1 baths - beds |
show details | |

|
#16
Lonesome Pine Rd
Longview, TX 75605
|
2,546 sq. feet
|
2 baths - beds |
show details | |

|
#17
Cross Creek Rd
Longview, TX 75602
|
1,456 sq. feet
|
- baths - beds |
show details | |

|
#18
Webster St
Longview, TX 75602
|
1,787 sq. feet
|
2 baths - beds |
show details | |

|
#19
Gilmer Rd # 101
Longview, TX 75604
|
7,475 sq. feet
|
4 baths - beds |
show details | |

|
#20
Canyon Ridge Ct
Longview, TX 75604
|
1,929 sq. feet
|
2 baths - beds |
show details |
| Photo | Address | Area | Beds / Baths | Price | Details |
|---|---|---|---|---|---|

|
#21
Crossroads Dr
Longview, TX 75605
|
1,827 sq. feet
|
2 baths - beds |
show details | |

|
#22
Whitehurst Dr Lot 30
Longview, TX 75602
|
- sq. feet
|
- baths - beds |
show details | |

|
#23
San Jose Dr
Longview, TX 75601
|
- sq. feet
|
- baths - beds |
show details | |

|
#24
259 N, # 617
Longview, TX 75605
|
- sq. feet
|
- baths - beds |
show details | |

|
#25
Bill Owens Pkwy Apt B
Longview, TX 75605
|
- sq. feet
|
- baths - beds |
show details | |

|
#26
Bundrick Ln
Longview, TX 75604
|
- sq. feet
|
- baths - beds |
show details | |

|
#27
W Fairmont St Apt 130
Longview, TX 75604
|
- sq. feet
|
- baths - beds |
show details | |

|
#28
Toler Rd Apt 1507
Longview, TX 75605
|
- sq. feet
|
- baths - beds |
show details | |

|
#29
Eden Dr
Longview, TX 75601
|
- sq. feet
|
- baths - beds |
show details | |

|
#30
Falcon Way
Longview, TX 75605
|
- sq. feet
|
- baths - beds |
show details |
| Photo | Address | Area | Beds / Baths | Price | Details |
|---|---|---|---|---|---|

|
#31
Us Highway 259 N Apt 211
Longview, TX 75605
|
- sq. feet
|
- baths - beds |
show details | |

|
#32
Myra Lynn Ln
Longview, TX 75605
|
- sq. feet
|
- baths - beds |
show details | |

|
#33
Us Highway 259 N Apt 511
Longview, TX 75605
|
- sq. feet
|
- baths - beds |
show details | |

|
#34
Jay Dr
Longview, TX 75603
|
1,694 sq. feet
|
- baths - beds |
show details | |

|
#35
N Green St Ste 302
Longview, TX 75601
|
- sq. feet
|
- baths - beds |
show details | |

|
#36
S 12th St
Longview, TX 75602
|
- sq. feet
|
- baths - beds |
show details | |

|
#37
Oden St # 101
Longview, TX 75602
|
- sq. feet
|
- baths - beds |
show details | |

|
#38
Judson Rd
Longview, TX 75605
|
- sq. feet
|
- baths - beds |
show details | |

|
#39
Mccann Rd Apt 275
Longview, TX 75605
|
- sq. feet
|
- baths - beds |
show details | |

|
#40
Gum Springs Rd
Longview, TX 75602
|
- sq. feet
|
- baths - beds |
show details |
| Photo | Address | Area | Beds / Baths | Price | Details |
|---|---|---|---|---|---|

|
#41
Mccann Rd Apt 504
Longview, TX 75605
|
- sq. feet
|
- baths - beds |
show details | |

|
#42
Terra Ln
Longview, TX 75605
|
- sq. feet
|
- baths - beds |
show details | |

|
#43
Gilmer Rd Apt 14
Longview, TX 75604
|
- sq. feet
|
- baths - beds |
show details | |

|
#44
W Loop 281, Apt 1804
Longview, TX 75602
|
- sq. feet
|
- baths - beds |
show details | |

|
#45
Montreal Dr
Longview, TX 75601
|
- sq. feet
|
- baths - beds |
show details | |

|
#46
Pleasant Green Rd
Longview, TX 75603
|
- sq. feet
|
- baths - beds |
show details | |

|
#47
Cedar Ridge Rd
Longview, TX 75602
|
- sq. feet
|
- baths - beds |
show details | |

|
#48
Wesley St
Longview, TX 75605
|
- sq. feet
|
- baths - beds |
show details | |

|
#49
W Harrison Rd Lot 32
Longview, TX 75604
|
1,064 sq. feet
|
- baths - beds |
show details | |

|
Check over 1 million property listings on Foreclosure.com!
|
browse all offers | |||


- 43,87652.9%White alone
- 18,01521.7%Black alone
- 17,44821.0%Hispanic
- 2,3022.8%Two or more races
- 1,2401.5%Asian alone
- 2040.2%Other race alone
- 970.1%American Indian alone
- 430.05%Native Hawaiian and Other
Pacific Islander alone
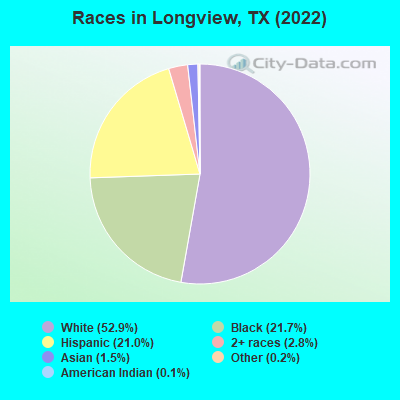
Races in Longview detailed stats: ancestries, foreign born residents, place of birth
According to our research of Texas and other state lists, there were 328 registered sex offenders living in Longview, Texas as of April 27, 2024.
The ratio of all residents to sex offenders in Longview is 259 to 1.
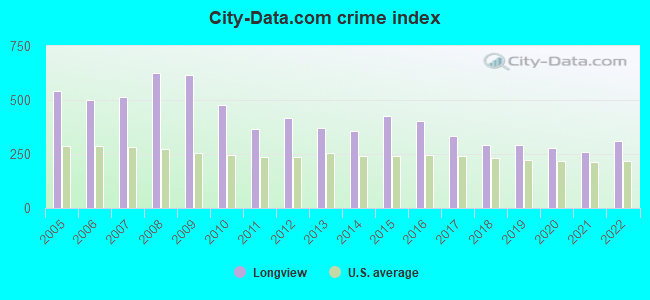
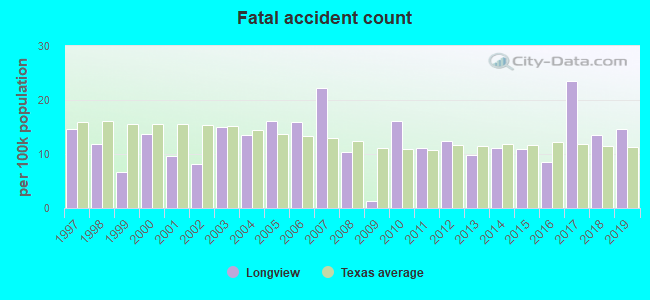
The City-Data.com crime index weighs serious crimes and violent crimes more heavily. Higher means more crime, U.S. average is 246.1. It adjusts for the number of visitors and daily workers commuting into cities.
- means the value is smaller than the state average.- means the value is about the same as the state average.
- means the value is bigger than the state average.
- means the value is much bigger than the state average.
Crime rate in Longview detailed stats: murders, rapes, robberies, assaults, burglaries, thefts, arson
Full-time law enforcement employees in 2021, including police officers: 207 (162 officers - 142 male; 20 female).
| Officers per 1,000 residents here: | 1.98 |
| Texas average: | 2.07 |
 Recent articles from our blog. Our writers, many of them Ph.D. graduates or candidates, create easy-to-read articles on a wide variety of topics.

 | Tyler vs Longview (10 replies) |
| Who is Really Moving to Texas? (64 replies) |
| Tyler or Longview- healthcare and weather (13 replies) |
| Dallas vs Longview living (11 replies) |
| Tyler or Longview (9 replies) |
| Thinking about moving to Longview TX (14 replies) |
Latest news from Longview, TX collected exclusively by city-data.com from local newspapers, TV, and radio stations
Ancestries: American (14.1%), English (5.8%), Irish (5.1%), German (2.9%), Italian (1.3%), European (1.2%).
Current Local Time: CST time zone
Land area: 54.7 square miles.
Population density: 1,510 people per square mile (low).
8,230 residents are foreign born (7.4% Latin America, 1.2% Asia).
| This city: | 9.9% |
| Texas: | 17.1% |
Median real estate property taxes paid for housing units with mortgages in 2022: $3,287 (1.5%)
Median real estate property taxes paid for housing units with no mortgage in 2022: $2,093 (1.2%)
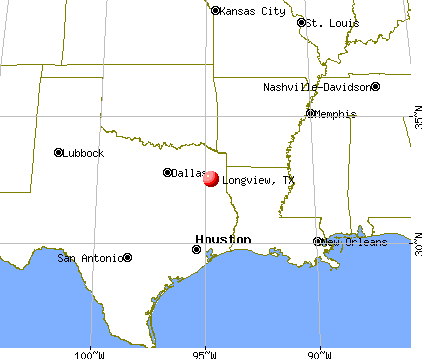
Nearest city with pop. 200,000+: Shreveport, LA  (57.4 miles , pop. 200,145).
Nearest city with pop. 1,000,000+: Dallas, TX (120.1 miles , pop. 1,188,580).
Nearest cities:
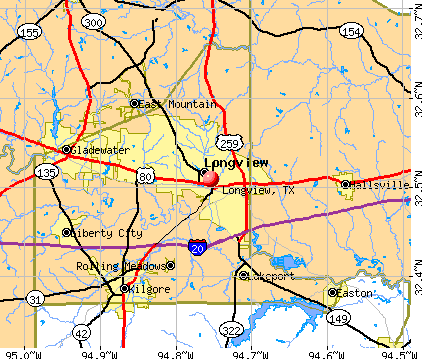
), ), ), ), ), ), Latitude: 32.51 N, Longitude: 94.75 W
Daytime population change due to commuting: +19,634 (+23.6%)
Workers who live and work in this city: 32,145 (81.4%)
Area code: 903
Longview tourist attractions:
Longview, Texas accommodation & food services, waste management - Economy and Business Data
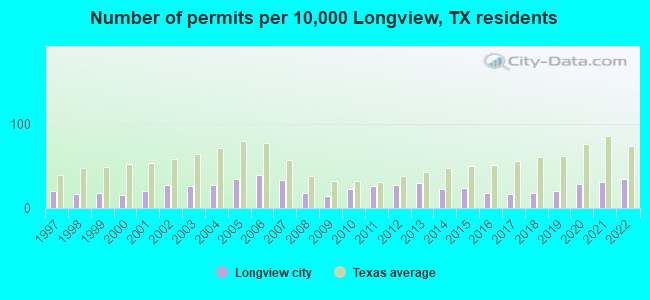
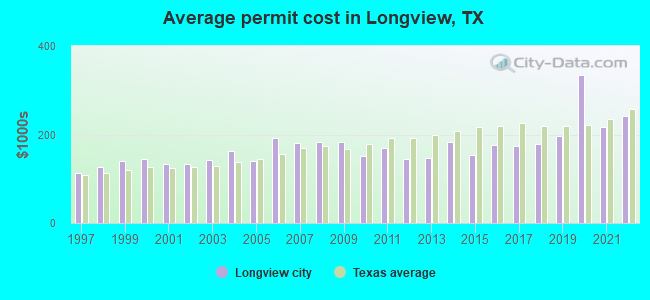
Single-family new house construction building permits:
- 2022: 250 buildings, average cost: $240,900
- 2021: 225 buildings, average cost: $215,800
- 2020: 211 buildings, average cost: $334,500
- 2019: 152 buildings, average cost: $196,500
- 2018: 130 buildings, average cost: $179,100
- 2017: 126 buildings, average cost: $174,000
- 2016: 128 buildings, average cost: $177,300
- 2015: 179 buildings, average cost: $153,500
- 2014: 168 buildings, average cost: $182,100
- 2013: 220 buildings, average cost: $145,700
- 2012: 198 buildings, average cost: $144,700
- 2011: 190 buildings, average cost: $170,200
- 2010: 167 buildings, average cost: $151,400
- 2009: 106 buildings, average cost: $183,400
- 2008: 133 buildings, average cost: $184,000
- 2007: 245 buildings, average cost: $180,900
- 2006: 287 buildings, average cost: $193,100
- 2005: 251 buildings, average cost: $140,700
- 2004: 200 buildings, average cost: $162,600
- 2003: 197 buildings, average cost: $143,200
- 2002: 198 buildings, average cost: $133,000
- 2001: 153 buildings, average cost: $133,300
- 2000: 118 buildings, average cost: $143,700
- 1999: 133 buildings, average cost: $141,400
- 1998: 119 buildings, average cost: $126,400
- 1997: 152 buildings, average cost: $113,700
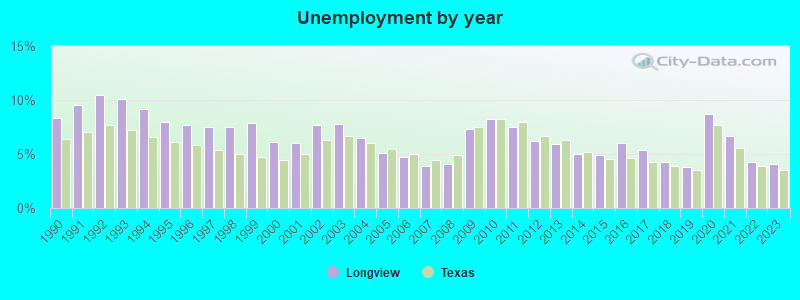
| Here: | 4.1% |
| Texas: | 3.5% |
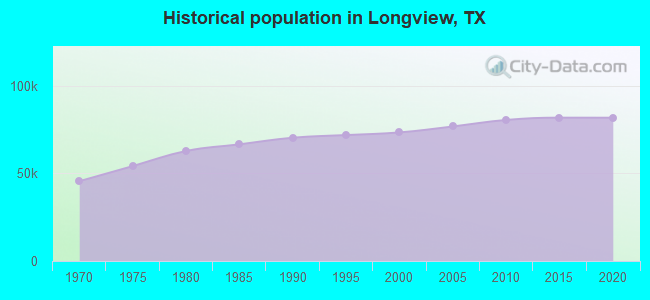
Population change in the 1990s: +2,706 (+3.8%).
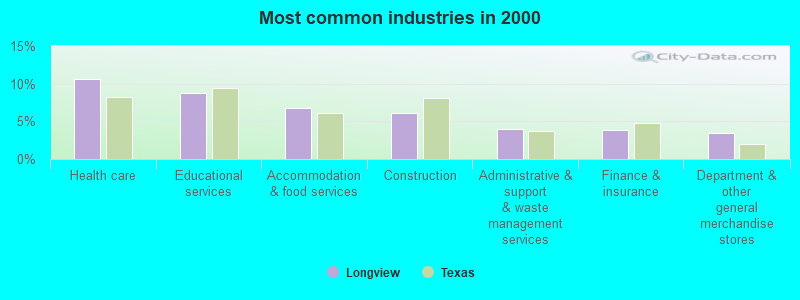
- Health care (10.6%)
- Educational services (8.7%)
- Accommodation & food services (6.8%)
- Construction (6.0%)
- Administrative & support & waste management services (4.0%)
- Finance & insurance (3.9%)
- Department & other general merchandise stores (3.4%)
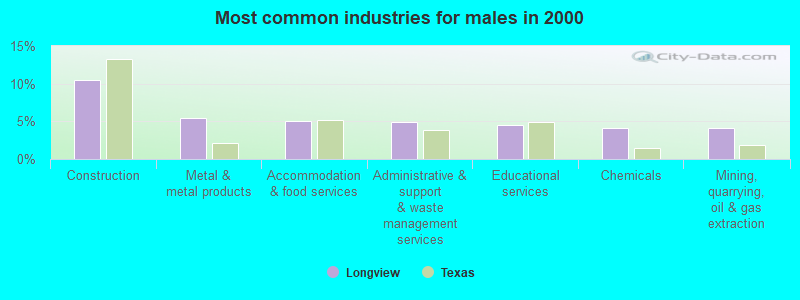
- Construction (10.4%)
- Metal & metal products (5.5%)
- Accommodation & food services (5.0%)
- Administrative & support & waste management services (5.0%)
- Educational services (4.5%)
- Chemicals (4.2%)
- Mining, quarrying, oil & gas extraction (4.1%)
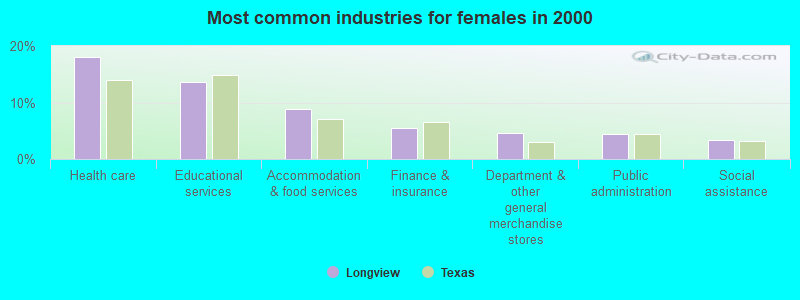
- Health care (18.0%)
- Educational services (13.5%)
- Accommodation & food services (8.8%)
- Finance & insurance (5.4%)
- Department & other general merchandise stores (4.5%)
- Public administration (4.4%)
- Social assistance (3.4%)
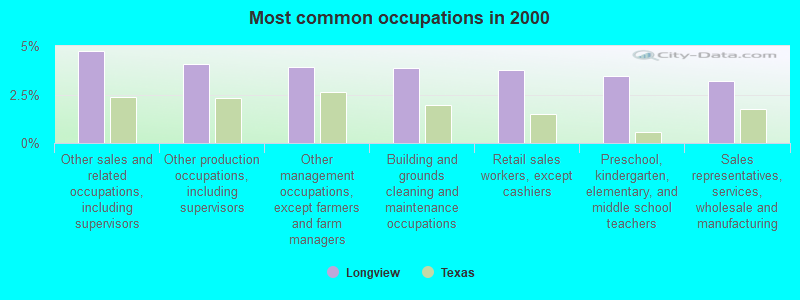
- Other sales and related occupations, including supervisors (4.7%)
- Other production occupations, including supervisors (4.1%)
- Other management occupations, except farmers and farm managers (3.9%)
- Building and grounds cleaning and maintenance occupations (3.9%)
- Retail sales workers, except cashiers (3.7%)
- Preschool, kindergarten, elementary, and middle school teachers (3.4%)
- Sales representatives, services, wholesale and manufacturing (3.2%)
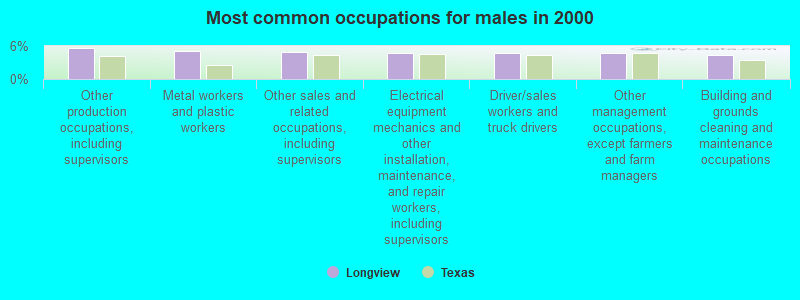
- Other production occupations, including supervisors (5.7%)
- Metal workers and plastic workers (5.1%)
- Other sales and related occupations, including supervisors (4.9%)
- Electrical equipment mechanics and other installation, maintenance, and repair workers, including supervisors (4.8%)
- Driver/sales workers and truck drivers (4.7%)
- Other management occupations, except farmers and farm managers (4.7%)
- Building and grounds cleaning and maintenance occupations (4.4%)
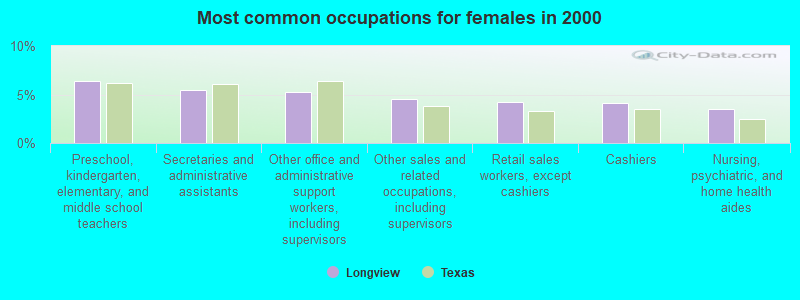
- Preschool, kindergarten, elementary, and middle school teachers (6.4%)
- Secretaries and administrative assistants (5.5%)
- Other office and administrative support workers, including supervisors (5.3%)
- Other sales and related occupations, including supervisors (4.6%)
- Retail sales workers, except cashiers (4.3%)
- Cashiers (4.1%)
- Nursing, psychiatric, and home health aides (3.6%)
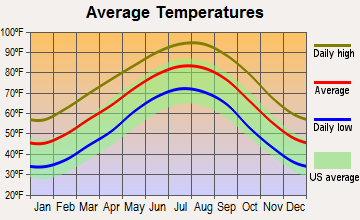
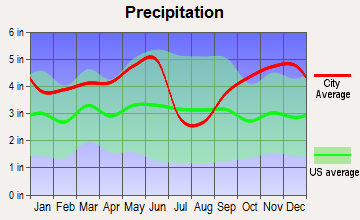
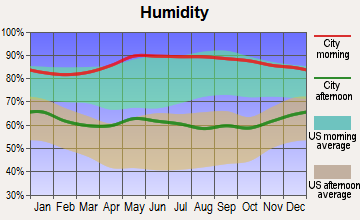
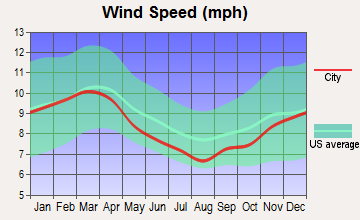
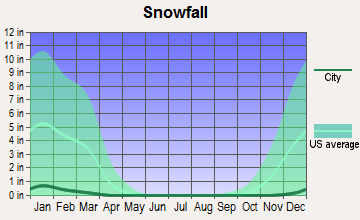
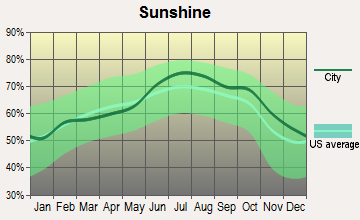
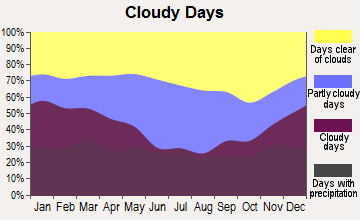
Average climate in Longview, Texas
Based on data reported by over 4,000 weather stations
|
|

(lower is better)
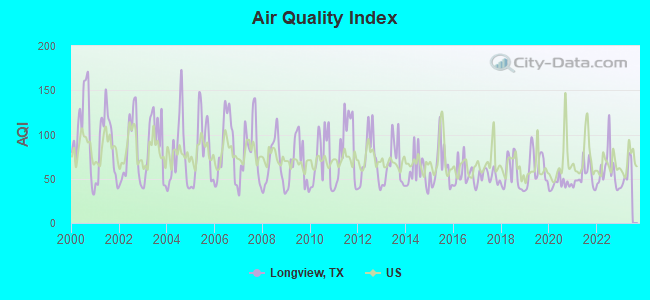
Air Quality Index (AQI) level in 2022 was 59.3. This is better than average.
| City: | 59.3 |
| U.S.: | 72.6 |
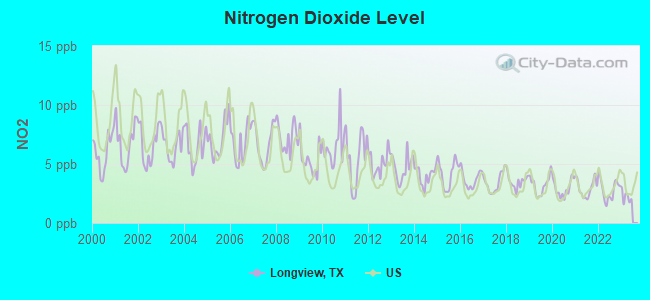
Nitrogen Dioxide (NO2) [ppb] level in 2022 was 2.83. This is significantly better than average. Closest monitor was 9.4 miles away from the city center.
| City: | 2.83 |
| U.S.: | 5.11 |
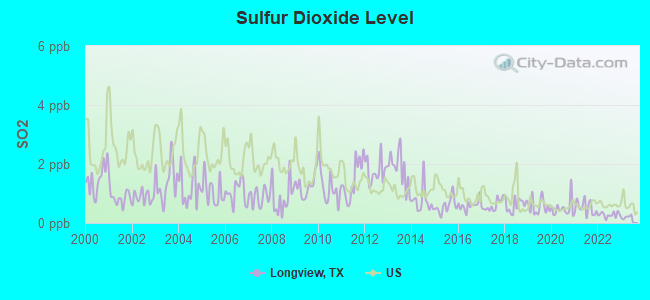
Sulfur Dioxide (SO2) [ppb] level in 2022 was 0.277. This is significantly better than average. Closest monitor was 9.4 miles away from the city center.
| City: | 0.277 |
| U.S.: | 1.515 |
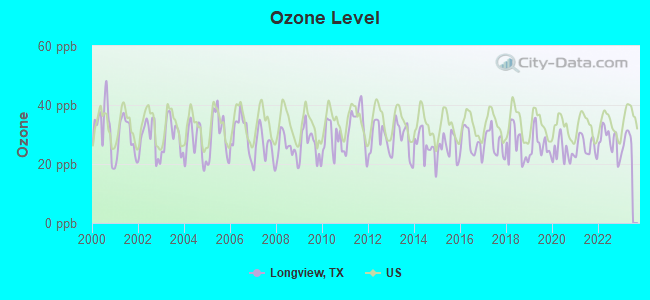
Ozone [ppb] level in 2022 was 27.8. This is about average. Closest monitor was 9.4 miles away from the city center.
| City: | 27.8 |
| U.S.: | 33.3 |
Tornado activity:
Longview-area historical tornado activity is above Texas state average. It is 134% greater than the overall U.S. average.
On 4/26/1957, a category F3 (max. wind speeds 158-206 mph) tornado 2.8 miles away from the Longview city center caused between $5000 and $50,000 in damages.
On 4/1/1979, a category F3 tornado 5.6 miles away from the city center caused between $500,000 and $5,000,000 in damages.
Earthquake activity:
Longview-area historical earthquake activity is significantly above Texas state average. It is 386% greater than the overall U.S. average.On 5/17/2012 at 08:12:00, a magnitude 4.8 (4.8 MW, Depth: 3.1 mi, Class: Light, Intensity: IV - V) earthquake occurred 46.2 miles away from the city center
On 11/6/2011 at 03:53:10, a magnitude 5.7 (5.7 MW, Depth: 3.2 mi, Class: Moderate, Intensity: VI - VII) earthquake occurred 238.7 miles away from Longview center
On 9/3/2016 at 12:02:44, a magnitude 5.8 (5.8 MW, Depth: 3.5 mi) earthquake occurred 297.9 miles away from the city center
On 9/2/2013 at 23:51:15, a magnitude 4.3 (4.3 MW, Depth: 2.9 mi) earthquake occurred 45.7 miles away from Longview center
On 9/2/2013 at 21:52:38, a magnitude 4.2 (4.2 MW, Depth: 3.0 mi) earthquake occurred 39.9 miles away from the city center
On 1/25/2013 at 07:01:19, a magnitude 4.1 (4.1 MB, Depth: 3.1 mi) earthquake occurred 53.1 miles away from the city center
Magnitude types: body-wave magnitude (MB), moment magnitude (MW)
Natural disasters:
The number of natural disasters in Gregg County (16) is near the US average (15).Major Disasters (Presidential) Declared: 9
Emergencies Declared: 6
Causes of natural disasters: Hurricanes: 5, Storms: 5, Floods: 4, Fires: 3, Tornadoes: 3, Winter Storm: 1, Other: 2 (Note: some incidents may be assigned to more than one category).
Hospitals in Longview:
- AZALEA ARMS (220 NIMITZ ST)
- CCS/MEADOW PINES INC (22 BERMUDA LN)
- CONCORD MANOR (414 S CENTER)
- FOREST ACRES I I (511 TUPELO DR)
- GOOD SHEPHERD MEDICAL CENTER (Voluntary non-profit - Private, provides emergency services, 700 EAST MARSHALL AVENUE)
- HEARTSWAY HOSPICE OF NORTHEAST TEXAS (1306 PINETREE ROAD)
- LANEY (1801 LANEY DR)
- PATHWAYS HOSPITAL (22 BERMUDA LANE)
- SELECT SPECIALITY HOSPITAL OF LONGVIEW (700 EAST MARSHALL AVE FIRST FLOOR WEST WING)
- TEXAS HOME HEALTH HOSPICE (500 EAST LOOP 281)
Airports and heliports located in Longview:
- East Texas Regional Airport (GGG) (Runways: 2, Commercial Ops: 287, Air Taxi Ops: 7,370, Itinerant Ops: 20,507, Local Ops: 12,395, Military Ops: 526)
- East Side Airport (3TS0) (Runways: 2, Itinerant Ops: 600, Local Ops: 900)
- Tailwheel Airport (2XA7) (Runways: 1)
- Good Shepherd Medical Center Heliport (3XS6)
- Longview Regional Medical Center Heliport (6TX3)
- Texas Farms And Ranches Heliport (59XA)
College/University in Longview:
Other colleges/universities with over 2000 students near Longview:
- Kilgore College (about 12 miles; Kilgore, TX; Full-time enrollment: 3,127)
- The University of Texas at Tyler (about 32 miles; Tyler, TX; FT enrollment: 5,774)
- Tyler Junior College (about 34 miles; Tyler, TX; FT enrollment: 8,104)
- Northeast Texas Community College (about 42 miles; Mount Pleasant, TX; FT enrollment: 2,320)
- Southern University at Shreveport (about 54 miles; Shreveport, LA; FT enrollment: 2,277)
- Louisiana State University-Shreveport (about 62 miles; Shreveport, LA; FT enrollment: 3,159)
- Bossier Parish Community College (about 65 miles; Bossier City, LA; FT enrollment: 6,209)
Biggest public high schools in Longview:
- LONGVIEW H S (Students: 2,083, Location: 201 E TOMLINSON PKWY, Grades: 9-12)
- PINE TREE DAEP (Students: 1,335, Location: 1701 PINE TREE RD, Grades: 1-12)
- PINE TREE H S (Students: 679, Location: 1005 W FAIRMONT ST, Grades: 9-12)
- FOREST PARK MAGNET SCHOOL (Students: 479, Location: 1644 N EASTMAN RD, Grades: 6-10)
- SPRING HILL H S (Students: 292, Location: 3101 SPRING HILL RD, Grades: 9-12)
- DAN CHADWICK CAMPUS (Students: 157, Location: 2402 ALPINE RD, Grades: 9-12, Charter school)
- JUVENILE DETENT CTR (Students: 11, Location: 310 TURK ST, Grades: 8-11)
- JUDSON MIDDLE (Location: 5745 JUDSON RD, Grades: 6-9)
- LEAD ACADEMY H S (Location: 500 N THIRD ST, Grades: 9-12)
- EXCEL H S OF CHOICE (Location: 1005 W FAIRMONT BUILDING B, Grades: 9-12)
Private high schools in Longview:
- TRINITY SCHOOL OF TEXAS (Students: 294, Location: 215 N TEAGUE ST, Grades: PK-12)
- CHRISTIAN HERITAGE SCHOOL (Students: 247, Location: 2715 FM 1844, Grades: KG-12)
- ST MARY S CATHOLIC SCHOOL (Students: 205, Location: 405 HOLLYBROOK DR, Grades: PK-9)
- EAST TEXAS CHRISTIAN SCHOOL (Students: 182, Location: 5621 FM 2087 S, Grades: PK-12)
- LONGVIEW CHRISTIAN ACADEMY (Students: 67, Location: 2200 W LOOP 281, Grades: KG-12)
- NEW LIFE CHRISTIAN SCHOOL (Students: 34, Location: 800 DOYLE ST, Grades: KG-12)
Biggest public elementary/middle schools in Longview:
- FOSTER MIDDLE (Students: 774, Location: 1504 MLK, Grades: 6-8)
- PINE TREE EL (Students: 768, Location: 815 BIRCH ST, Grades: 1-2)
- PINE TREE MIDDLE (Students: 715, Location: 600 PT PKWY, Grades: 5-6)
- PINE TREE INT (Students: 708, Location: 601 P T PKWY, Grades: 3-4)
- SPRING HILL J H (Students: 524, Location: 3101 SPRING HILL RD, Grades: 6-8)
- SPRING HILL PRI (Students: 479, Location: 2700 SPRING HILL RD, Grades: PK-2)
- SPRING HILL INT (Students: 269, Location: 3101 SPRING HILL RD, Grades: 3-5)
- BRAMLETTE EL (Location: 111 TUPELO, Grades: PK-5)
- J L EVERHART MAGNET EL (Location: 2919 TRYON RD, Grades: PK-5)
- JOHNSTON-MCQUEEN EL (Location: 422 FM 2751, Grades: PK-5)
Private elementary/middle schools in Longview:
User-submitted facts and corrections:
- Actor: Forest Whitaker
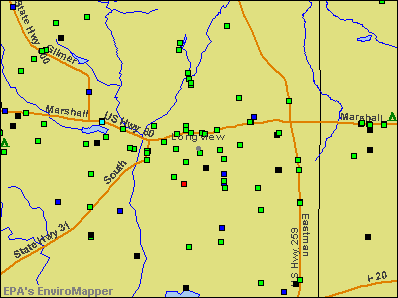
Points of interest:
Notable locations in Longview: Warren Refinery (A), Nuggett Hill Historic District (B), Everett Building (C), Gregg County Courthouse (D), Longview Art Museum (E), Gregg County Historical Museum (F), Longview Fire Department / Emergency Medical Services Administration (G), Longview Fire Department / Emergency Medical Services Station 5 (H), Longview Fire Department / Emergency Medical Services Station 7 (I), Longview Fire Department / Emergency Medical Services Station 8 (J), Longview Fire Department / Emergency Medical Services Station 6 (K), Longview Fire Department / Emergency Medical Services Station 2 (L), Longview Fire Department / Emergency Medical Services Station 3 (M), Longview Fire Department / Emergency Medical Services Station 4 (N), Northcutt House (O), Whaley House (P). Display/hide their locations on the map
Shopping Center: Longview Shopping Center (1). Display/hide its location on the map
Churches in Longview include: Temple Emanu-el (A), Perry-Clay Chapel (B), Winterfield Church (C), Central Church (D), Friendship Church (E), Lewis Chapel (F), Friendship Baptist Church (G), Southside Assembly of God Church (H), Pine Tree Assembly of God Church (I). Display/hide their locations on the map
Cemeteries: Perry-Clay Cemetery (1), Grace Hill Cemetery (2), Magill Memorial Cemetery (3), Ray Cemetery (4), Memory Park Cemetery (5), Jordan Valley Memorial Park (6), Hunter Cemetery (7). Display/hide their locations on the map
Reservoirs: Lake Lamond (A), Johnston Lake (B), Fisher Lake (C), Cook Lake (D), Lake Lomond (E), R and K Lake (F), Low Head Weir Reservoir (G). Display/hide their locations on the map
Streams, rivers, and creeks: School Branch (A), Elm Branch (B), Harris Creek (C), Hawkins Creek (D). Display/hide their locations on the map
Parks in Longview include: Jackson Park (1), Ingram Park (2), Rollins Park (3), Patterson Park (4), Pinewood Park (5), Teague Park (6), Mc Whorter Park (7), Timpson Park (8), Lobo Stadium (9). Display/hide their locations on the map
Tourist attractions: East Texas Tourism Association (421 North Center Street # A) (1), Fastrack (918 West Marshall Avenue) (2). Display/hide their approximate locations on the map
Hotels: Best Western (310 East Loop 281) (1), American Thrifty Inn (2015 East Marshall Avenue) (2), Best Western Inn of Longview (3119 Estes Parkway) (3), Comfort Inn Longview (203 North Spur 63) (4). Display/hide their approximate locations on the map
Birthplace of: Miranda Lambert - Country music artist, Karen Silkwood - Labor union activist, José Francisco Torres - Soccer player, Mark White - Ameriacn politician, Josh Scobee - 2005 NFL player (Jacksonville Jaguars, born: Jun 23, 1982), Craig Anthony Washington - Politician, Willie Andrews - Football player, Trent Williams - College football player, Don Fambrough - Football player and coach, Fred Talley - Football player.
| This city: | 2.5 people |
| Texas: | 2.8 people |
| This city: | 65.5% |
| Whole state: | 69.9% |
| This city: | 5.8% |
| Whole state: | 6.0% |
Likely homosexual households (counted as self-reported same-sex unmarried-partner households)
- Lesbian couples: 0.3% of all households
- Gay men: 0.3% of all households
People in group quarters in Longview in 2010:
- 1,073 people in college/university student housing
- 767 people in nursing facilities/skilled-nursing facilities
- 708 people in local jails and other municipal confinement facilities
- 396 people in hospitals with patients who have no usual home elsewhere
- 262 people in group homes intended for adults
- 206 people in emergency and transitional shelters (with sleeping facilities) for people experiencing homelessness
- 182 people in other noninstitutional facilities
- 45 people in residential treatment centers for adults
- 26 people in correctional facilities intended for juveniles
- 16 people in residential treatment centers for juveniles (non-correctional)
- 9 people in workers' group living quarters and job corps centers
People in group quarters in Longview in 2000:
- 790 people in nursing homes
- 694 people in college dormitories (includes college quarters off campus)
- 426 people in local jails and other confinement facilities (including police lockups)
- 269 people in state prisons
- 92 people in homes for the mentally retarded
- 49 people in other noninstitutional group quarters
- 47 people in hospitals or wards for drug/alcohol abuse
- 33 people in homes for the mentally ill
- 27 people in mental (psychiatric) hospitals or wards
- 24 people in short-term care, detention or diagnostic centers for delinquent children
- 22 people in homes or halfway houses for drug/alcohol abuse
- 18 people in unknown juvenile institutions
- 3 people in other group homes
- 2 people in religious group quarters
Banks with most branches in Longview (2011 data):
- Austin Bank, Texas National Association: Longview Pinetree Branch, Longview Oak Forest Branch, Longview Bar K Branch, Longview East Loop Branch, Longview Greggton Branch. Info updated 2010/10/14: Bank assets: $1,328.1 mil, Deposits: $1,154.0 mil, headquarters in Jacksonville, TX, positive income, Commercial Lending Specialization, 31 total offices, Holding Company: Jane Austin Chapman Limited Partnership, L.P.
- Texas Bank and Trust Company: Detached Facility, North Longview Branch, Pine Tree Convenience Center, Pine Tree Branch, Texas Bank And Trust Company. Info updated 2011/11/15: Bank assets: $1,431.3 mil, Deposits: $1,244.3 mil, local headquarters, positive income, Commercial Lending Specialization, 13 total offices, Holding Company: Overton Financial Corporation
- Southside Bank: Longview Super One - 2 Branch, Kroger Branch, Longview Super One Branch, Longview Branch. Info updated 2008/10/01: Bank assets: $3,303.8 mil, Deposits: $2,331.5 mil, headquarters in Tyler, TX, positive income, Mortgage Lending Specialization, 40 total offices, Holding Company: Southside Bancshares, Incorporated
- Regions Bank: Mccann Road, Longview Main Office, Longview Downtown Motor Branch, North-East Branch. Info updated 2011/02/24: Bank assets: $123,368.2 mil, Deposits: $98,301.3 mil, headquarters in Birmingham, AL, positive income, Commercial Lending Specialization, 1778 total offices, Holding Company: Regions Financial Corporation
- JPMorgan Chase Bank, National Association: Judson Road Branch, Longview Banking Center Branch, Loop 281 And Gilmer Branch. Info updated 2011/11/10: Bank assets: $1,811,678.0 mil, Deposits: $1,190,738.0 mil, headquarters in Columbus, OH, positive income, International Specialization, 5577 total offices, Holding Company: Jpmorgan Chase & Co.
- BancorpSouth Bank: Judson Road Lpo, Longview Branch, Hawkins Parkway Branch. Info updated 2007/07/18: Bank assets: $12,990.3 mil, Deposits: $10,863.8 mil, headquarters in Tupelo, MS, positive income, Commercial Lending Specialization, 271 total offices, Holding Company: Bancorpsouth, Inc.
- Community Bank: at 101 Community Boulevard, Longview Branch, North Branch. Info updated 2006/11/03: Bank assets: $151.0 mil, Deposits: $140.3 mil, local headquarters, positive income, Commercial Lending Specialization, 4 total offices, Holding Company: East Texas Bancorp, Inc.
- Texana Bank, National Association: Texana Bank - Highway 80 Branch at 910 E. Marshall, branch established on 2008/02/15; Texana Bank - Spring Hill Branch at 3814 Gilmer Rd., branch established on 2007/06/15. Info updated 2009/07/16: Bank assets: $146.3 mil, Deposits: $115.2 mil, headquarters in Linden, TX, positive income, Commercial Lending Specialization, 4 total offices, Holding Company: Linden Bancshares, Inc.
- Spring Hill State Bank: at 3700 Gilmer Road, branch established on 1977/09/19; Hollybrook at 202 Hollybrook, branch established on 2004/04/12. Info updated 2006/11/03: Bank assets: $162.7 mil, Deposits: $140.5 mil, local headquarters, positive income, Commercial Lending Specialization, 2 total offices, Holding Company: Spring Hill Holdings Corporation
- 12 other banks with 15 local branches
For population 15 years and over in Longview:
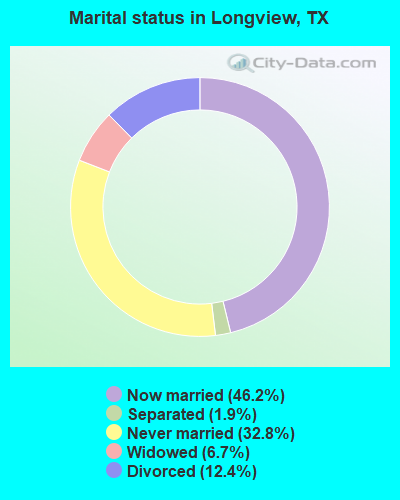
- Never married: 32.8%
- Now married: 46.2%
- Separated: 1.9%
- Widowed: 6.7%
- Divorced: 12.4%
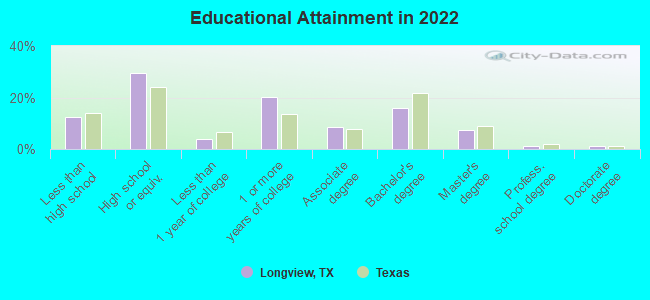
For population 25 years and over in Longview:
- High school or higher: 87.7%
- Bachelor's degree or higher: 25.7%
- Graduate or professional degree: 9.8%
- Unemployed: 7.3%
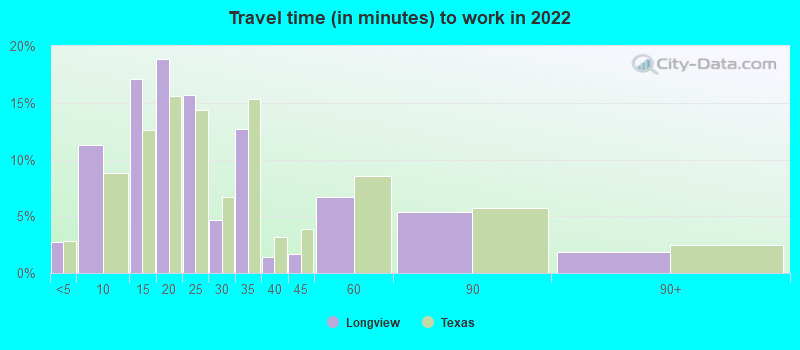
- Mean travel time to work (commute): 18.9 minutes
| Here: | 12.4 |
| Texas average: | 14.0 |
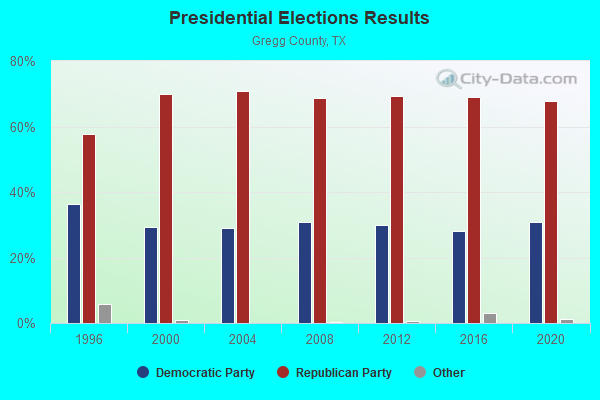
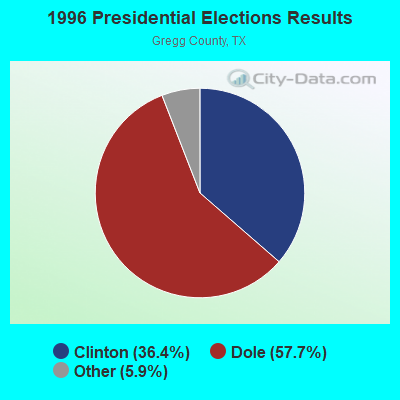

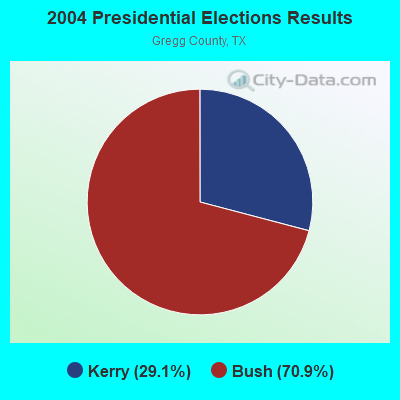

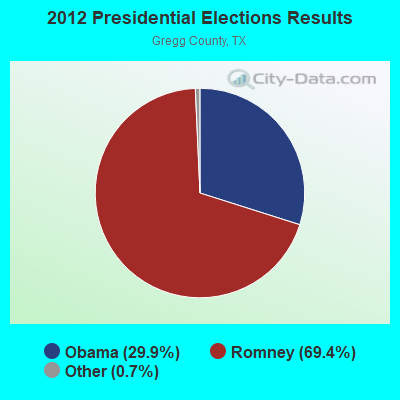
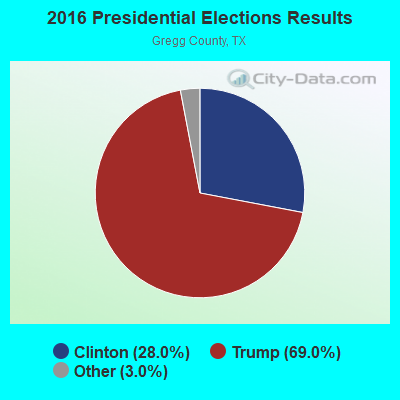
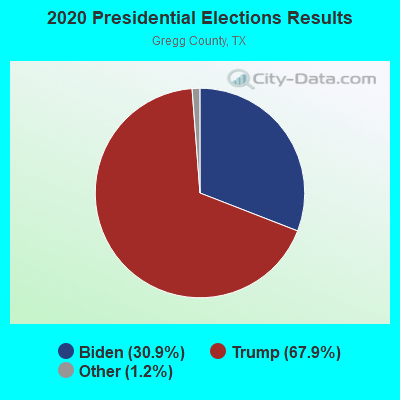
Graphs represent county-level data. Detailed 2008 Election Results
Religion statistics for Longview, TX (based on Gregg County data)
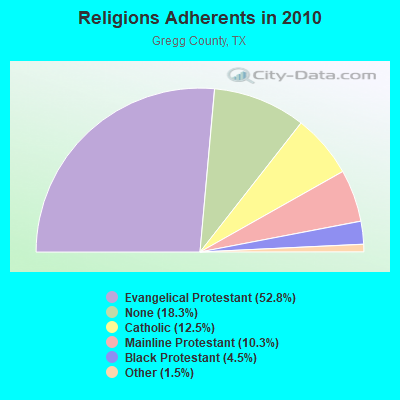
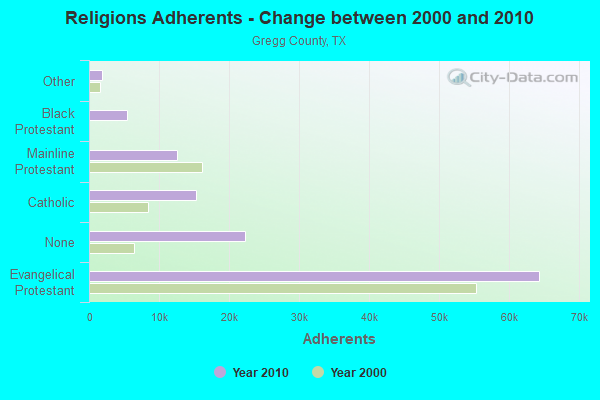
| Religion | Adherents | Congregations |
|---|---|---|
| Evangelical Protestant | 64,326 | 177 |
| Catholic | 15,271 | 4 |
| Mainline Protestant | 12,581 | 38 |
| Black Protestant | 5,479 | 24 |
| Other | 1,822 | 11 |
| None | 22,251 | - |
Food Environment Statistics:
| This county: | 1.63 / 10,000 pop. |
| Texas: | 1.47 / 10,000 pop. |
| Gregg County: | 0.26 / 10,000 pop. |
| Texas: | 0.14 / 10,000 pop. |
| Gregg County: | 1.37 / 10,000 pop. |
| Texas: | 1.11 / 10,000 pop. |
| Gregg County: | 7.87 / 10,000 pop. |
| Texas: | 3.95 / 10,000 pop. |
| Gregg County: | 7.79 / 10,000 pop. |
| State: | 6.13 / 10,000 pop. |
| Here: | 10.2% |
| State: | 8.9% |
| This county: | 29.1% |
| Texas: | 26.6% |
| This county: | 13.2% |
| Texas: | 15.7% |
Health and Nutrition:
| Longview: | 48.1% |
| State: | 48.6% |
| Longview: | 44.9% |
| Texas: | 47.4% |
| Longview: | 28.9 |
| Texas: | 28.5 |
| Longview: | 20.5% |
| State: | 20.6% |
| This city: | 11.1% |
| Texas: | 10.3% |
| This city: | 6.8 |
| Texas: | 6.8 |
| Here: | 33.9% |
| Texas: | 33.1% |
| This city: | 54.7% |
| Texas: | 56.2% |
| This city: | 79.2% |
| Texas: | 80.7% |
More about Health and Nutrition of Longview, TX Residents
| Local government employment and payroll (March 2022) | |||||
| Function | Full-time employees | Monthly full-time payroll | Average yearly full-time wage | Part-time employees | Monthly part-time payroll |
|---|---|---|---|---|---|
| Firefighters | 158 | $1,193,931 | $90,678 | 0 | $0 |
| Police Protection - Officers | 152 | $1,014,488 | $80,091 | 0 | $0 |
| Other and Unallocable | 99 | $435,284 | $52,762 | 3 | $3,537 |
| Sewerage | 58 | $219,830 | $45,482 | 0 | $0 |
| Health | 56 | $236,853 | $50,754 | 0 | $0 |
| Water Supply | 40 | $154,272 | $46,282 | 2 | $4,213 |
| Parks and Recreation | 34 | $137,414 | $48,499 | 12 | $11,244 |
| Solid Waste Management | 29 | $111,923 | $46,313 | 0 | $0 |
| Natural Resources | 29 | $105,996 | $43,860 | 0 | $0 |
| Streets and Highways | 22 | $134,508 | $73,368 | 0 | $0 |
| Judicial and Legal | 19 | $95,872 | $60,551 | 0 | $0 |
| Financial Administration | 19 | $99,514 | $62,851 | 0 | $0 |
| Local Libraries | 18 | $62,105 | $41,403 | 11 | $11,476 |
| Fire - Other | 17 | $112,981 | $79,751 | 0 | $0 |
| Police - Other | 15 | $61,414 | $49,131 | 6 | $4,018 |
| Other Government Administration | 11 | $69,449 | $75,763 | 2 | $2,449 |
| Housing and Community Development (Local) | 11 | $39,483 | $43,072 | 1 | $1,447 |
| Totals for Government | 787 | $4,285,315 | $65,342 | 37 | $38,384 |
Longview government finances - Expenditure in 2021 (per resident):
- Construction - General - Other: $9,561,000 ($115.85)
Transit Utilities: $1,260,000 ($15.27)
- Current Operations - Police Protection: $22,882,000 ($277.25)
Local Fire Protection: $22,820,000 ($276.50)
General - Other: $10,526,000 ($127.54)
Parks and Recreation: $7,872,000 ($95.38)
Water Utilities: $7,544,000 ($91.41)
Sewerage: $7,204,000 ($87.29)
Housing and Community Development: $6,646,000 ($80.53)
Natural Resources - Other: $5,863,000 ($71.04)
Regular Highways: $5,009,000 ($60.69)
Solid Waste Management: $4,965,000 ($60.16)
Transit Utilities: $1,960,000 ($23.75)
Health - Other: $1,886,000 ($22.85)
Public Welfare - Other: $1,268,000 ($15.36)
Libraries: $857,000 ($10.38)
Protective Inspection and Regulation - Other: $456,000 ($5.53)
Central Staff Services: $412,000 ($4.99)
Financial Administration: $323,000 ($3.91)
Judicial and Legal Services: $293,000 ($3.55)
Miscellaneous Commercial Activities - Other: $48,000 ($0.58)
- General - Interest on Debt: $2,850,000 ($34.53)
- Other Capital Outlay - General - Other: $1,993,000 ($24.15)
Parks and Recreation: $508,000 ($6.16)
Housing and Community Development: $264,000 ($3.20)
Natural Resources - Other: $92,000 ($1.11)
Miscellaneous Commercial Activities - Other: $17,000 ($0.21)
Police Protection: $11,000 ($0.13)
Judicial and Legal Services: $6,000 ($0.07)
Longview government finances - Revenue in 2021 (per resident):
- Charges - Sewerage: $12,713,000 ($154.04)
Other: $8,825,000 ($106.93)
Solid Waste Management: $5,528,000 ($66.98)
Parks and Recreation: $776,000 ($9.40)
- Federal Intergovernmental - Housing and Community Development: $6,854,000 ($83.05)
- Miscellaneous - Fines and Forfeits: $1,657,000 ($20.08)
Interest Earnings: $1,264,000 ($15.32)
General Revenue - Other: $734,000 ($8.89)
Sale of Property: $20,000 ($0.24)
- Revenue - Water Utilities: $21,356,000 ($258.76)
Transit Utilities: $239,000 ($2.90)
- State Intergovernmental - Other: $4,644,000 ($56.27)
Transit Utilities: $2,720,000 ($32.96)
- Tax - Property: $59,680,000 ($723.12)
General Sales and Gross Receipts: $11,793,000 ($142.89)
Other Selective Sales: $3,198,000 ($38.75)
Other License: $1,365,000 ($16.54)
Public Utilities Sales: $72,000 ($0.87)
Longview government finances - Debt in 2021 (per resident):
- Long Term Debt - Beginning Outstanding - Unspecified Public Purpose: $143,045,000 ($1733.23)
Outstanding Unspecified Public Purpose: $134,060,000 ($1624.36)
Retired Unspecified Public Purpose: $8,985,000 ($108.87)
Longview government finances - Cash and Securities in 2021 (per resident):
- Bond Funds - Cash and Securities: $49,856,000 ($604.09)
- Other Funds - Cash and Securities: $140,917,000 ($1707.44)
- Sinking Funds - Cash and Securities: $2,058,000 ($24.94)
| Businesses in Longview, TX | ||||
| Name | Count | Name | Count | |
|---|---|---|---|---|
| AT&T | 5 | Long John Silver's | 1 | |
| Academy Sports + Outdoors | 1 | Lowe's | 1 | |
| Advance Auto Parts | 2 | Marriott | 1 | |
| Aeropostale | 1 | Maurices | 1 | |
| Albertsons | 1 | Mazda | 1 | |
| American Eagle Outfitters | 1 | McDonald's | 5 | |
| Applebee's | 1 | Microtel | 1 | |
| Arby's | 1 | Motel 6 | 1 | |
| AutoZone | 2 | New Balance | 1 | |
| Baskin-Robbins | 1 | Nike | 6 | |
| Bath & Body Works | 1 | Nissan | 1 | |
| Baymont Inn | 1 | Office Depot | 1 | |
| Best Western | 2 | Old Navy | 1 | |
| Burger King | 4 | Olive Garden | 1 | |
| Burlington Coat Factory | 1 | Outback | 1 | |
| CVS | 2 | Outback Steakhouse | 1 | |
| Carl\s Jr. | 1 | Pac Sun | 1 | |
| Catherines | 1 | Papa John's Pizza | 2 | |
| Chevrolet | 1 | Payless | 1 | |
| Chick-Fil-A | 3 | Penske | 2 | |
| Chuck E. Cheese's | 1 | PetSmart | 1 | |
| Church's Chicken | 3 | Pier 1 Imports | 1 | |
| Comfort Suites | 2 | Pizza Hut | 3 | |
| Dairy Queen | 3 | Popeyes | 2 | |
| Days Inn | 1 | Quality | 1 | |
| Discount Tire | 1 | Quiznos | 1 | |
| Domino's Pizza | 2 | RadioShack | 2 | |
| Famous Footwear | 1 | Ramada | 1 | |
| FedEx | 19 | Red Lobster | 1 | |
| Finish Line | 1 | Rue21 | 1 | |
| Firestone Complete Auto Care | 1 | Ryan's Grill | 1 | |
| Foot Locker | 1 | SAS Shoes | 1 | |
| GNC | 1 | SONIC Drive-In | 9 | |
| GameStop | 3 | Sam's Club | 1 | |
| H&R Block | 6 | Sears | 2 | |
| Havertys Furniture | 1 | Spencer Gifts | 1 | |
| Hilton | 3 | Sprint Nextel | 1 | |
| Hobby Lobby | 1 | Starbucks | 3 | |
| Holiday Inn | 3 | Subway | 6 | |
| Hollister Co. | 1 | Super 8 | 1 | |
| Home Depot | 1 | T-Mobile | 4 | |
| Honda | 1 | T.J.Maxx | 1 | |
| Hot Topic | 1 | Taco Bell | 4 | |
| IHOP | 1 | Target | 1 | |
| JCPenney | 1 | Toyota | 1 | |
| Jack In The Box | 3 | Toys"R"Us | 2 | |
| Jones New York | 5 | True Value | 1 | |
| Journeys | 1 | U-Haul | 6 | |
| Justice | 1 | UPS | 22 | |
| KFC | 2 | Vans | 3 | |
| Kmart | 1 | Verizon Wireless | 3 | |
| Kohl's | 1 | Victoria's Secret | 1 | |
| Kroger | 1 | Volkswagen | 1 | |
| La Quinta | 2 | Waffle House | 2 | |
| La-Z-Boy | 1 | Walgreens | 3 | |
| Lane Bryant | 1 | Walmart | 3 | |
| Lane Furniture | 2 | Wendy's | 2 | |
| Little Caesars Pizza | 2 | Wingate | 1 | |
Strongest AM radio stations in Longview:
- KFRO (1370 AM; 1 kW; LONGVIEW, TX; Owner: WALLER MEDIA, LLC)
- KEES (1430 AM; 5 kW; GLADEWATER, TX; Owner: CITADEL BROADCASTING COMPANY)
- KOFY (1060 AM; daytime; 10 kW; GILMER, TX; Owner: JERRY RUSSELL D/B/A THE RUSSELL COMPANY)
- KEEL (710 AM; 50 kW; SHREVEPORT, LA; Owner: CITICASTERS LICENSES, L.P.)
- KWKH (1130 AM; 50 kW; SHREVEPORT, LA; Owner: CITICASTERS LICENSES, L.P.)
- KBGE (1240 AM; 1 kW; KILGORE, TX; Owner: CAPSTAR TX LIMITED PARTNERSHIP)
- KTBB (600 AM; 5 kW; TYLER, TX; Owner: CITADEL BROADCASTING COMPANY)
- KWRD (1470 AM; 5 kW; HENDERSON, TX; Owner: JERRY RUSSELL D/B/A THE RUSSELL COMPANY)
- KFXR (1190 AM; 50 kW; DALLAS, TX; Owner: CLEAR CHANNEL BROADCASTING LICENSES, INC.)
- KPYN (900 AM; 10 kW; ATLANTA, TX; Owner: FAMILY WORSHIP CENTER CHURCH, INC.)
- KRLD (1080 AM; 50 kW; DALLAS, TX; Owner: TEXAS INFINITY BROADCASTING L.P.)
- WBAP (820 AM; 50 kW; FORT WORTH, TX; Owner: WBAP-KSCS OPERATING, LTD.)
- KSKY (660 AM; 20 kW; BALCH SPRINGS, TX; Owner: BISON MEDIA, INC.)
Strongest FM radio stations in Longview:
- KYKX (105.7 FM; LONGVIEW, TX; Owner: WALLER MEDIA, LLC)
- KIXK (99.3 FM; WHITE OAK, TX; Owner: REYNOLDS RADIO, INC.)
- KFRO-FM (95.3 FM; GILMER, TX; Owner: WALLER MEDIA, LLC)
- KTAA (90.7 FM; BIG SANDY, TX; Owner: INSTITUTE IN BASIC LIFE PRINCIPLES, INC.)
- KNUE (101.5 FM; TYLER, TX; Owner: CAPSTAR TX LIMITED PARTNERSHIP)
- KKTX-FM (96.1 FM; KILGORE, TX; Owner: CAPSTAR TX LIMITED PARTNERSHIP)
- KVNE (89.5 FM; TYLER, TX; Owner: EDUC. RADIO FOUND. OF E. TEXAS, INC.)
- KPXI (100.7 FM; OVERTON, TX; Owner: INSPIRATION MEDIA OF TEXAS, LLC)
- KRMD-FM (101.1 FM; SHREVEPORT, LA; Owner: CUMULUS LICENSING CORP.)
- KTPB (88.7 FM; KILGORE, TX; Owner: KILGORE JUNIOR COLLEGE)
- KOOI (106.5 FM; JACKSONVILLE, TX; Owner: WALLER BROADCASTING, INC.)
- KBLZ (102.7 FM; WINONA, TX; Owner: S.O. 2,000, LC)
- KBJS (90.3 FM; JACKSONVILLE, TX; Owner: EAST TEXAS MEDIA ASSOCIATION, INC.)
- KTYL-FM (93.1 FM; TYLER, TX; Owner: CAPSTAR TX LIMITED PARTNERSHIP)
- KTAL-FM (98.1 FM; TEXARKANA, TX; Owner: ACCESS.1 COMMUNICATIONS - SHREVEPORT, LLC)
- KXAL-FM (100.3 FM; TATUM, TX; Owner: HUNT BROADCASTING, INC.)
- KMHT-FM (103.9 FM; MARSHALL, TX; Owner: HANSZEN BROADCAST GROUP, INC.)
- KCUL-FM (92.3 FM; MARSHALL, TX; Owner: ACCESS.1 COMMUNICATIONS CORP.-NY)
- KJTX (104.5 FM; JEFFERSON, TX; Owner: WISDOM MINISTRIES, INC.)
- KGLY (91.3 FM; TYLER, TX; Owner: EDUC. RADIO FOUND. OF E. TEXAS, INC.)
TV broadcast stations around Longview:
- KLGV-LP (Channel 10; LONGVIEW, TX; Owner: INTERNATIONAL BROADCASTING NETWORK)
- KLPN-LP (Channel 58; LONGVIEW, TX; Owner: WARWICK COMMUNICATIONS, INC.)
- KFXK (Channel 51; LONGVIEW, TX; Owner: WARWICK COMMUNICATIONS, INC.)
- KLTV (Channel 7; TYLER, TX; Owner: CIVCO, INC.)
- KTBS-TV (Channel 3; SHREVEPORT, LA; Owner: KTBS, INC.)
- KMSS-TV (Channel 33; SHREVEPORT, LA; Owner: COMCORP OF TEXAS LICENSE CORP.)
- KSLA-TV (Channel 12; SHREVEPORT, LA; Owner: KSLA, LLC)
- KETK-TV (Channel 56; JACKSONVILLE, TX; Owner: KETK LICENSEE L.P.)
- KLSB-TV (Channel 19; NACOGDOCHES, TX; Owner: KLSB ACQUISITION CORP.)
- KTAL-TV (Channel 6; TEXARKANA, TX; Owner: NEXSTAR BROADCASTING OF LOUISIANA, LLC)
- KSHV (Channel 45; SHREVEPORT, LA; Owner: WHITE KNIGHT BROADCASTING OF SHREVEPORT LIC. CORP.)
Medal of Honor Recipients
Medal of Honor Recipient born in Longview: George B. Turner.
- National Bridge Inventory (NBI) Statistics
- 146Number of bridges
- 2,129ft / 649mTotal length
- $110,872,000Total costs
- 1,501,072Total average daily traffic
- 209,895Total average daily truck traffic
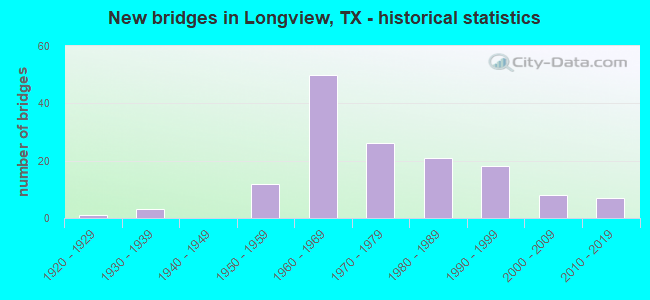
- New bridges - historical statistics
- 11920-1929
- 31930-1939
- 121950-1959
- 501960-1969
- 261970-1979
- 211980-1989
- 181990-1999
- 82000-2009
- 72010-2019
FCC Registered Antenna Towers: 733 (See the full list of FCC Registered Antenna Towers)
FCC Registered Commercial Land Mobile Towers: 5 (See the full list of FCC Registered Commercial Land Mobile Towers in Longview, TX)
FCC Registered Private Land Mobile Towers: 1 (See the full list of FCC Registered Private Land Mobile Towers)
FCC Registered Broadcast Land Mobile Towers: 105 (See the full list of FCC Registered Broadcast Land Mobile Towers)
FCC Registered Microwave Towers: 92 (See the full list of FCC Registered Microwave Towers in this town)
FCC Registered Paging Towers: 11 (See the full list of FCC Registered Paging Towers)
FCC Registered Maritime Coast & Aviation Ground Towers: 5 (See the full list of FCC Registered Maritime Coast & Aviation Ground Towers)
FCC Registered Amateur Radio Licenses: 537 (See the full list of FCC Registered Amateur Radio Licenses in Longview)
FAA Registered Aircraft Manufacturers and Dealers: 1 (See the full list of FAA Registered Manufacturers and Dealers in Longview)
FAA Registered Aircraft: 192 (See the full list of FAA Registered Aircraft)
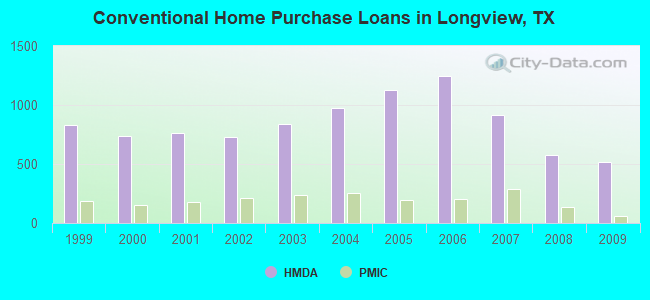
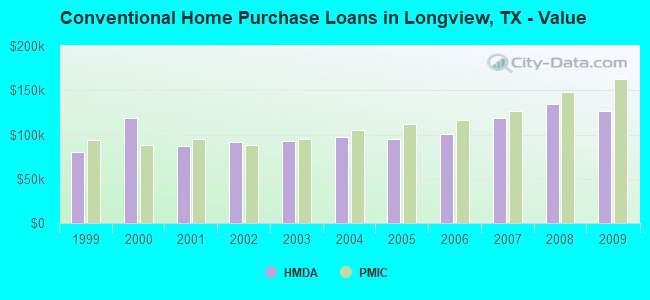
| Home Mortgage Disclosure Act Aggregated Statistics For Year 2009 (Based on 11 full and 7 partial tracts) | ||||||||||||||
| A) FHA, FSA/RHS & VA Home Purchase Loans | B) Conventional Home Purchase Loans | C) Refinancings | D) Home Improvement Loans | E) Loans on Dwellings For 5+ Families | F) Non-occupant Loans on < 5 Family Dwellings (A B C & D) | G) Loans On Manufactured Home Dwelling (A B C & D) | ||||||||
|---|---|---|---|---|---|---|---|---|---|---|---|---|---|---|
| Number | Average Value | Number | Average Value | Number | Average Value | Number | Average Value | Number | Average Value | Number | Average Value | Number | Average Value | |
| LOANS ORIGINATED | 298 | $133,796 | 521 | $127,098 | 716 | $117,408 | 112 | $44,437 | 7 | $759,009 | 284 | $88,971 | 16 | $30,459 |
| APPLICATIONS APPROVED, NOT ACCEPTED | 22 | $123,903 | 38 | $139,068 | 63 | $128,640 | 7 | $35,207 | 0 | $0 | 16 | $81,494 | 3 | $48,167 |
| APPLICATIONS DENIED | 47 | $116,495 | 82 | $129,451 | 214 | $112,511 | 62 | $28,952 | 0 | $0 | 19 | $193,105 | 13 | $47,943 |
| APPLICATIONS WITHDRAWN | 38 | $145,108 | 52 | $141,980 | 161 | $129,983 | 10 | $22,717 | 0 | $0 | 12 | $133,822 | 2 | $39,825 |
| FILES CLOSED FOR INCOMPLETENESS | 14 | $111,766 | 15 | $184,373 | 46 | $136,623 | 4 | $36,255 | 0 | $0 | 1 | $185,550 | 2 | $55,240 |
Detailed mortgage data for all 18 tracts in Longview, TX
| Private Mortgage Insurance Companies Aggregated Statistics For Year 2009 (Based on 7 full and 6 partial tracts) | ||||||
| A) Conventional Home Purchase Loans | B) Refinancings | C) Non-occupant Loans on < 5 Family Dwellings (A & B) | ||||
|---|---|---|---|---|---|---|
| Number | Average Value | Number | Average Value | Number | Average Value | |
| LOANS ORIGINATED | 57 | $162,873 | 25 | $208,644 | 1 | $36,700 |
| APPLICATIONS APPROVED, NOT ACCEPTED | 12 | $167,187 | 8 | $207,750 | 1 | $93,000 |
| APPLICATIONS DENIED | 13 | $189,662 | 7 | $165,140 | 1 | $93,000 |
| APPLICATIONS WITHDRAWN | 2 | $343,000 | 2 | $194,105 | 0 | $0 |
| FILES CLOSED FOR INCOMPLETENESS | 0 | $0 | 1 | $160,000 | 0 | $0 |
2003 - 2018 National Fire Incident Reporting System (NFIRS) incidents
- Fire incident types reported to NFIRS in Longview, TX
- 4,61249.1%Outside Fires
- 3,16533.7%Structure Fires
- 1,46215.6%Mobile Property/Vehicle Fires
- 1561.7%Other
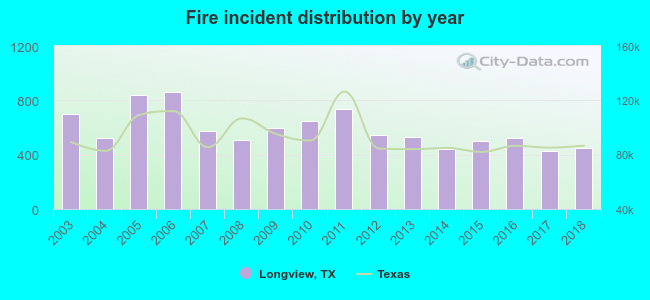 Based on the data from the years 2003 - 2018 the average number of fires per year is 587. The highest number of reported fires - 858 took place in 2006, and the least - 426 in 2017. The data has a dropping trend.
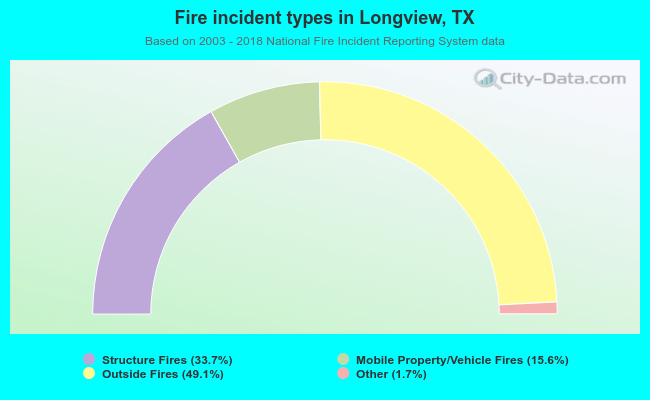 When looking into fire subcategories, the most incidents belonged to: Outside Fires (49.1%), and Structure Fires (33.7%).
Fire-safe hotels and motels in Longview, Texas:
- Guest Inn, 605 N Acess Rd, Longview, Texas 75602 , Phone: (903) 753-0350, Fax: (903) 753-0102
- Baymont Inn, 502 S Access Rd, Longview, Texas 75602 , Phone: (903) 757-3663, Fax: (903) 753-3780
- Super 8, 203 N Spur 63, Longview, Texas 75601 , Phone: (903) 757-7858, Fax: (903) 757-7031
- Longview Comfort Suites, 3307 N 4th St, Longview, Texas 75605 , Phone: (903) 663-4991, Fax: (903) 663-4991
- Longview Fairfield Inn, 3305 N 4TH St, Longview, Texas 75605 , Phone: (903) 663-1995, Fax: (903) 663-9533
- Holiday Inn Express Hotel & Suite, 900 S Access Rd, Longview, Texas 75602 , Phone: (903) 247-3000, Fax: (903) 247-3001
- Days Inn, 112 S Access Rd, Longview, Texas 75603 , Phone: (903) 758-0959, Fax: (903) 758-5991
- Wingate Inn Longview, 431 N East Loop 281, Longview, Texas 75605 , Phone: (903) 663-3196, Fax: (903) 663-3596
- 15 other hotels and motels
| Most common first names in Longview, TX among deceased individuals | ||
| Name | Count | Lived (average) |
|---|---|---|
| James | 642 | 72.0 years |
| Mary | 507 | 78.8 years |
| William | 506 | 75.7 years |
| John | 467 | 74.1 years |
| Robert | 351 | 70.6 years |
| Charles | 271 | 70.8 years |
| George | 225 | 75.0 years |
| Willie | 218 | 76.5 years |
| Dorothy | 184 | 75.3 years |
| Thomas | 182 | 73.6 years |
| Most common last names in Longview, TX among deceased individuals | ||
| Last name | Count | Lived (average) |
|---|---|---|
| Smith | 356 | 74.6 years |
| Jones | 292 | 75.3 years |
| Williams | 287 | 73.5 years |
| Johnson | 253 | 73.2 years |
| Davis | 176 | 73.8 years |
| Brown | 171 | 73.7 years |
| Moore | 148 | 74.9 years |
| Taylor | 139 | 74.7 years |
| Wilson | 136 | 76.0 years |
| Jackson | 126 | 71.5 years |
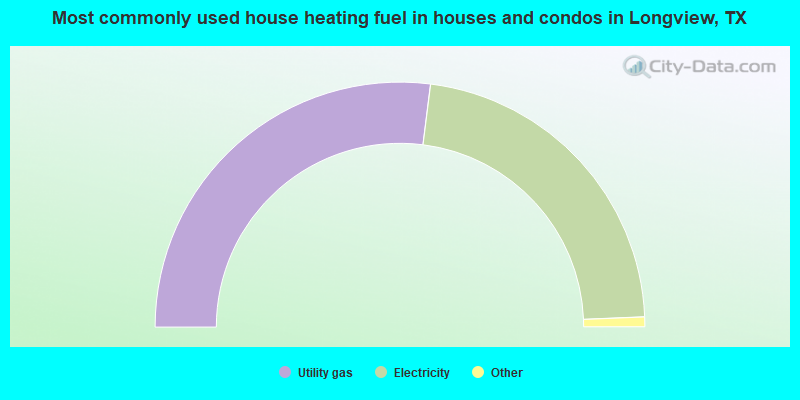
- 54.0%Utility gas
- 44.7%Electricity
- 1.0%Bottled, tank, or LP gas
- 0.3%No fuel used
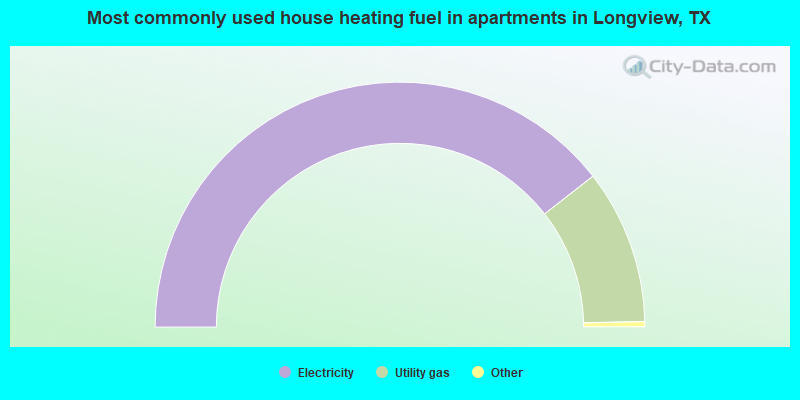
- 78.9%Electricity
- 20.4%Utility gas
- 0.3%No fuel used
- 0.2%Wood
- 0.2%Bottled, tank, or LP gas
Longview compared to Texas state average:
- Unemployed percentage below state average.
- Black race population percentage above state average.
Longview on our top lists:
- #6 on the list of "Top 101 cities with largest percentage of females in industries: management of companies and enterprises (population 50,000+)"
- #9 on the list of "Top 101 cities with largest percentage of males in industries: management of companies and enterprises (population 50,000+)"
- #10 on the list of "Top 101 cities with largest percentage of males in industries: mining, quarrying, and oil and gas extraction (population 50,000+)"
- #10 on the list of "Top 101 cities with the largest racial income disparity between any two races with at least 200 householders"
- #12 on the list of "Top 101 cities with largest percentage of females in occupations: installation, maintenance, and repair occupations (population 50,000+)"
- #14 on the list of "Top 101 cities with largest percentage of males in occupations: production occupations (population 50,000+)"
- #27 on the list of "Top 101 cities with largest percentage of females in occupations: sales and related occupations (population 50,000+)"
- #30 on the list of "Top 101 cities with largest percentage of females in industries: retail trade (population 50,000+)"
- #44 on the list of "Top 100 high-educated but low-earning cities (pop. 50,000+)"
- #48 on the list of "Top 101 cities with largest percentage of males in occupations: material moving occupations (population 50,000+)"
- #49 on the list of "Top 101 cities with the largest city-data.com crime index increase from 2011 to 2012 (population 50,000+)"
- #51 on the list of "Top 101 cities with largest percentage of females in industries: utilities (population 50,000+)"
- #56 on the list of "Top 101 cities with largest percentage of females in industries: health care and social assistance (population 50,000+)"
- #56 on the list of "Top 101 cities with largest percentage of males in industries: manufacturing (population 50,000+)"
- #75 on the list of "Top 101 cities with largest percentage of females in industries: other services, except public administration (population 50,000+)"
- #81 on the list of "Top 101 cities with the highest average humidity (population 50,000+)"
- #95 on the list of "Top 101 cities with the largest house values disparities (population 50,000+)"
- #100 on the list of "Top 101 cities with the highest number of thefts per 100,000 residents, excludes tourist destinations and others with a lot of outsiders visiting based on city industries data (population 50,000+)"
- #52 on the list of "Top 101 counties with the highest number of births per 1000 residents 2007-2013"
- #55 on the list of "Top 101 counties with the highest Sulfur Oxides Annual air pollution readings in 2012 (µg/m3)"
- #72 on the list of "Top 101 counties with the lowest percentage of residents relocating from foreign countries between 2010 and 2011 (pop. 50,000+)"
- #72 on the list of "Top 101 counties with the lowest percentage of residents relocating to foreign countries in 2011 (pop. 50,000+)"
- #87 on the list of "Top 101 counties with the lowest Nitrogen Dioxide air pollution readings in 2012 (ppm)"

|
|
Total of 214 patent applications in 2008-2024.