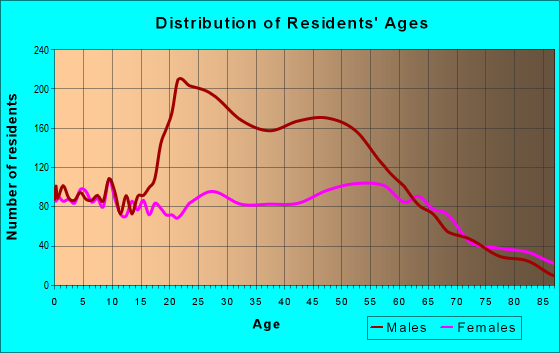
Estimated zip code population in 2022: 14,072 Zip code population in 2010: 16,638 Zip code population in 2000: 13,847
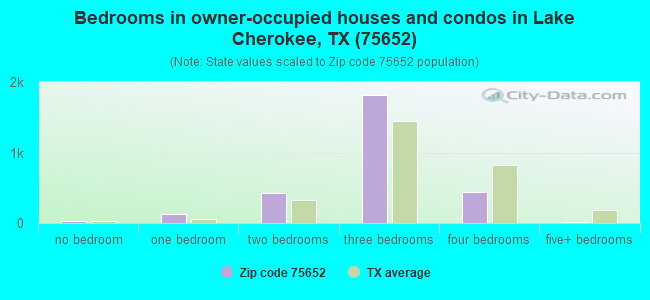
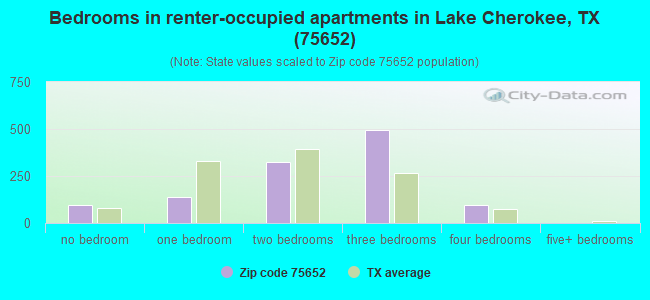
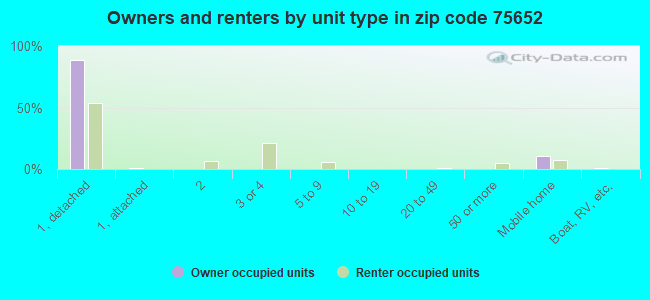
Houses and condos: 5,019 Renter-occupied apartments: 1,147
% of renters here:
29%
State:
38%
March 2022 cost of living index in zip code 75652: 82.9 (low, U.S. average is 100)
Land area: 175.7 sq. mi. Water area: 4.3 sq. mi.
Population density: 80 people per square mile
(very low).
OSM Map
General Map
Google Map
MSN Map
OSM Map
General Map
Google Map
MSN Map
OSM Map
General Map
Google Map
MSN Map
OSM Map
General Map
Google Map
MSN Map
Please wait while loading the map...
Real estate property taxes paid for housing units in 2022:
This zip code:
0.8% ($1,655)
Texas:
1.5% ($4,050)
Median real estate property taxes paid for housing units with mortgages in 2022: $2,480 (1.0%) Median real estate property taxes paid for housing units with no mortgage in 2022: $1,272 (0.7%)
Averages for the 2020 tax year for zip code 75652, filed in 2021:
Average Adjusted Gross Income (AGI) in 2020: $55,974 (Individual Income Tax Returns)
Here:
$55,974
State:
$77,054
Salary/wage: $46,494 (reported on 82.9% of returns)
Here:
$46,494
State:
$62,766
(% of AGI for various income ranges: 1259.4% for AGIs below $25k, 3600.7% for AGIs $25k-50k, 6368.6% for AGIs $50k-75k, 8762.3% for AGIs $75k-100k, 15875.7% for AGIs $100k-200k, 70047.5% for AGIs over 200k)
Taxable interest for individuals: $1,836 (reported on 26.2% of returns)
This zip code:
$1,836
Texas:
$2,665
(% of AGI for various income ranges: 13.4% for AGIs below $25k, 16.5% for AGIs $25k-50k, 56.6% for AGIs $50k-75k, 43.5% for AGIs $75k-100k, 210.3% for AGIs $100k-200k, 2452.5% for AGIs over 200k)
Ordinary dividends: $6,903 (reported on 12.7% of returns)
Here:
$6,903
State:
$10,044
(% of AGI for various income ranges: 16.3% for AGIs below $25k, 31.2% for AGIs $25k-50k, 63.4% for AGIs $50k-75k, 157.4% for AGIs $75k-100k, 357.7% for AGIs $100k-200k, 4895.0% for AGIs over 200k)
Net capital gain/loss in AGI: +$13,225 (reported on 12.0% of returns)
Here:
+$13,225
State:
+$39,590
(% of AGI for various income ranges: 3.5% for AGIs below $25k, 27.5% for AGIs $25k-50k, 103.2% for AGIs $50k-75k, 254.8% for AGIs $75k-100k, 561.1% for AGIs $100k-200k, 11737.5% for AGIs over 200k)
Profit/loss from business: +$7,260 (reported on 17.3% of returns)
Here:
+$7,260
State:
+$10,888
(% of AGI for various income ranges: 49.6% for AGIs below $25k, 95.9% for AGIs $25k-50k, 66.2% for AGIs $50k-75k, 63.5% for AGIs $75k-100k, 527.7% for AGIs $100k-200k, 5912.5% for AGIs over 200k)
Taxable individual retirement arrangement distribution: $23,915 (reported on 8.7% of returns)
75652:
$23,915
Texas:
$24,740
(% of AGI for various income ranges: 33.2% for AGIs below $25k, 81.2% for AGIs $25k-50k, 265.4% for AGIs $50k-75k, 497.7% for AGIs $75k-100k, 1436.9% for AGIs $100k-200k, 4147.5% for AGIs over 200k)
Total itemized deductions: $39,325 (reported on 4.6% of returns)
Here:
$39,325
State:
$40,428
(% of AGI for various income ranges: 132.0% for AGIs $25k-50k, 238.8% for AGIs $50k-75k, 342.9% for AGIs $75k-100k, 718.0% for AGIs $100k-200k, 7940.0% for AGIs over 200k)
Charity contributions: $15,100 (reported on 3.4% of returns)
Here:
$15,100
State:
$18,201
(% of AGI for various income ranges: 12.0% for AGIs $25k-50k, 61.0% for AGIs $50k-75k, 218.9% for AGIs $100k-200k, 3777.5% for AGIs over 200k)
Taxes paid: $6,714 (reported on 4.2% of returns)
75652:
$6,714
State:
$7,821
(% of AGI for various income ranges: 18.3% for AGIs $25k-50k, 32.8% for AGIs $50k-75k, 36.8% for AGIs $75k-100k, 151.1% for AGIs $100k-200k, 1157.5% for AGIs over 200k)
Earned income credit: $2,659 (reported on 23.3% of returns)
Here:
$2,659
State:
$2,584
(% of AGI for various income ranges: 138.6% for AGIs below $25k, 95.7% for AGIs $25k-50k)
Percentage of individuals using paid preparers for their 2020 taxes: 93.5%
Here:
94%
State:
92%
(% for various income ranges: 93.2% for AGIs below $25k, 93.5% for AGIs $25k-50k, 92.8% for AGIs $50k-75k, 95.2% for AGIs $75k-100k, 94.9% for AGIs $100k-200k, 92.9% for AGIs over 200k)
Averages for the 2012 tax year for zip code 75652, filed in 2013:
Average Adjusted Gross Income (AGI) in 2012: $50,203 (Individual Income Tax Returns)
Here:
$50,203
State:
$65,384
Salary/wage: $41,806 (reported on 86.5% of returns)
Here:
$41,806
State:
$52,524
(% of AGI for various income ranges: 82.0% for AGIs below $25k, 85.0% for AGIs $25k-50k, 78.4% for AGIs $50k-75k, 77.8% for AGIs $75k-100k, 72.1% for AGIs $100k-200k, 39.6% for AGIs over 200k)
Taxable interest for individuals: $1,482 (reported on 27.6% of returns)
This zip code:
$1,482
Texas:
$2,372
(% of AGI for various income ranges: 0.9% for AGIs below $25k, 0.6% for AGIs $25k-50k, 0.5% for AGIs $50k-75k, 0.6% for AGIs $75k-100k, 1.0% for AGIs $100k-200k, 1.3% for AGIs over 200k)
Ordinary dividends: $4,803 (reported on 13.3% of returns)
Here:
$4,803
State:
$9,721
(% of AGI for various income ranges: 1.0% for AGIs below $25k, 0.8% for AGIs $25k-50k, 0.9% for AGIs $50k-75k, 1.0% for AGIs $75k-100k, 1.4% for AGIs $100k-200k, 2.4% for AGIs over 200k)
Net capital gain/loss in AGI: +$17,696 (reported on 10.7% of returns)
Here:
+$17,696
State:
+$35,319
(% of AGI for various income ranges: 0.3% for AGIs $25k-50k, 0.9% for AGIs $75k-100k, 2.2% for AGIs $100k-200k, 18.8% for AGIs over 200k)
Profit/loss from business: +$13,287 (reported on 14.9% of returns)
Here:
+$13,287
State:
+$13,732
(% of AGI for various income ranges: 5.4% for AGIs below $25k, 1.8% for AGIs $25k-50k, 2.2% for AGIs $50k-75k, 3.1% for AGIs $75k-100k, 5.2% for AGIs $100k-200k, 6.2% for AGIs over 200k)
Taxable individual retirement arrangement distribution: $16,219 (reported on 9.3% of returns)
75652:
$16,219
Texas:
$19,511
(% of AGI for various income ranges: 2.4% for AGIs below $25k, 2.1% for AGIs $25k-50k, 3.2% for AGIs $50k-75k, 3.7% for AGIs $75k-100k, 4.6% for AGIs $100k-200k, 1.4% for AGIs over 200k)
Total itemized deductions: $22,961 (21% of AGI, reported on 17.5% of returns)
Here:
$22,961
State:
$24,724
Here:
21.4% of AGI
State:
15.9% of AGI
(% of AGI for various income ranges: 4.5% for AGIs below $25k, 6.4% for AGIs $25k-50k, 7.5% for AGIs $50k-75k, 7.9% for AGIs $75k-100k, 10.1% for AGIs $100k-200k, 9.6% for AGIs over 200k)
Charity contributions: $6,432 (reported on 14.1% of returns)
Here:
$6,432
State:
$6,808
(% of AGI for various income ranges: 0.6% for AGIs below $25k, 1.0% for AGIs $25k-50k, 1.4% for AGIs $50k-75k, 2.3% for AGIs $75k-100k, 2.4% for AGIs $100k-200k, 2.7% for AGIs over 200k)
Taxes paid: $4,241 (reported on 16.9% of returns)
75652:
$4,241
State:
$6,921
(% of AGI for various income ranges: 0.5% for AGIs below $25k, 1.0% for AGIs $25k-50k, 1.2% for AGIs $50k-75k, 1.5% for AGIs $75k-100k, 2.2% for AGIs $100k-200k, 1.7% for AGIs over 200k)
Earned income credit: $2,508 (reported on 24.8% of returns)
Here:
$2,508
State:
$2,570
(% of AGI for various income ranges: 9.2% for AGIs below $25k, 1.5% for AGIs $25k-50k)
Percentage of individuals using paid preparers for their 2012 taxes: 59.3%
Here:
59%
State:
51%
(% for various income ranges: 54.6% for AGIs below $25k, 59.7% for AGIs $25k-50k, 62.5% for AGIs $50k-75k, 61.9% for AGIs $75k-100k, 68.2% for AGIs $100k-200k, 80.0% for AGIs over 200k)
Averages for the 2004 tax year for zip code 75652, filed in 2005:
Average Adjusted Gross Income (AGI) in 2004: $37,991 (Individual Income Tax Returns)
Here:
$37,991
State:
$47,881
Salary/wage: $31,506 (reported on 84.3% of returns)
Here:
$31,506
State:
$41,947
(% of AGI for various income ranges: 129.2% for AGIs below $10k, 80.9% for AGIs $10k-25k, 81.2% for AGIs $25k-50k, 76.0% for AGIs $50k-75k, 75.5% for AGIs $75k-100k, 43.7% for AGIs over 100k)
Taxable interest for individuals: $2,098 (reported on 32.0% of returns)
This zip code:
$2,098
Texas:
$2,255
(% of AGI for various income ranges: 5.2% for AGIs below $10k, 1.7% for AGIs $10k-25k, 1.3% for AGIs $25k-50k, 1.4% for AGIs $50k-75k, 2.0% for AGIs $75k-100k, 2.1% for AGIs over 100k)
Taxable dividends: $2,956 (reported on 17.4% of returns)
Here:
$2,956
State:
$4,261
(% of AGI for various income ranges: 3.2% for AGIs below $10k, 0.8% for AGIs $10k-25k, 1.0% for AGIs $25k-50k, 1.2% for AGIs $50k-75k, 1.2% for AGIs $75k-100k, 2.0% for AGIs over 100k)
Net capital gain/loss: +$8,070 (reported on 14.8% of returns)
Here:
+$8,070
State:
+$16,110
(% of AGI for various income ranges: -1.1% for AGIs below $10k, 0.4% for AGIs $10k-25k, 0.7% for AGIs $25k-50k, 1.0% for AGIs $50k-75k, 2.4% for AGIs $75k-100k, 8.7% for AGIs over 100k)
Profit/loss from business: +$10,024 (reported on 16.1% of returns)
Here:
+$10,024
State:
+$11,013
(% of AGI for various income ranges: 6.7% for AGIs below $10k, 4.1% for AGIs $10k-25k, 2.3% for AGIs $25k-50k, 2.0% for AGIs $50k-75k, 3.5% for AGIs $75k-100k, 7.8% for AGIs over 100k)
IRA payment deduction: $3,509 (reported on 2.2% of returns)
75652:
$3,509
Texas:
$3,120
(% of AGI for various income ranges: 0.2% for AGIs $10k-25k, 0.3% for AGIs $25k-50k, 0.2% for AGIs $50k-75k, 0.2% for AGIs $75k-100k, 0.2% for AGIs over 100k)
Self-employed pension: $18,500 (reported on 0.3% of returns)
Here:
$18,500
Texas:
$16,401
Total itemized deductions: $17,497 (22% of AGI, reported on 16.0% of returns)
Here:
$17,497
State:
$19,631
Here:
22.4% of AGI
State:
18.9% of AGI
(% of AGI for various income ranges: 7.9% for AGIs below $10k, 4.7% for AGIs $10k-25k, 5.8% for AGIs $25k-50k, 8.3% for AGIs $50k-75k, 9.8% for AGIs $75k-100k, 7.9% for AGIs over 100k)
Charity contributions deductions: $5,350 (7% of AGI, reported on 13.6% of returns)
Here:
$5,350
State:
$4,753
Here:
6.5% of AGI
State:
4.2% of AGI
(% of AGI for various income ranges: 0.7% for AGIs below $10k, 0.9% for AGIs $10k-25k, 1.3% for AGIs $25k-50k, 2.1% for AGIs $50k-75k, 2.6% for AGIs $75k-100k, 2.5% for AGIs over 100k)
Total tax: $5,927 (reported on 66.1% of returns)
75652:
$5,927
State:
$9,058
(% of AGI for various income ranges: 3.2% for AGIs below $10k, 2.9% for AGIs $10k-25k, 6.0% for AGIs $25k-50k, 8.9% for AGIs $50k-75k, 11.0% for AGIs $75k-100k, 18.7% for AGIs over 100k)
Earned income credit: $2,021 (reported on 26.9% of returns)
Here:
$2,021
State:
$2,024
Percentage of individuals using paid preparers for their 2004 taxes: 65.3%
Here:
65%
State:
57%
(% for various income ranges: 54.5% for AGIs below $10k, 68.7% for AGIs $10k-25k, 67.2% for AGIs $25k-50k, 65.6% for AGIs $50k-75k, 70.1% for AGIs $75k-100k, 76.5% for AGIs over 100k)
Likely homosexual households (counted as self-reported same-sex unmarried-partner households)
Lesbian couples: 0.5% of all households
Gay men: 0.0% of all households
Household received Food Stamps/SNAP in the past 12 months: 505 Household did not receive Food Stamps/SNAP in the past 12 months: 3,502
Women who had a birth in the past 12 months: 113 (107 now married, 7 unmarried) Women who did not have a birth in the past 12 months: 2,564 (1,035 now married, 1,531 unmarried)
Housing units in zip code 75652 with a mortgage: 1,078 (72 second mortgage, 48 home equity loan, 6 both second mortgage and home equity loan) Median monthly owner costs for units with a mortgage: $1,644 Median monthly owner costs for units without a mortgage: $475
Residents with income below the poverty level in 2022:
This zip code:
12.7%
Whole state:
14.0%
Residents with income below 50% of the poverty level in 2022:
This zip code:
6.4%
Whole state:
7.4%
Median number of rooms in houses and condos:
Here:
5.9
State:
6.3
Median number of rooms in apartments:
Here:
4.9
State:
4.0
Notable locations in this zip code not listed on our city pages
Notable locations in zip code 75652: Crims Chapel (A), Henderson Commercial Historic District (B), Depot Museum (C), Depot Museum Complex (D), Church Hill Volunteer Fire Department (E), Crisms Chapel Volunteer Fire Department (F), Henderson Fire Department Station 2 (G), Henderson Fire Department Central Station 1 (H), Texas Forest Service Henderson Office (I), Elderville - Lakeport Volunteer Fire Department Station 3 (J). Display/hide their locations on the map
Churches in zip code 75652 include: Union Chapel (A), Freedonia Church (B), Church Hill (C), Millville Church (D), First Presbyterian Church (E), The Church of Jesus Christ of Latter Day Saints (F), Church of the Nazarene (G), Wayside Church of God in Christ (H), South Oak Saint Church of Christ (I). Display/hide their locations on the map
Cemeteries: Wasson Cemetery (1), Mount Vernon Cemetery (2), New Hope Cemetery (3), Chapman Cemetery (4), Pryor Cemetery (5), Craig Cemetery (6), Wright Cemetery (7). Display/hide their locations on the map
Lakes, reservoirs, and swamps: Nix Lake (A), Willow Lake (B), Shaw Lake (C), Lake Roman (D), Browns Lake (E), Long Glade Lake (F), Lake Cherokee (G), Roman Lake (H). Display/hide their locations on the map
Streams, rivers, and creeks: Boggy Creek (A), Boggy Branch (B), Walkers Creek (C), Sheffield Branch (D), Prospect Branch (E), Todd Branch (F), Flanigan Branch (G), Mill Creek (H), Lee Creek (I). Display/hide their locations on the map
In group quarters: 4,096 (-1 institutionalized population)
Size of family households: 1,220 2-persons, 486 3-persons, 636 4-persons, 120 5-persons, 116 6-persons, 83 7-or-more-persons
Size of nonfamily households: 1,090 1-person, 237 2-persons, 21 3-persons
1,420 married couples with children.
436 single-parent households (47 men, 389 women).
87.9% of residents of 75652 zip code speak English at home.
11.4% of residents speak Spanish at home (76% very well, 15% well, 5% not well, 4% not at all).
0.4% of residents speak other Indo-European language at home (100% very well).
0.3% of residents speak Asian or Pacific Island language at home (78% very well, 22% not well).
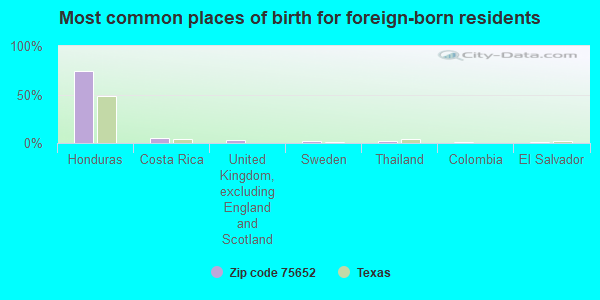
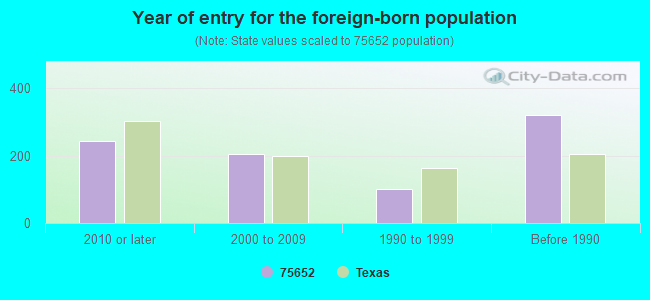
Foreign born population: 787 (5.6%) (47.3% of them are naturalized citizens)
This zip code:
5.6%
Whole state:
17.2%
74%Honduras
5%Costa Rica
3%United Kingdom, excluding England and Scotland
2%Sweden
2%Thailand
1%Colombia
1%El Salvador
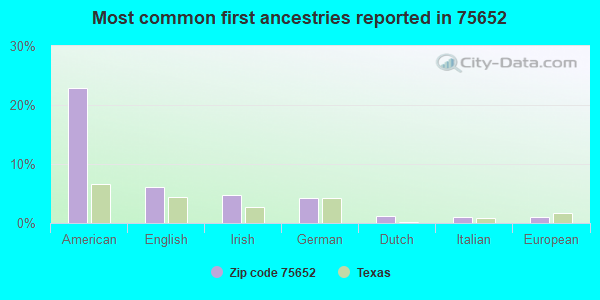
23%American
6%English
5%Irish
4%German
1%Dutch
1%Italian
1%European
Year of entry for the foreign-born population
2442010 or later
2042000 to 2009
1011990 to 1999
320Before 1990
Facilities with environmental interests located in this zip code:
A A AUTO PARTS INC (700 E MAIN ST in HENDERSON, TX)
(Resource Conservation and Recovery Act (tracking hazardous waste))
Housing units lacking complete plumbing facilities: 0.6% Housing units lacking complete kitchen facilities: 3.3%
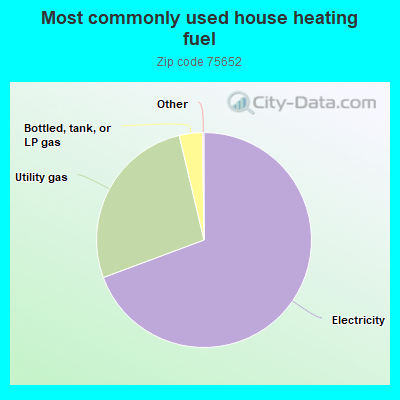
69.4%Electricity
27.0%Utility gas
3.5%Bottled, tank, or LP gas
Population in 1990: 19,836.
Place of birth for U.S.-born residents:
This state: 10,909
Northeast: 142
Midwest: 494
South: 924
West: 626
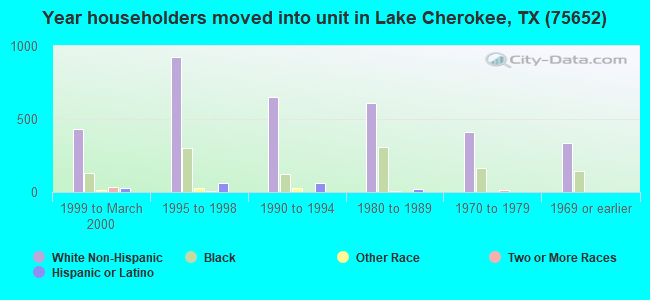
66% of the 75652 zip code residents lived in the same house 5 years ago. Out of people who lived in different houses, 49% lived in this county. Out of people who lived in different counties, 50% lived in Texas.
66% of the 75652 zip code residents lived in the same house 1 year ago. Out of people who lived in different houses, 11% moved from this county. Out of people who lived in different houses, 89% moved from different county within same state. Out of people who lived in different houses, 1% moved from different state. Out of people who lived in different houses, 0% moved from abroad.
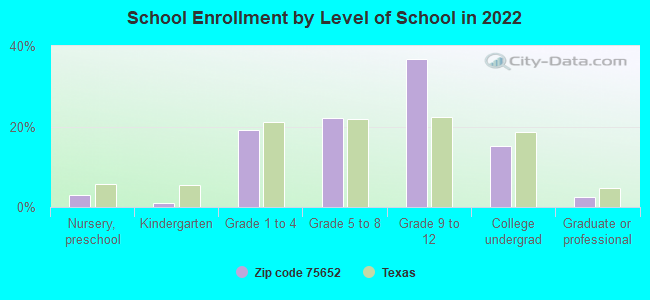
Private vs. public school enrollment:
Students in private schools in grades 1 to 8 (elementary and middle school): 70
Here:
7.1%
Texas:
8.8%
Students in private schools in grades 9 to 12 (high school): 18
Here:
2.1%
Texas:
8.0%
Students in private undergraduate colleges: 70
Here:
19.2%
Texas:
16.2%
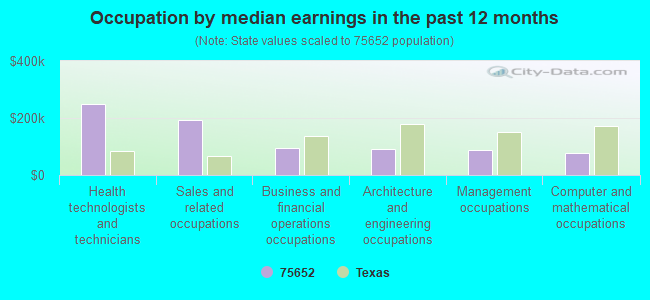
Occupation by median earnings in the past 12 months ($)
247,643Health technologists and technicians
192,580Sales and related occupations
95,955Business and financial operations occupations
91,666Architecture and engineering occupations
88,206Management occupations
76,502Computer and mathematical occupations
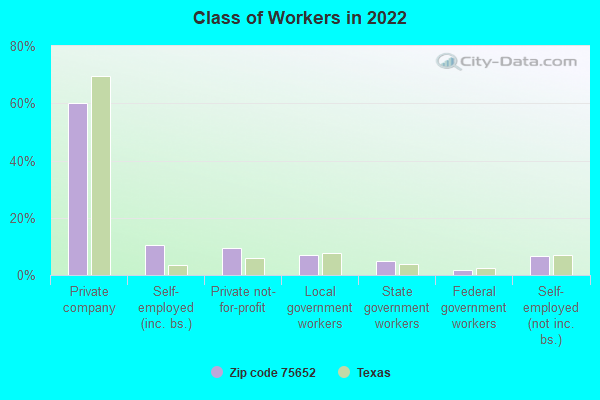
Companies with federal contracts located in this zip code:
COGGINS, THOMAS R (14955 CR 2165D in HENDERSON, TX; small business) : $37,700 in 7 contractsfrom 2004 to 2005
Contracts for Reserve Training (Military) by Army Signed by year:2000: $0; 2001: $0; 2002: $0; 2003: $0; 2004: $42,500; 2005: -$4,800; 2006: $0.
Biggest contracts:
$18,300 with Army for Reserve Training (Military). Signed on 2004-10-04. Completion date: 2004-09-30.
$9,300, same as above.Signed on 2004-08-09. Completion date: 2004-08-31.
$9,000, same as above.Signed on 2004-09-01. Completion date: 2004-09-30.
$3,600, same as above.Signed on 2004-12-13. Completion date: 2004-09-30.
Top industries in this zip code by the number of employees in 2005:
Mining: Drilling Oil and Gas Wells (250-499 employees: 1 establishment, 5-9 employees: 1 establishment)
Health Care and Social Assistance: General Medical and Surgical Hospitals (250-499: 1)
2002 - 2018 National Fire Incident Reporting System (NFIRS) incidents
Based on the data from the years 2002 - 2018 the average number of fire incidents per year is 106. The highest number of fire incidents - 230 took place in 2018, and the least - 27 in 2009. The data has an increasing trend.
When looking into fire subcategories, the most incidents belonged to: Outside Fires (53.9%), and Structure Fires (26.1%).
Fire incident types reported to NFIRS in Zip Code 75652
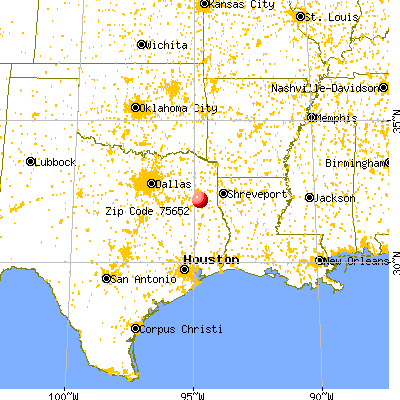


 Nearest zip codes: 75603, 75691, 75654, 75662, 75641, 75682.


 Based on the data from the years 2002 - 2018 the average number of fire incidents per year is 106. The highest number of fire incidents - 230 took place in 2018, and the least - 27 in 2009. The data has an increasing trend.
 When looking into fire subcategories, the most incidents belonged to: Outside Fires (53.9%), and Structure Fires (26.1%).