Estimated zip code population in 2022: 2,662 Zip code population in 2010: 2,562 Zip code population in 2000: 2,535
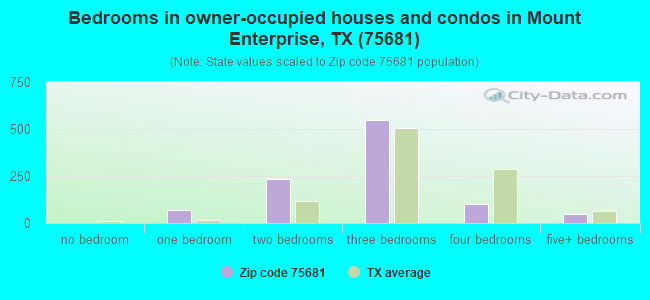
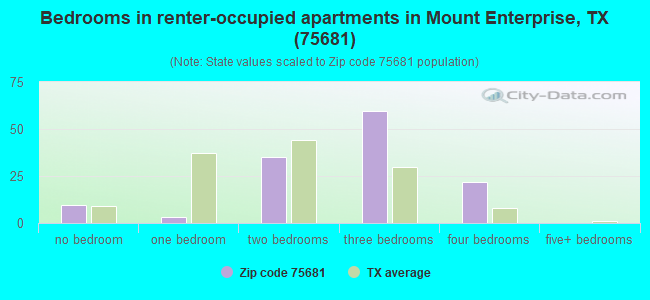
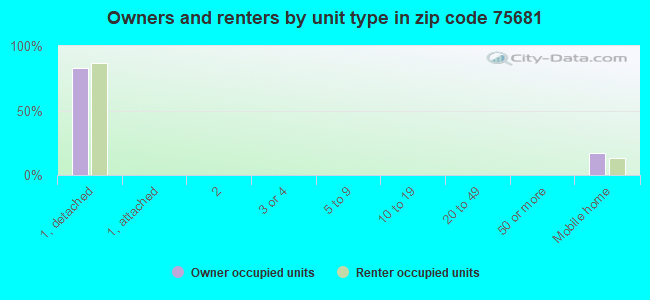
Houses and condos: 1,327 Renter-occupied apartments: 128
% of renters here:
11%
State:
38%
March 2022 cost of living index in zip code 75681: 79.9 (low, U.S. average is 100)
Land area: 128.4 sq. mi. Water area: 0.2 sq. mi.
Population density: 21 people per square mile
(very low).
OSM Map
General Map
Google Map
MSN Map
OSM Map
General Map
Google Map
MSN Map
OSM Map
General Map
Google Map
MSN Map
OSM Map
General Map
Google Map
MSN Map
Please wait while loading the map...
Real estate property taxes paid for housing units in 2022:
This zip code:
0.7% ($1,256)
Texas:
1.5% ($4,050)
Median real estate property taxes paid for housing units with mortgages in 2022: $1,727 (0.9%) Median real estate property taxes paid for housing units with no mortgage in 2022: $845 (0.6%)
Business Search- 14 Million verified businesses
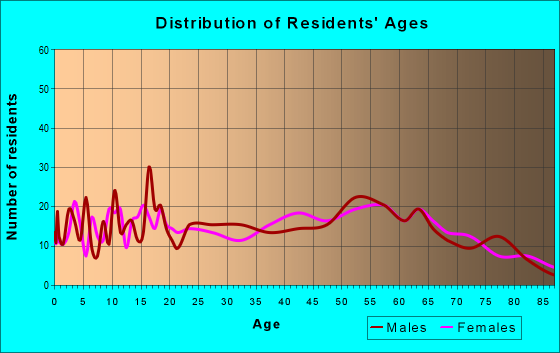
Males: 1,222
(45.9%)
Females: 1,440
(54.1%)
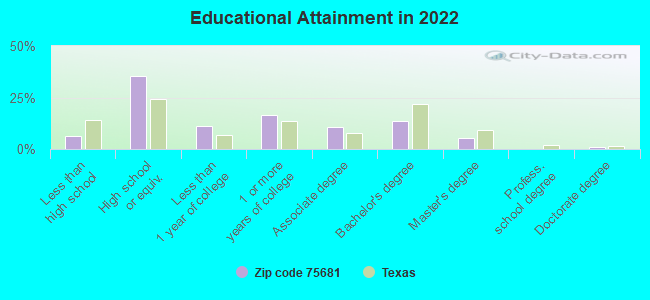
For population 25 years and over in 75681:
High school or higher: 92.7%
Bachelor's degree or higher: 19.5%
Graduate or professional degree: 6.0%
Unemployed: 3.6%
Mean travel time to work (commute): 26.9 minutes
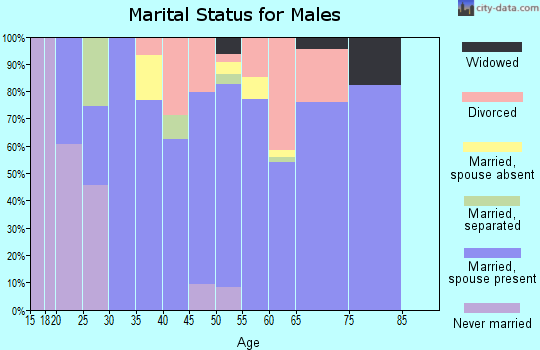
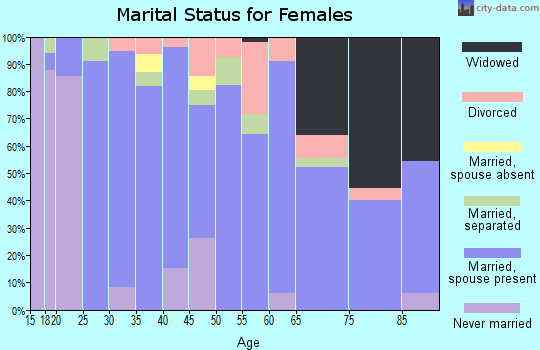
For population 15 years and over in 75681:
Never married: 30.3%
Now married: 47.9%
Separated: 1.8%
Widowed: 7.4%
Divorced: 12.6%
Zip code 75681 compared to state average:
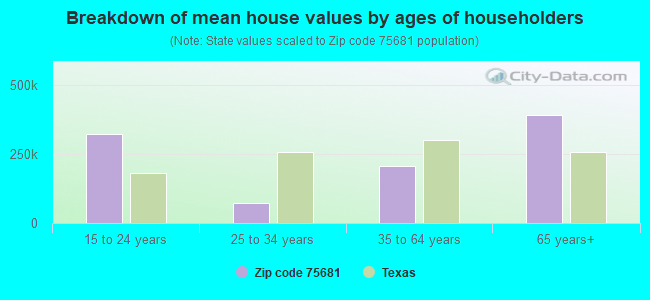
Median house value below state average.
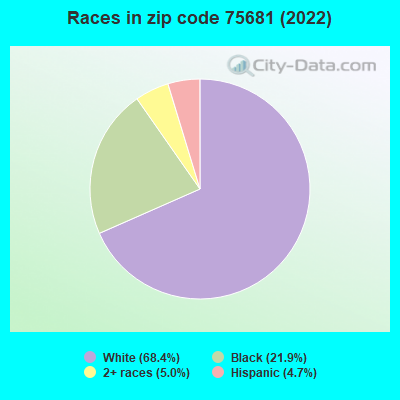
Black race population percentage above state average.
Hispanic race population percentage significantly below state average.
Median age significantly above state average.
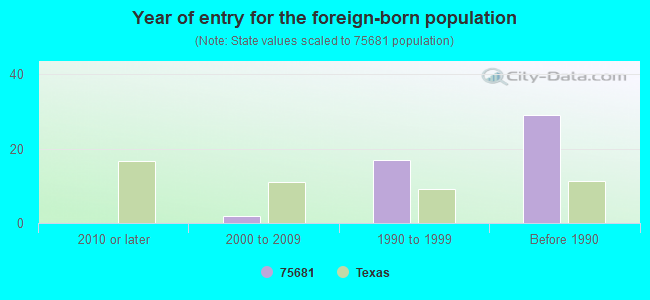
Foreign-born population percentage significantly below state average.
Renting percentage significantly below state average.
Length of stay since moving in significantly above state average.
Percentage of population with a bachelor's degree or higher below state average.
Averages for the 2020 tax year for zip code 75681, filed in 2021:
Average Adjusted Gross Income (AGI) in 2020: $46,770 (Individual Income Tax Returns)
Here:
$46,770
State:
$77,054
Salary/wage: $44,358 (reported on 78.6% of returns)
Here:
$44,358
State:
$62,766
(% of AGI for various income ranges: 1216.5% for AGIs below $25k, 3422.7% for AGIs $25k-50k, 5959.2% for AGIs $50k-75k, 8098.6% for AGIs $75k-100k, 17947.5% for AGIs $100k-200k)
Taxable interest for individuals: $685 (reported on 22.2% of returns)
This zip code:
$685
Texas:
$2,665
(% of AGI for various income ranges: 11.8% for AGIs below $25k, 2.3% for AGIs $25k-50k, 60.0% for AGIs $50k-75k, 50.0% for AGIs $75k-100k, 23.8% for AGIs $100k-200k)
Ordinary dividends: $2,058 (reported on 10.3% of returns)
Here:
$2,058
State:
$10,044
(% of AGI for various income ranges: 33.8% for AGIs below $25k, 57.7% for AGIs $50k-75k, 30.0% for AGIs $75k-100k, 45.0% for AGIs $100k-200k)
Net capital gain/loss in AGI: +$4,283 (reported on 10.3% of returns)
Here:
+$4,283
State:
+$39,590
(% of AGI for various income ranges: 36.8% for AGIs below $25k, 165.4% for AGIs $50k-75k, 217.5% for AGIs $100k-200k)
Profit/loss from business: +$6,521 (reported on 20.5% of returns)
Here:
+$6,521
State:
+$10,888
(% of AGI for various income ranges: 151.5% for AGIs below $25k, 213.5% for AGIs $25k-50k, 236.2% for AGIs $50k-75k, 268.6% for AGIs $75k-100k)
Taxable individual retirement arrangement distribution: $19,033 (reported on 7.7% of returns)
75681:
$19,033
Texas:
$24,740
(% of AGI for various income ranges: 111.8% for AGIs below $25k, 399.2% for AGIs $50k-75k, 1162.9% for AGIs $75k-100k)
Total itemized deductions: $30,040 (reported on 4.3% of returns)
Here:
$30,040
State:
$40,428
(% of AGI for various income ranges: 167.6% for AGIs below $25k, 1331.4% for AGIs $75k-100k)
Charity contributions: $9,575 (reported on 3.4% of returns)
Here:
$9,575
State:
$18,201
(% of AGI for various income ranges: 547.1% for AGIs $75k-100k)
Taxes paid: $4,625 (reported on 3.4% of returns)
75681:
$4,625
State:
$7,821
(% of AGI for various income ranges: 264.3% for AGIs $75k-100k)
Earned income credit: $2,393 (reported on 23.9% of returns)
Here:
$2,393
State:
$2,584
(% of AGI for various income ranges: 122.4% for AGIs below $25k, 97.7% for AGIs $25k-50k)
Percentage of individuals using paid preparers for their 2020 taxes: 94.9%
Here:
95%
State:
92%
(% for various income ranges: 93.5% for AGIs below $25k, 96.8% for AGIs $25k-50k, 94.4% for AGIs $50k-75k, 100.0% for AGIs $75k-100k, 92.3% for AGIs $100k-200k)
Averages for the 2012 tax year for zip code 75681, filed in 2013:
Average Adjusted Gross Income (AGI) in 2012: $44,733 (Individual Income Tax Returns)
Here:
$44,733
State:
$65,384
Salary/wage: $39,131 (reported on 83.8% of returns)
Here:
$39,131
State:
$52,524
(% of AGI for various income ranges: 75.6% for AGIs below $25k, 83.5% for AGIs $25k-50k, 74.6% for AGIs $50k-75k, 80.1% for AGIs $75k-100k, 60.9% for AGIs $100k-200k)
Taxable interest for individuals: $736 (reported on 26.7% of returns)
This zip code:
$736
Texas:
$2,372
(% of AGI for various income ranges: 0.8% for AGIs below $25k, 0.3% for AGIs $25k-50k, 0.4% for AGIs $50k-75k, 0.8% for AGIs $75k-100k, 0.2% for AGIs $100k-200k)
Ordinary dividends: $2,736 (reported on 10.5% of returns)
Here:
$2,736
State:
$9,721
(% of AGI for various income ranges: 0.9% for AGIs below $25k, 0.4% for AGIs $25k-50k, 0.3% for AGIs $50k-75k, 2.3% for AGIs $75k-100k)
Net capital gain/loss in AGI: +$10,188 (reported on 7.6% of returns)
Here:
+$10,188
State:
+$35,319
(% of AGI for various income ranges: 0.6% for AGIs $50k-75k, 5.2% for AGIs $100k-200k)
Profit/loss from business: +$10,750 (reported on 21.0% of returns)
Here:
+$10,750
State:
+$13,732
(% of AGI for various income ranges: 10.4% for AGIs below $25k, 4.2% for AGIs $25k-50k, 4.6% for AGIs $50k-75k, 12.0% for AGIs $75k-100k)
Taxable individual retirement arrangement distribution: $12,844 (reported on 8.6% of returns)
75681:
$12,844
Texas:
$19,511
Total itemized deductions: $21,088 (24% of AGI, reported on 16.2% of returns)
Here:
$21,088
State:
$24,724
Here:
24.1% of AGI
State:
15.9% of AGI
(% of AGI for various income ranges: 5.9% for AGIs below $25k, 8.3% for AGIs $25k-50k, 6.6% for AGIs $50k-75k, 8.5% for AGIs $75k-100k, 7.9% for AGIs $100k-200k)
Charity contributions: $6,485 (reported on 12.4% of returns)
Here:
$6,485
State:
$6,808
(% of AGI for various income ranges: 1.7% for AGIs $25k-50k, 1.6% for AGIs $50k-75k, 2.3% for AGIs $75k-100k, 2.4% for AGIs $100k-200k)
Taxes paid: $2,971 (reported on 16.2% of returns)
75681:
$2,971
State:
$6,921
(% of AGI for various income ranges: 0.6% for AGIs below $25k, 0.8% for AGIs $25k-50k, 0.8% for AGIs $50k-75k, 1.3% for AGIs $75k-100k, 1.5% for AGIs $100k-200k)
Earned income credit: $2,404 (reported on 26.7% of returns)
Here:
$2,404
State:
$2,570
(% of AGI for various income ranges: 9.3% for AGIs below $25k, 1.4% for AGIs $25k-50k)
Percentage of individuals using paid preparers for their 2012 taxes: 59.0%
Here:
59%
State:
51%
(% for various income ranges: 53.3% for AGIs below $25k, 55.2% for AGIs $25k-50k, 69.2% for AGIs $50k-75k, 66.7% for AGIs $75k-100k, 77.8% for AGIs $100k-200k)
Averages for the 2004 tax year for zip code 75681, filed in 2005:
Average Adjusted Gross Income (AGI) in 2004: $30,323 (Individual Income Tax Returns)
Here:
$30,323
State:
$47,881
Salary/wage: $29,973 (reported on 81.4% of returns)
Here:
$29,973
State:
$41,947
(% of AGI for various income ranges: 110.7% for AGIs below $10k, 76.6% for AGIs $10k-25k, 86.6% for AGIs $25k-50k, 81.4% for AGIs $50k-75k, 84.1% for AGIs $75k-100k, 59.7% for AGIs over 100k)
Taxable interest for individuals: $1,642 (reported on 30.6% of returns)
This zip code:
$1,642
Texas:
$2,255
(% of AGI for various income ranges: 6.8% for AGIs below $10k, 2.4% for AGIs $10k-25k, 1.5% for AGIs $25k-50k, 1.5% for AGIs $50k-75k, 0.4% for AGIs $75k-100k, 1.6% for AGIs over 100k)
Taxable dividends: $1,154 (reported on 12.7% of returns)
Here:
$1,154
State:
$4,261
(% of AGI for various income ranges: 2.9% for AGIs below $10k, 0.4% for AGIs $10k-25k, 0.5% for AGIs $25k-50k, 0.5% for AGIs $50k-75k, 0.3% for AGIs $75k-100k)
Net capital gain/loss: +$5,445 (reported on 13.2% of returns)
Here:
+$5,445
State:
+$16,110
(% of AGI for various income ranges: 2.7% for AGIs below $10k, 1.2% for AGIs $10k-25k, 1.1% for AGIs $25k-50k, 0.9% for AGIs $50k-75k, 12.7% for AGIs over 100k)
Profit/loss from business: +$4,562 (reported on 16.5% of returns)
Here:
+$4,562
State:
+$11,013
(% of AGI for various income ranges: 11.4% for AGIs below $10k, 5.8% for AGIs $10k-25k, 1.9% for AGIs $25k-50k, 1.2% for AGIs $50k-75k, 2.0% for AGIs $75k-100k)
Total itemized deductions: $15,404 (24% of AGI, reported on 11.3% of returns)
Here:
$15,404
State:
$19,631
Here:
24.1% of AGI
State:
18.9% of AGI
(% of AGI for various income ranges: 5.4% for AGIs $10k-25k, 4.6% for AGIs $25k-50k, 6.6% for AGIs $50k-75k, 6.7% for AGIs $75k-100k, 7.2% for AGIs over 100k)
Charity contributions deductions: $5,481 (8% of AGI, reported on 8.2% of returns)
Here:
$5,481
State:
$4,753
Here:
8.0% of AGI
State:
4.2% of AGI
(% of AGI for various income ranges: 0.9% for AGIs $10k-25k, 1.1% for AGIs $25k-50k, 1.3% for AGIs $50k-75k, 2.3% for AGIs $75k-100k, 3.0% for AGIs over 100k)
Total tax: $3,862 (reported on 64.2% of returns)
75681:
$3,862
State:
$9,058
(% of AGI for various income ranges: 4.1% for AGIs below $10k, 3.1% for AGIs $10k-25k, 5.7% for AGIs $25k-50k, 8.3% for AGIs $50k-75k, 11.6% for AGIs $75k-100k, 18.0% for AGIs over 100k)
Earned income credit: $1,842 (reported on 28.9% of returns)
Here:
$1,842
State:
$2,024
Percentage of individuals using paid preparers for their 2004 taxes: 64.5%
Here:
65%
State:
57%
(% for various income ranges: 55.7% for AGIs below $10k, 68.9% for AGIs $10k-25k, 63.2% for AGIs $25k-50k, 68.5% for AGIs $50k-75k, 66.7% for AGIs $75k-100k, 82.6% for AGIs over 100k)
Household received Food Stamps/SNAP in the past 12 months: 169 Household did not receive Food Stamps/SNAP in the past 12 months: 965
Women who had a birth in the past 12 months: 29 (30 now married, 0 unmarried) Women who did not have a birth in the past 12 months: 630 (185 now married, 447 unmarried)
Housing units in zip code 75681 with a mortgage: 312 Houses without a mortgage: 5
Median monthly owner costs for units with a mortgage: $1,357 Median monthly owner costs for units without a mortgage: $426
Residents with income below the poverty level in 2022:
This zip code:
16.1%
Whole state:
14.0%
Residents with income below 50% of the poverty level in 2022:
This zip code:
6.7%
Whole state:
7.4%
Median number of rooms in houses and condos:
Here:
5.6
State:
6.3
Median number of rooms in apartments:
Here:
5.1
State:
4.0
Notable locations in this zip code not listed on our city pages
Notable locations in zip code 75681: Longview Public Library (A), Mount Enterprise Volunteer Fire Department (B), Eastside Volunteer Fire Department (C). Display/hide their locations on the map
Churches in zip code 75681 include: Shiloh Church (A), Isabell Chapel (B), Lone Star Church (C), Maple Grove Church (D), Mount Zion Church (E), Old Prospect Church (F), Pine Grove Church (G). Display/hide their locations on the map
Cemeteries: Blanton Cemetery (1), Campground Cemetery (2), Edmonson Cemetery (3), Talley Cemetery (4), Miles Cemetery (5), King Cemetery (6), Ross Cemetery (7). Display/hide their locations on the map
Streams, rivers, and creeks: Bayou Loco (A), Welch Springs Branch (B), Wallace Branch (C), Wooten Creek (D), Vaughn Branch (E), Hays Creek (F), Clear Branch (G), Jarrell Creek (H), Jones Creek (I). Display/hide their locations on the map
Size of family households: 422 2-persons, 169 3-persons, 74 4-persons, 31 5-persons, 16 6-persons, 13 7-or-more-persons
Size of nonfamily households: 353 1-person, 60 2-persons
211 married couples with children.
93 single-parent households (93 women).
96.8% of residents of 75681 zip code speak English at home.
2.3% of residents speak Spanish at home (72% very well, 2% well, 27% not well).
0.9% of residents speak other Indo-European language at home (100% very well).
Foreign born population: 42 (1.6%) (83.6% of them are naturalized citizens)
This zip code:
1.6%
Whole state:
17.2%
42%France
40%Honduras
8%Sweden
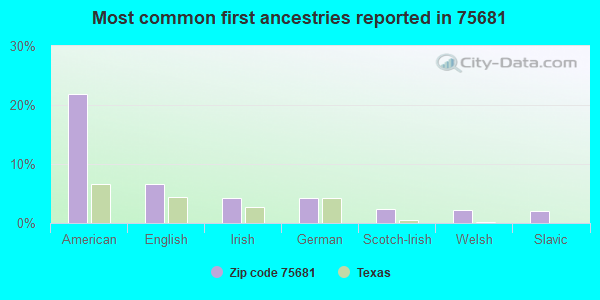
22%American
7%English
4%Irish
4%German
2%Scotch-Irish
2%Welsh
2%Slavic
Year of entry for the foreign-born population
02010 or later
22000 to 2009
171990 to 1999
29Before 1990
Housing units lacking complete plumbing facilities: 3.5% Housing units lacking complete kitchen facilities: 2.7%
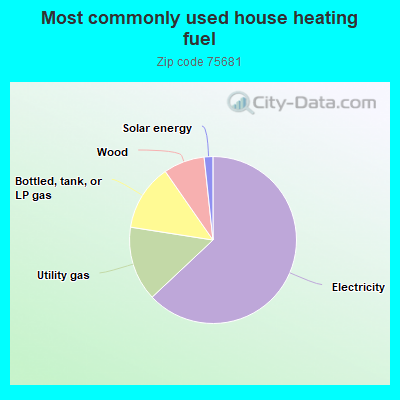
63.2%Electricity
14.5%Utility gas
12.9%Bottled, tank, or LP gas
8.0%Wood
1.7%Solar energy
Population in 1990: 2,558.
Place of birth for U.S.-born residents:
This state: 2,116
Northeast: 68
Midwest: 81
South: 161
West: 165
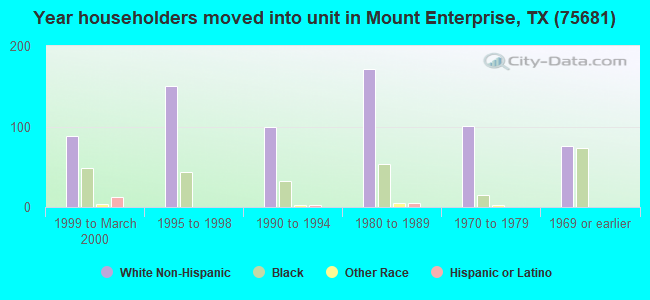
68% of the 75681 zip code residents lived in the same house 5 years ago. Out of people who lived in different houses, 51% lived in this county. Out of people who lived in different counties, 50% lived in Texas.
90% of the 75681 zip code residents lived in the same house 1 year ago. Out of people who lived in different houses, 47% moved from this county. Out of people who lived in different houses, 33% moved from different county within same state. Out of people who lived in different houses, 20% moved from different state. Out of people who lived in different houses, 1% moved from abroad.
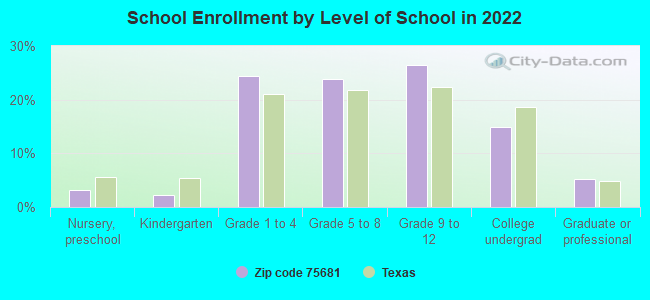
Private vs. public school enrollment:
Students in private schools in grades 1 to 8 (elementary and middle school): 36
Here:
13.7%
Texas:
8.8%
Students in private schools in grades 9 to 12 (high school):
Here:
0.0%
Texas:
8.0%
Students in private undergraduate colleges: 24
Here:
30.5%
Texas:
16.2%
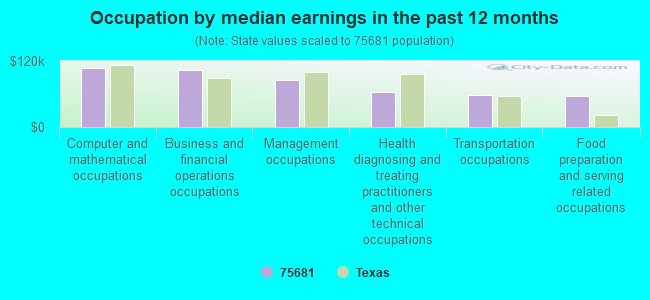
Occupation by median earnings in the past 12 months ($)
107,697Computer and mathematical occupations
103,327Business and financial operations occupations
85,493Management occupations
63,942Health diagnosing and treating practitioners and other technical occupations
57,575Transportation occupations
56,872Food preparation and serving related occupations
Top industries in this zip code by the number of employees in 2005:
Professional, Scientific, and Technical Services: Other Scientific and Technical Consulting Services (20-49 employees: 1 establishment, 1-4 employees: 1 establishment)
Mining: Support Activities for Oil and Gas Operations (20-49: 1)
Other Services (except Public Administration): Religious Organizations (5-9: 1, 1-4: 3)
Finance and Insurance: Commercial Banking (5-9: 1)
Health Care and Social Assistance: Homes for the Elderly (5-9: 1)
Administrative and Support and Waste Management and Remediation Services: Office Administrative Services (1-4: 2)
People in group quarters in 2010:
118 people in state prisons
Fatal accident statistics in 2014:
Fatal accident count: 2
Vehicles involved in fatal accidents: 2
Fatal accidents caused by drunken drivers: 0
Fatalities: 2
Persons involved in fatal accidents: 2
Pedestrians involved in fatal accidents: 0
Fatal accident statistics in 2013:
Fatal accident count: 2
Vehicles involved in fatal accidents: 4
Fatal accidents caused by drunken drivers: 0
Fatalities: 4
Persons involved in fatal accidents: 11
Pedestrians involved in fatal accidents: 0
Home Mortgage Disclosure Act Aggregated Statistics For Year 2009 (Based on 6 partial tracts)
A) FHA, FSA/RHS & VA Home Purchase Loans
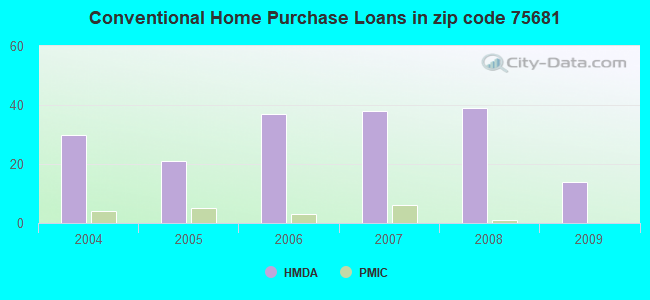
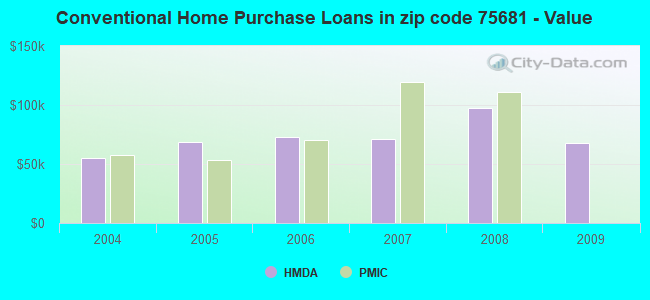
B) Conventional Home Purchase Loans
C) Refinancings
D) Home Improvement Loans
F) Non-occupant Loans on < 5 Family Dwellings (A B C & D)
G) Loans On Manufactured Home Dwelling (A B C & D)
Number
Average Value
Number
Average Value
Number
Average Value
Number
Average Value
Number
Average Value
Number
Average Value
LOANS ORIGINATED
6
$77,913
14
$67,421
24
$78,342
24
$23,662
7
$28,133
12
$33,312
APPLICATIONS APPROVED, NOT ACCEPTED
0
$0
4
$54,302
4
$75,355
1
$23,810
0
$0
3
$42,843
APPLICATIONS DENIED
3
$147,543
9
$107,106
4
$60,490
2
$15,550
0
$0
6
$53,543
APPLICATIONS WITHDRAWN
1
$77,980
2
$87,190
3
$238,527
0
$0
0
$0
1
$124,320
FILES CLOSED FOR INCOMPLETENESS
0
$0
0
$0
0
$0
0
$0
0
$0
0
$0
Aggregated Statistics For Year 2008 (Based on 6 partial tracts)
A) FHA, FSA/RHS & VA Home Purchase Loans
B) Conventional Home Purchase Loans
C) Refinancings
D) Home Improvement Loans
F) Non-occupant Loans on < 5 Family Dwellings (A B C & D)
G) Loans On Manufactured Home Dwelling (A B C & D)
Number
Average Value
Number
Average Value
Number
Average Value
Number
Average Value
Number
Average Value
Number
Average Value
LOANS ORIGINATED
6
$114,658
39
$97,035
17
$77,635
25
$21,250
7
$52,349
12
$39,690
APPLICATIONS APPROVED, NOT ACCEPTED
0
$0
10
$60,439
2
$35,230
0
$0
0
$0
6
$48,465
APPLICATIONS DENIED
0
$0
12
$92,450
14
$183,261
9
$28,274
4
$45,982
10
$51,328
APPLICATIONS WITHDRAWN
0
$0
2
$142,915
3
$60,383
0
$0
0
$0
0
$0
FILES CLOSED FOR INCOMPLETENESS
0
$0
0
$0
1
$892,840
0
$0
0
$0
0
$0
Aggregated Statistics For Year 2007 (Based on 6 partial tracts)
A) FHA, FSA/RHS & VA Home Purchase Loans
B) Conventional Home Purchase Loans
C) Refinancings
D) Home Improvement Loans
F) Non-occupant Loans on < 5 Family Dwellings (A B C & D)
G) Loans On Manufactured Home Dwelling (A B C & D)
Number
Average Value
Number
Average Value
Number
Average Value
Number
Average Value
Number
Average Value
Number
Average Value
LOANS ORIGINATED
2
$85,305
38
$71,194
18
$70,029
17
$25,235
15
$44,955
11
$46,253
APPLICATIONS APPROVED, NOT ACCEPTED
0
$0
7
$89,426
7
$51,580
1
$15,820
2
$104,545
6
$42,037
APPLICATIONS DENIED
0
$0
13
$95,937
27
$69,227
7
$30,170
5
$130,998
11
$57,697
APPLICATIONS WITHDRAWN
1
$124,820
3
$106,103
9
$75,843
1
$96,070
0
$0
1
$15,800
FILES CLOSED FOR INCOMPLETENESS
0
$0
1
$155,490
1
$68,290
0
$0
0
$0
0
$0
Aggregated Statistics For Year 2006 (Based on 6 partial tracts)
A) FHA, FSA/RHS & VA Home Purchase Loans
B) Conventional Home Purchase Loans
C) Refinancings
D) Home Improvement Loans
F) Non-occupant Loans on < 5 Family Dwellings (A B C & D)
G) Loans On Manufactured Home Dwelling (A B C & D)
Number
Average Value
Number
Average Value
Number
Average Value
Number
Average Value
Number
Average Value
Number
Average Value
LOANS ORIGINATED
1
$100,550
37
$72,971
20
$91,543
28
$24,724
7
$47,333
8
$61,828
APPLICATIONS APPROVED, NOT ACCEPTED
0
$0
12
$43,584
1
$44,680
3
$48,270
1
$28,250
10
$40,613
APPLICATIONS DENIED
0
$0
25
$63,388
21
$63,584
12
$38,273
4
$44,342
17
$49,356
APPLICATIONS WITHDRAWN
0
$0
6
$60,387
19
$80,416
1
$16,930
2
$49,030
0
$0
FILES CLOSED FOR INCOMPLETENESS
0
$0
0
$0
5
$105,322
0
$0
0
$0
0
$0
Aggregated Statistics For Year 2005 (Based on 6 partial tracts)
B) Conventional Home Purchase Loans
C) Refinancings
D) Home Improvement Loans
F) Non-occupant Loans on < 5 Family Dwellings (A B C & D)
G) Loans On Manufactured Home Dwelling (A B C & D)
Number
Average Value
Number
Average Value
Number
Average Value
Number
Average Value
Number
Average Value
LOANS ORIGINATED
21
$68,808
16
$66,686
23
$11,913
8
$67,226
7
$38,444
APPLICATIONS APPROVED, NOT ACCEPTED
15
$47,307
13
$60,918
2
$140,145
0
$0
13
$39,716
APPLICATIONS DENIED
28
$63,652
27
$89,084
14
$30,316
4
$20,542
24
$44,611
APPLICATIONS WITHDRAWN
6
$102,860
16
$99,461
6
$170,957
2
$195,090
1
$63,290
FILES CLOSED FOR INCOMPLETENESS
0
$0
3
$87,507
1
$47,470
1
$79,110
0
$0
Aggregated Statistics For Year 2004 (Based on 6 partial tracts)
A) FHA, FSA/RHS & VA Home Purchase Loans
B) Conventional Home Purchase Loans
C) Refinancings
D) Home Improvement Loans
F) Non-occupant Loans on < 5 Family Dwellings (A B C & D)
G) Loans On Manufactured Home Dwelling (A B C & D)
2003 - 2018 National Fire Incident Reporting System (NFIRS) incidents
Based on the data from the years 2003 - 2018 the average number of fires per year is 41. The highest number of fires - 157 took place in 2011, and the least - 3 in 2003. The data has an increasing trend.
When looking into fire subcategories, the most reports belonged to: Outside Fires (66.4%), and Structure Fires (14.0%).
Fire incident types reported to NFIRS in Zip Code 75681
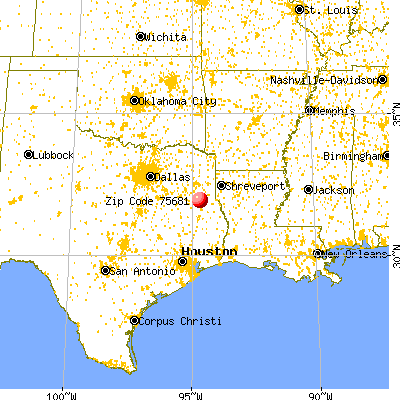


 Nearest zip codes: 75667, 75669, 75654, 75760, 75946, 75965.


 Based on the data from the years 2003 - 2018 the average number of fires per year is 41. The highest number of fires - 157 took place in 2011, and the least - 3 in 2003. The data has an increasing trend.
 When looking into fire subcategories, the most reports belonged to: Outside Fires (66.4%), and Structure Fires (14.0%).