Estimated zip code population in 2022: 35,758 Zip code population in 2010: 34,373 Zip code population in 2000: 31,105
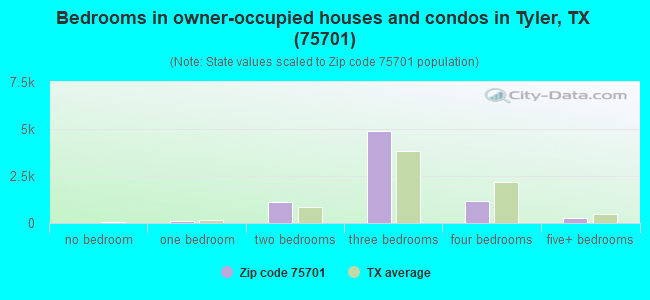
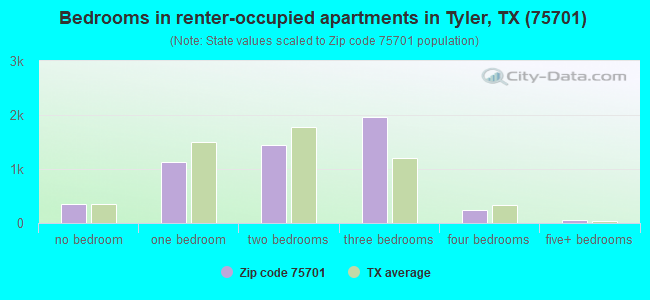
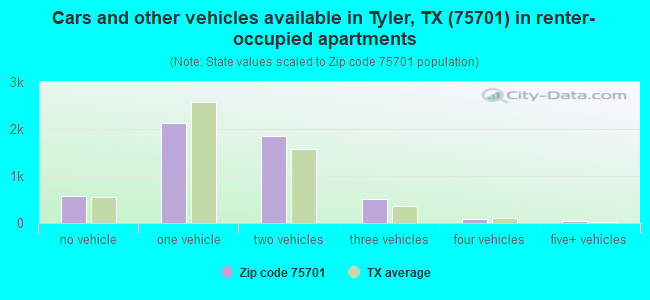
Houses and condos: 14,887 Renter-occupied apartments: 5,208
% of renters here:
41%
State:
38%
March 2022 cost of living index in zip code 75701: 85.3 (less than average, U.S. average is 100)
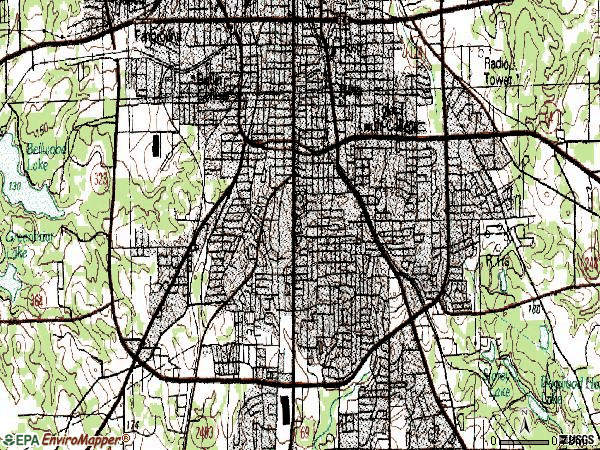
Land area: 15.7 sq. mi. Water area: 0.0 sq. mi.
Population density: 2,275 people per square mile
(low).
OSM Map
General Map
Google Map
MSN Map
OSM Map
General Map
Google Map
MSN Map
OSM Map
General Map
Google Map
MSN Map
OSM Map
General Map
Google Map
MSN Map
Please wait while loading the map...
Real estate property taxes paid for housing units in 2022:
This zip code:
1.1% ($2,310)
Texas:
1.5% ($4,050)
Median real estate property taxes paid for housing units with mortgages in 2022: $2,560 (1.2%) Median real estate property taxes paid for housing units with no mortgage in 2022: $1,868 (0.9%)
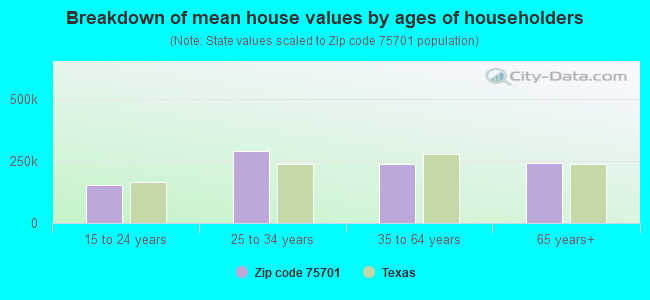
Estimated median house/condo value in 2022: $207,013
75701:
$207,013
Texas:
$275,400
According to our research of Texas and other state lists, there were 74 registered sex offenders living in 75701 zip code as of April 26, 2024. The ratio of all residents to sex offenders in zip code 75701 is 481 to 1. The ratio of registered sex offenders to all residents in this zip code is near the state average.
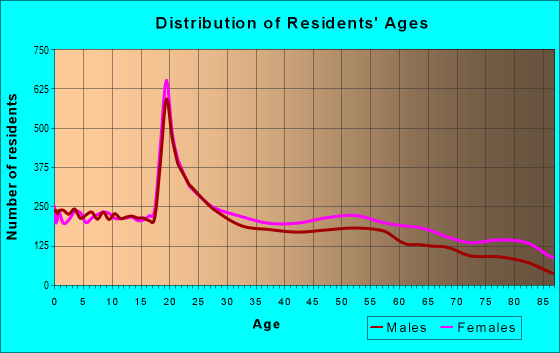
Median resident age:
This zip code:
35.0 years
Texas median age:
35.6 years
Average household size:
This zip code:
2.6 people
Texas:
2.6 people
Averages for the 2020 tax year for zip code 75701, filed in 2021:
Average Adjusted Gross Income (AGI) in 2020: $56,618 (Individual Income Tax Returns)
Here:
$56,618
State:
$77,054
Salary/wage: $45,931 (reported on 83.0% of returns)
Here:
$45,931
State:
$62,766
(% of AGI for various income ranges: 1255.1% for AGIs below $25k, 3628.1% for AGIs $25k-50k, 6456.4% for AGIs $50k-75k, 9717.0% for AGIs $75k-100k, 16759.7% for AGIs $100k-200k, 86536.9% for AGIs over 200k)
Taxable interest for individuals: $1,997 (reported on 21.4% of returns)
This zip code:
$1,997
Texas:
$2,665
(% of AGI for various income ranges: 11.0% for AGIs below $25k, 14.9% for AGIs $25k-50k, 42.4% for AGIs $50k-75k, 90.0% for AGIs $75k-100k, 217.3% for AGIs $100k-200k, 2047.7% for AGIs over 200k)
Ordinary dividends: $16,876 (reported on 13.8% of returns)
Here:
$16,876
State:
$10,044
(% of AGI for various income ranges: 19.3% for AGIs below $25k, 30.1% for AGIs $25k-50k, 118.1% for AGIs $50k-75k, 246.5% for AGIs $75k-100k, 823.8% for AGIs $100k-200k, 18572.3% for AGIs over 200k)
Net capital gain/loss in AGI: +$21,296 (reported on 13.2% of returns)
Here:
+$21,296
State:
+$39,590
(% of AGI for various income ranges: 8.8% for AGIs below $25k, 15.6% for AGIs $25k-50k, 99.5% for AGIs $50k-75k, 199.6% for AGIs $75k-100k, 768.9% for AGIs $100k-200k, 25979.2% for AGIs over 200k)
Profit/loss from business: +$10,977 (reported on 18.9% of returns)
Here:
+$10,977
State:
+$10,888
(% of AGI for various income ranges: 92.3% for AGIs below $25k, 151.4% for AGIs $25k-50k, 208.9% for AGIs $50k-75k, 328.1% for AGIs $75k-100k, 1239.5% for AGIs $100k-200k, 5950.0% for AGIs over 200k)
Taxable individual retirement arrangement distribution: $17,734 (reported on 7.3% of returns)
75701:
$17,734
Texas:
$24,740
(% of AGI for various income ranges: 27.6% for AGIs below $25k, 83.9% for AGIs $25k-50k, 172.0% for AGIs $50k-75k, 387.7% for AGIs $75k-100k, 888.2% for AGIs $100k-200k, 2990.0% for AGIs over 200k)
Self-employed (Keogh) retirement plans: $21,350 (reported on 0.3% of returns)
75701:
$21,350
Texas:
$29,298
(% of AGI for various income ranges: 8.0% for AGIs $25k-50k, 444.6% for AGIs over 200k)
Total itemized deductions: $40,134 (reported on 5.4% of returns)
Here:
$40,134
State:
$40,428
(% of AGI for various income ranges: 35.0% for AGIs below $25k, 97.2% for AGIs $25k-50k, 270.6% for AGIs $50k-75k, 338.8% for AGIs $75k-100k, 1117.9% for AGIs $100k-200k, 10528.5% for AGIs over 200k)
Charity contributions: $19,823 (reported on 4.5% of returns)
Here:
$19,823
State:
$18,201
(% of AGI for various income ranges: 3.3% for AGIs below $25k, 18.0% for AGIs $25k-50k, 59.9% for AGIs $50k-75k, 113.0% for AGIs $75k-100k, 414.9% for AGIs $100k-200k, 6292.3% for AGIs over 200k)
Taxes paid: $6,492 (reported on 5.1% of returns)
75701:
$6,492
State:
$7,821
(% of AGI for various income ranges: 4.7% for AGIs below $25k, 13.3% for AGIs $25k-50k, 36.3% for AGIs $50k-75k, 60.0% for AGIs $75k-100k, 177.8% for AGIs $100k-200k, 1679.2% for AGIs over 200k)
Earned income credit: $2,501 (reported on 21.7% of returns)
Here:
$2,501
State:
$2,584
(% of AGI for various income ranges: 117.5% for AGIs below $25k, 78.4% for AGIs $25k-50k, 1.6% for AGIs $50k-75k)
Percentage of individuals using paid preparers for their 2020 taxes: 93.8%
Here:
94%
State:
92%
(% for various income ranges: 93.4% for AGIs below $25k, 94.4% for AGIs $25k-50k, 93.8% for AGIs $50k-75k, 94.3% for AGIs $75k-100k, 92.6% for AGIs $100k-200k, 95.6% for AGIs over 200k)
Averages for the 2012 tax year for zip code 75701, filed in 2013:
Average Adjusted Gross Income (AGI) in 2012: $56,733 (Individual Income Tax Returns)
Here:
$56,733
State:
$65,384
Salary/wage: $42,214 (reported on 82.8% of returns)
Here:
$42,214
State:
$52,524
(% of AGI for various income ranges: 78.4% for AGIs below $25k, 79.2% for AGIs $25k-50k, 74.4% for AGIs $50k-75k, 71.5% for AGIs $75k-100k, 66.6% for AGIs $100k-200k, 38.7% for AGIs over 200k)
Taxable interest for individuals: $2,709 (reported on 25.5% of returns)
This zip code:
$2,709
Texas:
$2,372
(% of AGI for various income ranges: 1.0% for AGIs below $25k, 0.7% for AGIs $25k-50k, 0.8% for AGIs $50k-75k, 0.6% for AGIs $75k-100k, 1.2% for AGIs $100k-200k, 1.8% for AGIs over 200k)
Ordinary dividends: $14,616 (reported on 16.4% of returns)
Here:
$14,616
State:
$9,721
(% of AGI for various income ranges: 2.8% for AGIs below $25k, 1.7% for AGIs $25k-50k, 1.9% for AGIs $50k-75k, 2.3% for AGIs $75k-100k, 3.1% for AGIs $100k-200k, 7.7% for AGIs over 200k)
Net capital gain/loss in AGI: +$28,581 (reported on 13.4% of returns)
Here:
+$28,581
State:
+$35,319
(% of AGI for various income ranges: 0.8% for AGIs $50k-75k, 1.1% for AGIs $75k-100k, 2.7% for AGIs $100k-200k, 17.5% for AGIs over 200k)
Profit/loss from business: +$16,155 (reported on 17.5% of returns)
Here:
+$16,155
State:
+$13,732
(% of AGI for various income ranges: 7.0% for AGIs below $25k, 3.7% for AGIs $25k-50k, 3.6% for AGIs $50k-75k, 4.7% for AGIs $75k-100k, 7.0% for AGIs $100k-200k, 4.7% for AGIs over 200k)
Taxable individual retirement arrangement distribution: $17,934 (reported on 9.5% of returns)
75701:
$17,934
Texas:
$19,511
(% of AGI for various income ranges: 2.2% for AGIs below $25k, 2.0% for AGIs $25k-50k, 2.9% for AGIs $50k-75k, 3.2% for AGIs $75k-100k, 4.2% for AGIs $100k-200k, 3.2% for AGIs over 200k)
Self-employment retirement plans: $22,371 (reported on 0.5% of returns)
75701:
$22,371
Texas:
$23,938
Total itemized deductions: $26,251 (17% of AGI, reported on 20.8% of returns)
Here:
$26,251
State:
$24,724
Here:
17.2% of AGI
State:
15.9% of AGI
(% of AGI for various income ranges: 5.6% for AGIs below $25k, 7.4% for AGIs $25k-50k, 10.1% for AGIs $50k-75k, 10.3% for AGIs $75k-100k, 11.1% for AGIs $100k-200k, 10.8% for AGIs over 200k)
Charity contributions: $12,148 (reported on 17.1% of returns)
Here:
$12,148
State:
$6,808
(% of AGI for various income ranges: 0.7% for AGIs below $25k, 1.3% for AGIs $25k-50k, 2.0% for AGIs $50k-75k, 3.1% for AGIs $75k-100k, 3.5% for AGIs $100k-200k, 6.5% for AGIs over 200k)
Taxes paid: $5,244 (reported on 20.2% of returns)
75701:
$5,244
State:
$6,921
(% of AGI for various income ranges: 0.9% for AGIs below $25k, 1.3% for AGIs $25k-50k, 1.8% for AGIs $50k-75k, 2.1% for AGIs $75k-100k, 2.8% for AGIs $100k-200k, 1.9% for AGIs over 200k)
Earned income credit: $2,461 (reported on 23.5% of returns)
Here:
$2,461
State:
$2,570
(% of AGI for various income ranges: 7.9% for AGIs below $25k, 1.2% for AGIs $25k-50k)
Percentage of individuals using paid preparers for their 2012 taxes: 54.1%
Here:
54%
State:
51%
(% for various income ranges: 52.5% for AGIs below $25k, 51.0% for AGIs $25k-50k, 54.6% for AGIs $50k-75k, 51.6% for AGIs $75k-100k, 61.9% for AGIs $100k-200k, 87.0% for AGIs over 200k)
Averages for the 2004 tax year for zip code 75701, filed in 2005:
Average Adjusted Gross Income (AGI) in 2004: $48,347 (Individual Income Tax Returns)
Here:
$48,347
State:
$47,881
Salary/wage: $38,253 (reported on 80.3% of returns)
Here:
$38,253
State:
$41,947
(% of AGI for various income ranges: 192.7% for AGIs below $10k, 77.1% for AGIs $10k-25k, 76.8% for AGIs $25k-50k, 70.8% for AGIs $50k-75k, 68.0% for AGIs $75k-100k, 49.0% for AGIs over 100k)
Taxable interest for individuals: $3,555 (reported on 38.3% of returns)
This zip code:
$3,555
Texas:
$2,255
(% of AGI for various income ranges: 17.3% for AGIs below $10k, 2.7% for AGIs $10k-25k, 2.0% for AGIs $25k-50k, 2.4% for AGIs $50k-75k, 2.2% for AGIs $75k-100k, 3.1% for AGIs over 100k)
Taxable dividends: $6,278 (reported on 22.7% of returns)
Here:
$6,278
State:
$4,261
(% of AGI for various income ranges: 8.1% for AGIs below $10k, 1.7% for AGIs $10k-25k, 1.6% for AGIs $25k-50k, 1.7% for AGIs $50k-75k, 2.7% for AGIs $75k-100k, 4.1% for AGIs over 100k)
Net capital gain/loss: +$24,243 (reported on 19.6% of returns)
Here:
+$24,243
State:
+$16,110
(% of AGI for various income ranges: -3.5% for AGIs below $10k, 0.3% for AGIs $10k-25k, 0.5% for AGIs $25k-50k, 1.0% for AGIs $50k-75k, 1.9% for AGIs $75k-100k, 20.7% for AGIs over 100k)
Profit/loss from business: +$15,030 (reported on 18.3% of returns)
Here:
+$15,030
State:
+$11,013
(% of AGI for various income ranges: 5.5% for AGIs below $10k, 5.0% for AGIs $10k-25k, 3.6% for AGIs $25k-50k, 4.1% for AGIs $50k-75k, 5.5% for AGIs $75k-100k, 7.3% for AGIs over 100k)
IRA payment deduction: $3,110 (reported on 1.9% of returns)
75701:
$3,110
Texas:
$3,120
(% of AGI for various income ranges: 0.1% for AGIs $10k-25k, 0.2% for AGIs $25k-50k, 0.2% for AGIs $50k-75k, 0.1% for AGIs $75k-100k, 0.1% for AGIs over 100k)
Self-employed pension: $16,458 (reported on 0.8% of returns)
Here:
$16,458
Texas:
$16,401
Total itemized deductions: $19,773 (18% of AGI, reported on 24.3% of returns)
Here:
$19,773
State:
$19,631
Here:
18.2% of AGI
State:
18.9% of AGI
(% of AGI for various income ranges: 30.7% for AGIs below $10k, 7.3% for AGIs $10k-25k, 8.9% for AGIs $25k-50k, 10.8% for AGIs $50k-75k, 11.3% for AGIs $75k-100k, 9.9% for AGIs over 100k)
Charity contributions deductions: $9,161 (8% of AGI, reported on 21.1% of returns)
Here:
$9,161
State:
$4,753
Here:
7.6% of AGI
State:
4.2% of AGI
(% of AGI for various income ranges: 1.9% for AGIs below $10k, 1.2% for AGIs $10k-25k, 1.9% for AGIs $25k-50k, 2.9% for AGIs $50k-75k, 3.2% for AGIs $75k-100k, 6.0% for AGIs over 100k)
Total tax: $10,459 (reported on 69.4% of returns)
75701:
$10,459
State:
$9,058
(% of AGI for various income ranges: 5.9% for AGIs below $10k, 3.5% for AGIs $10k-25k, 6.8% for AGIs $25k-50k, 9.7% for AGIs $50k-75k, 11.5% for AGIs $75k-100k, 23.6% for AGIs over 100k)
Earned income credit: $1,917 (reported on 21.6% of returns)
Here:
$1,917
State:
$2,024
Percentage of individuals using paid preparers for their 2004 taxes: 60.5%
Here:
60%
State:
57%
(% for various income ranges: 55.4% for AGIs below $10k, 64.1% for AGIs $10k-25k, 57.5% for AGIs $25k-50k, 58.7% for AGIs $50k-75k, 60.3% for AGIs $75k-100k, 74.2% for AGIs over 100k)
Likely homosexual households (counted as self-reported same-sex unmarried-partner households)
Lesbian couples: 0.1% of all households
Gay men: 0.2% of all households
Household received Food Stamps/SNAP in the past 12 months: 1,094 Household did not receive Food Stamps/SNAP in the past 12 months: 11,674
Women who had a birth in the past 12 months: 499 (392 now married, 110 unmarried) Women who did not have a birth in the past 12 months: 8,168 (3,026 now married, 5,160 unmarried)
Housing units in zip code 75701 with a mortgage: 4,343 (98 second mortgage, 96 both second mortgage and home equity loan) Houses without a mortgage: 113
Median monthly owner costs for units with a mortgage: $1,452 Median monthly owner costs for units without a mortgage: $570
Residents with income below the poverty level in 2022:
This zip code:
16.2%
Whole state:
14.0%
Residents with income below 50% of the poverty level in 2022:
This zip code:
6.6%
Whole state:
7.4%
Median number of rooms in houses and condos:
Here:
6.0
State:
6.3
Median number of rooms in apartments:
Here:
4.4
State:
4.0
Notable locations in this zip code not listed on our city pages
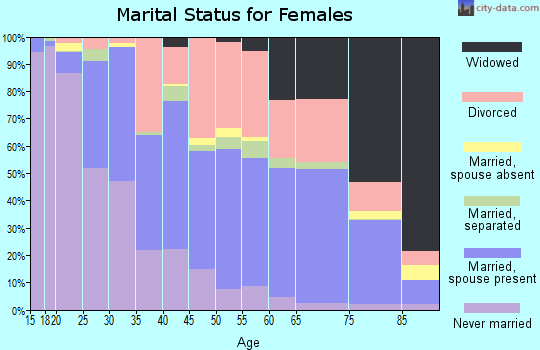
4,949 married couples with children.
1,094 single-parent households (151 men, 943 women).
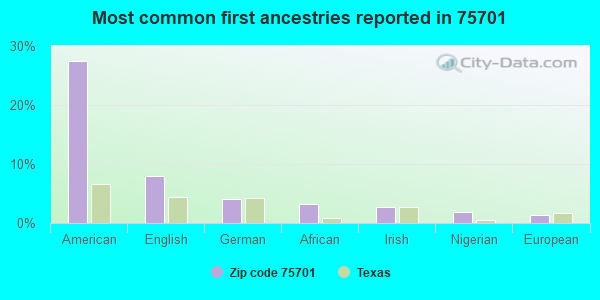
85.4% of residents of 75701 zip code speak English at home.
12.3% of residents speak Spanish at home (47% very well, 21% well, 27% not well, 5% not at all).
1.4% of residents speak other Indo-European language at home (79% very well, 19% well, 2% not well).
0.5% of residents speak Asian or Pacific Island language at home (40% very well, 58% well, 1% not well).
0.2% of residents speak other language at home (100% very well).
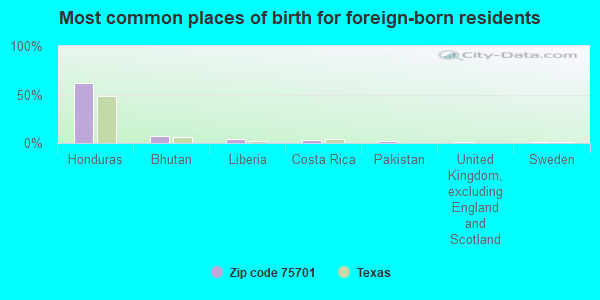
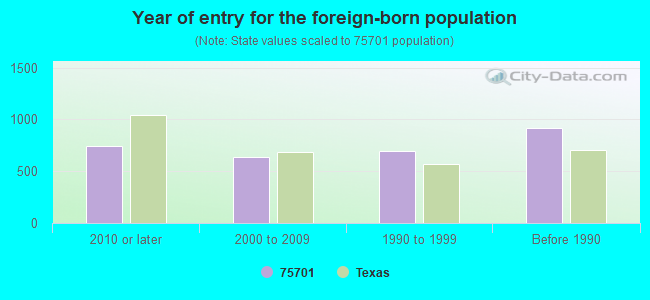
Foreign born population: 2,820 (7.9%) (42.2% of them are naturalized citizens)
Facilities with environmental interests located in this zip code:
AAMCO TRANSMISSIONS (2110 W SOUTHWEST LOOP 323 in TYLER, TX)
(Resource Conservation and Recovery Act (tracking hazardous waste)) Business NAICS classification: AUTOMOTIVE TRANSMISSION REPAIR. Organizations: AAMCO TRANSMISSIONS INC (CONTACT/OWNER)
ABB VETCO GRAY INC (2116 ANTHONY DR in TYLER, TX)
(Resource Conservation and Recovery Act (tracking hazardous waste)) Alternative names: ABB VETCO GRAY INC TYLER TEXAS
AMERICAN TELEPHONE AND TELEGRAPH COMPANY (2517 OLD GLADEWATER HW in TYLER, TX)
(Resource Conservation and Recovery Act (tracking hazardous waste)) Alternative names: AMERICAN TEL & TEL CO LONG LINES
Housing units lacking complete plumbing facilities: 6.5% Housing units lacking complete kitchen facilities: 4.3%
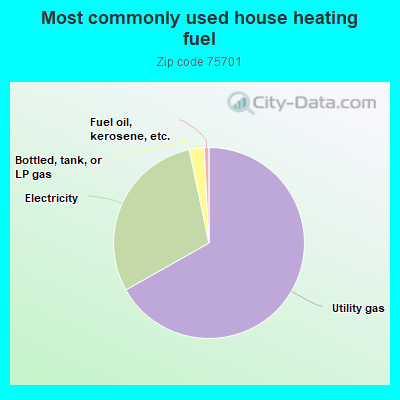
66.7%Utility gas
29.8%Electricity
2.5%Bottled, tank, or LP gas
0.8%Fuel oil, kerosene, etc.
Population in 1990: 30,794. Population change in the 1990s: +311 (+1.0%).
Place of birth for U.S.-born residents:
This state: 24,073
Northeast: 1,066
Midwest: 1,948
South: 3,457
West: 2,030
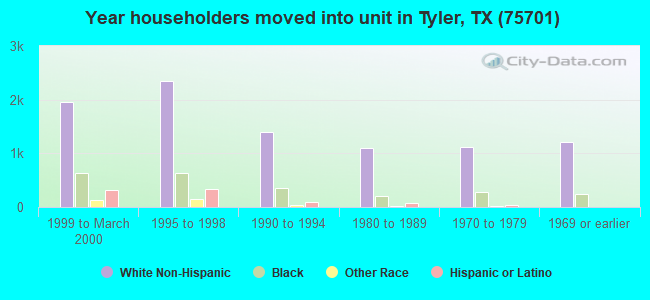
51% of the 75701 zip code residents lived in the same house 5 years ago. Out of people who lived in different houses, 61% lived in this county. Out of people who lived in different counties, 50% lived in Texas.
91% of the 75701 zip code residents lived in the same house 1 year ago. Out of people who lived in different houses, 49% moved from this county. Out of people who lived in different houses, 34% moved from different county within same state. Out of people who lived in different houses, 11% moved from different state. Out of people who lived in different houses, 8% moved from abroad.
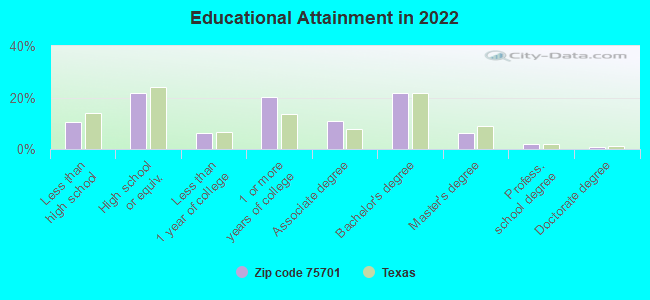
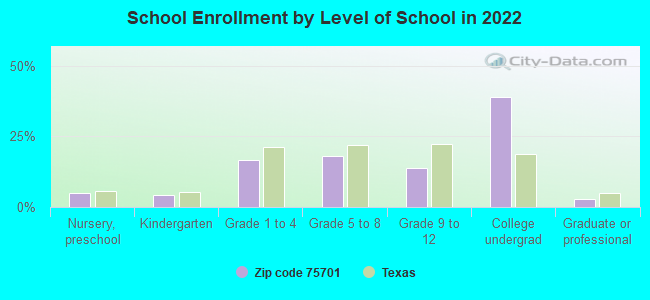
Private vs. public school enrollment:
Students in private schools in grades 1 to 8 (elementary and middle school): 551
Here:
16.7%
Texas:
8.8%
Students in private schools in grades 9 to 12 (high school): 221
Here:
16.9%
Texas:
8.0%
Students in private undergraduate colleges: 285
Here:
7.9%
Texas:
16.2%
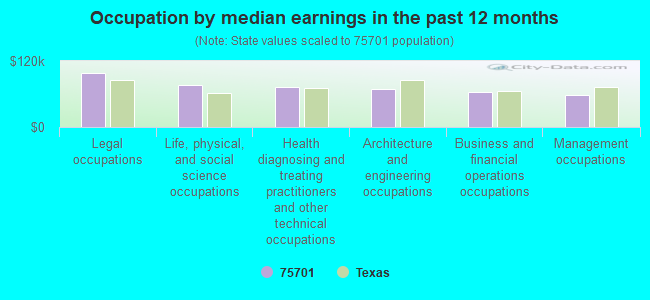
Occupation by median earnings in the past 12 months ($)
98,375Legal occupations
76,772Life, physical, and social science occupations
72,626Health diagnosing and treating practitioners and other technical occupations
69,422Architecture and engineering occupations
64,267Business and financial operations occupations
58,158Management occupations
Companies with federal contracts located in this zip code (TYLER, TX):
COX SOUTHWEST HOLDINGS, L P (3015 SOUTH SOUTEAST LOOP 3) : $283,606 in 6 contractsfrom 1999 to 2003
Contracts for Other Utilities, Telephone and/or Communications Services (includes Telegraph, Telex, and Cablevision Services), Installation of Equipment -- Communication, Detection, and Coherent Radiation Equipment by Air Force Signed by year:2000: $33,133; 2001: $44,409; 2002: $41,807; 2003: $41,996; 2004: $0; 2005: $0; 2006: $0.
Biggest contracts:
$87,124 with Air Force for Other Utilities. Signed on 1999-10-01. Completion date: 2000-09-30.
$44,409 with Air Force for Telephone and/or Communications Services (includes Telegraph, Telex, and Cablevision Services). Signed on 2001-10-01. Completion date: 2002-09-30.
$41,996 with Air Force for Telephone and/or Communications Services (includes Telegraph, Telex, and Cablevision Services). Taking place in LA. Signed on 2003-10-01. Completion date: 2004-09-30.
$41,807, same as above.Signed on 2002-10-01. Completion date: 2003-09-30.
BROOKSHIRE GROCERY COMPANY INC (1600 SW LOOP 323) 10000 employees, $1084800000 revenue: $143,000 in 8 contractsfrom 1999 to 2001
Contracts for Drugs and Biologicals by Department of Veterans Affairs Signed by year:2000: $78,000; 2001: $25,000; 2002: $0; 2003: $0; 2004: $0; 2005: $0; 2006: $0.
Biggest contracts:
$47,000 with Department of Veterans Affairs for Drugs and Biologicals. Signed on 2000-01-15. Completion date: 2003-09-15.
$40,000, same as above.Signed on 1999-10-15. Completion date: 2003-09-15.
$13,000, same as above.Signed on 2001-01-15. Completion date: 2003-09-15.
$11,000, same as above.Signed on 2000-04-15. Completion date: 2003-09-15.
$63,704 with Army for In Vitro Diagnostic Substances, Reagents, Test Kits, and Sets. Signed on 2006-01-04. Completion date: 2006-09-30.
LANGHAM, ROBERT (722 1/2 S BOIS D ARC AVE; small business) : $36,470 in 9 contractsfrom 2004 to 2005
Contracts for Reserve Training (Military) by Army Signed by year:2000: $0; 2001: $0; 2002: $0; 2003: $0; 2004: $43,170; 2005: -$6,700; 2006: $0.
Biggest contracts:
$18,300 with Army for Reserve Training (Military). Signed on 2004-10-01. Completion date: 2004-09-30.
$9,000, same as above.Signed on 2004-09-01. Completion date: 2004-09-30.
$6,600, same as above.Signed on 2004-08-09. Completion date: 2004-08-31.
$3,600, same as above.Signed on 2004-12-13. Completion date: 2004-09-30.
DAVIDSON, KEN (3815 TIMMS ST STE 107; small business)
$29,380 with Army for Batteries, Rechargeable. Signed on 2003-01-21. Completion date: 2003-02-24.
LA QUINTA INNS INC (1601 W SOUTHWEST LOOP 323; small business)
$4,535 with Army for Lodging - Hotel/Motel. Signed on 2002-07-26. Completion date: 2002-08-01.
W D NORTON INC (2000 ANTHONY DR; small business)
$3,900 with Army for Fencing, Fences, Gates and Components. Signed on 2005-07-07. Completion date: 2005-07-22.
LONE STAR BUS LINES, INC (2828 TEAGUE; small business)
$2,776 with Army for Motor Passenger Services. Signed on 2005-06-10. Completion date: 2005-06-14.
Top industries in this zip code by the number of employees in 2005:
Health Care and Social Assistance: General Medical and Surgical Hospitals (over 1000 employees: 2 establishments, 1-4 employees: 1 establishment)
Health Care and Social Assistance: Offices of Physicians (except Mental Health Specialists) (100-249: 4, 50-99: 5, 20-49: 12, 10-19: 15, 5-9: 37, 1-4: 75)
Administrative and Support and Waste Management and Remediation Services: Temporary Help Services (500-999: 1, 250-499: 1, 100-249: 1, 50-99: 3, 20-49: 3, 10-19: 4, 5-9: 1, 1-4: 4)
2002 - 2018 National Fire Incident Reporting System (NFIRS) incidents
Based on the data from the years 2002 - 2018 the average number of fires per year is 99. The highest number of fire incidents - 140 took place in 2005, and the least - 68 in 2015. The data has a dropping trend.
When looking into fire subcategories, the most reports belonged to: Structure Fires (46.2%), and Outside Fires (29.7%).
Fire incident types reported to NFIRS in Zip Code 75701


 Nearest zip codes: 75702, 75703, 75709, 75707, 75791, 75708.
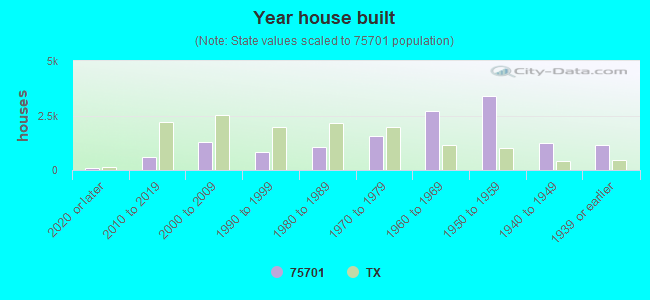


 Based on the data from the years 2002 - 2018 the average number of fires per year is 99. The highest number of fire incidents - 140 took place in 2005, and the least - 68 in 2015. The data has a dropping trend.
 When looking into fire subcategories, the most reports belonged to: Structure Fires (46.2%), and Outside Fires (29.7%).