Estimated zip code population in 2022: 216
Zip code population in 2010: 196
Zip code population in 2000: 184
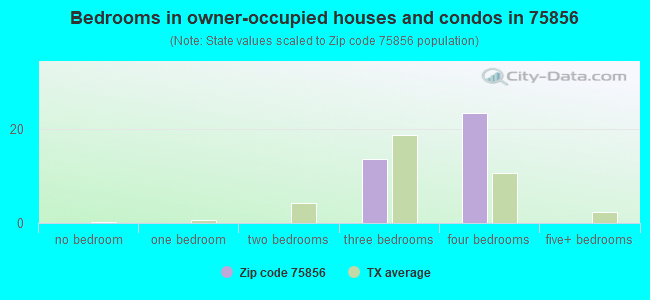
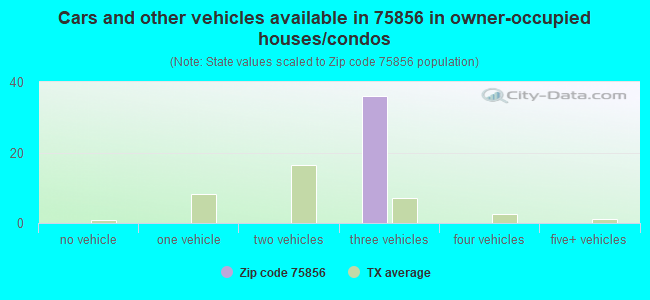
Houses and condos: 153
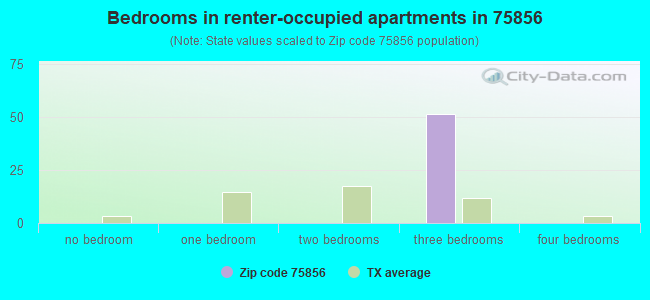
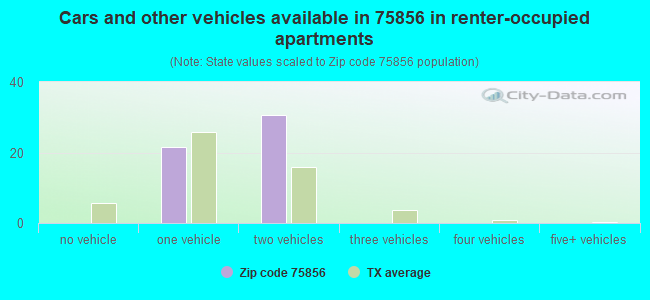
Renter-occupied apartments: 52
| % of renters here: | 59% |
| State: | 38% |
78.7
(low, U.S. average is 100)
Land area: 25.5
sq. mi.
Water area: 0.0
sq. mi.
| Population density: 8 people per square mile | | (very low). |
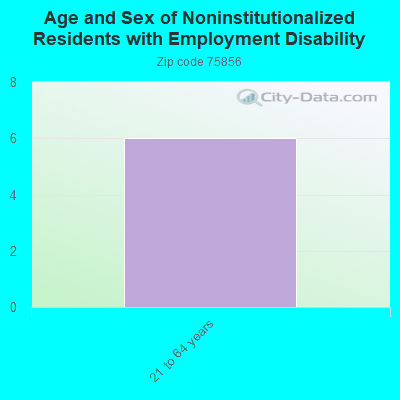
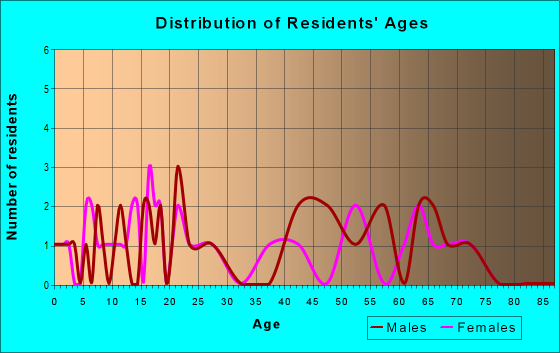
![Age and Sex of Residents in zip code 75856]()
- OSM Map
- General Map
- Google Map
- MSN Map
- OSM Map
- General Map
- Google Map
- MSN Map
- OSM Map
- General Map
- Google Map
- MSN Map
- OSM Map
- General Map
- Google Map
- MSN Map
Please wait while loading the map...
Business Search - 14 Million verified businesses
| Males: 127 |  (58.8%) (58.8%) |
| Females: 89 |  (41.2%) (41.2%) |
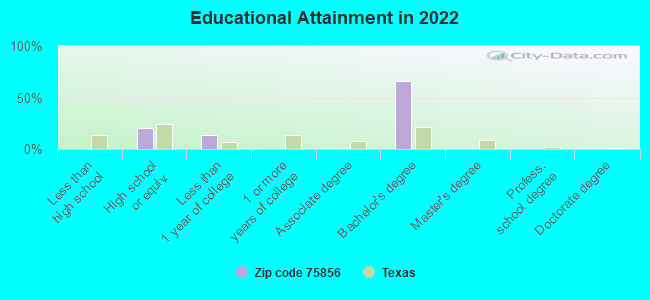
For population 25 years and over in 75856:
- High school or higher: 103.2%
- Bachelor's degree or higher: 67.9%
- Graduate or professional degree: 0.0%
- Mean travel time to work (commute): 18.3 minutes
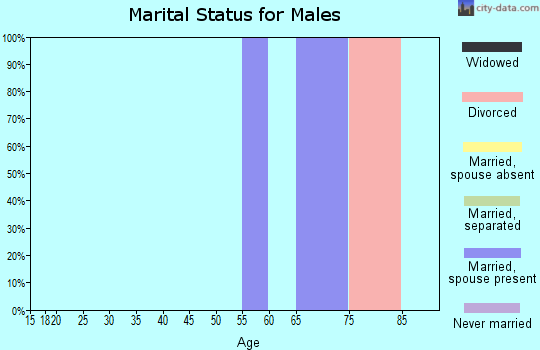
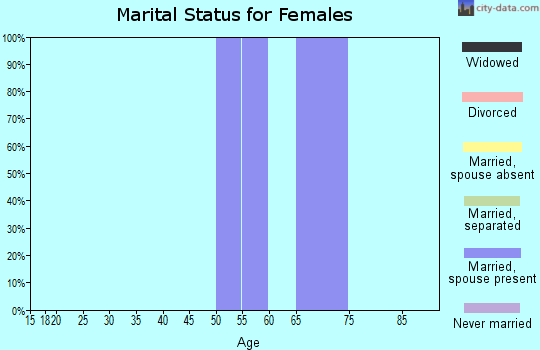
For population 15 years and over in 75856:
- Never married: 17.6%
- Now married: 72.1%
- Separated: 0.0%
- Widowed: 0.0%
- Divorced: 10.4%
Zip code 75856 compared to state average:
- Median household income above state average.
- Median house value significantly below state average.
- Unemployed percentage significantly below state average.
- Black race population percentage significantly below state average.
- Hispanic race population percentage significantly below state average.
- Median age significantly below state average.
- Foreign-born population percentage significantly below state average.
- Renting percentage above state average.
- Length of stay since moving in significantly above state average.
Data:
100%
rural population.
Median resident age:| This zip code: | 22.9 years |
| Texas median age: | 35.6 years |
Average household size:| This zip code: | 2.4 people |
| Texas: | 2.6 people |
Averages for the 2020 tax year for zip code 75856, filed in 2021:
Average Adjusted Gross Income (AGI) in 2020: $48,577 (Individual Income Tax Returns)
| Here: | $48,577 |
| State: | $77,054 |
Salary/wage: $49,678 (reported on 69.2% of returns)
| Here: | $49,678 |
| State: | $62,766 |
(% of AGI for various income ranges: 1053.3% for AGIs below $25k, 4367.5% for AGIs $25k-50k, 12040.0% for AGIs $75k-100k)
Taxable interest for individuals: $225 (reported on 30.8% of returns)
| This zip code: | $225 |
| Texas: | $2,665 |
(% of AGI for various income ranges: 22.5% for AGIs $25k-50k)
Ordinary dividends: $2,200 (reported on 15.4% of returns)
(% of AGI for various income ranges: 146.7% for AGIs below $25k)
Profit/loss from business: +$3,950 (reported on 15.4% of returns)
| Here: | +$3,950 |
| State: | +$10,888 |
(% of AGI for various income ranges: 263.3% for AGIs below $25k)
Percentage of individuals using paid preparers for their 2020 taxes: 100.0%
(% for various income ranges: 100.0% for AGIs below $25k, 100.0% for AGIs $25k-50k, 100.0% for AGIs $75k-100k)
Averages for the 2012 tax year for zip code 75856, filed in 2013:
Average Adjusted Gross Income (AGI) in 2012: $40,950 (Individual Income Tax Returns)
| Here: | $40,950 |
| State: | $65,384 |
Salary/wage: $46,088 (reported on 66.7% of returns)
| Here: | $46,088 |
| State: | $52,524 |
(% of AGI for various income ranges: 144.9% for AGIs below $25k, 204.9% for AGIs $50k-75k)
Taxable interest for individuals: $300 (reported on 25.0% of returns)
| This zip code: | $300 |
| Texas: | $2,372 |
Ordinary dividends: $2,500 (reported on 16.7% of returns)
Profit/loss from business: +$6,650 (reported on 16.7% of returns)
| Here: | +$6,650 |
| State: | +$13,732 |
(% of AGI for various income ranges: 23.3% for AGIs below $25k)
Earned income credit: $1,800 (reported on 16.7% of returns)
(% of AGI for various income ranges: 6.3% for AGIs below $25k)
Percentage of individuals using paid preparers for their 2012 taxes: 66.7%
(% for various income ranges: 100.0% for AGIs below $25k, 150.0% for AGIs $50k-75k)
Averages for the 2004 tax year for zip code 75856, filed in 2005:
Average Adjusted Gross Income (AGI) in 2004: $28,045 (Individual Income Tax Returns)
| Here: | $28,045 |
| State: | $47,881 |
Salary/wage: $27,071 (reported on 76.4% of returns)
| Here: | $27,071 |
| State: | $41,947 |
(% of AGI for various income ranges: 101.5% for AGIs below $10k, 72.6% for AGIs $10k-25k, 80.8% for AGIs $25k-50k, 144.7% for AGIs $50k-75k)
Taxable interest for individuals: $674 (reported on 41.8% of returns)
| This zip code: | $674 |
| Texas: | $2,255 |
(% of AGI for various income ranges: 3.7% for AGIs below $10k, 2.5% for AGIs $10k-25k, 1.3% for AGIs $50k-75k)
Taxable dividends: $263 (reported on 17.3% of returns)
Net capital gain/loss: +$4,562 (reported on 14.5% of returns)
| Here: | +$4,562 |
| State: | +$16,110 |
Profit/loss from business: +$3,706 (reported on 15.5% of returns)
| Here: | +$3,706 |
| State: | +$11,013 |
Total tax: $3,169 (reported on 64.5% of returns)
(% of AGI for various income ranges: 4.6% for AGIs $10k-25k, 6.0% for AGIs $25k-50k, 7.8% for AGIs $50k-75k, 11.3% for AGIs $75k-100k)
Earned income credit: $2,053 (reported on 17.3% of returns)
Percentage of individuals using paid preparers for their 2004 taxes: 71.8%
(% for various income ranges: 66.7% for AGIs below $10k, 63.9% for AGIs $10k-25k, 81.0% for AGIs $25k-50k, 146.2% for AGIs $50k-75k)
Estimated median household income in 2022: | This zip code: | $143,604 |
| Texas: | $72,284 |
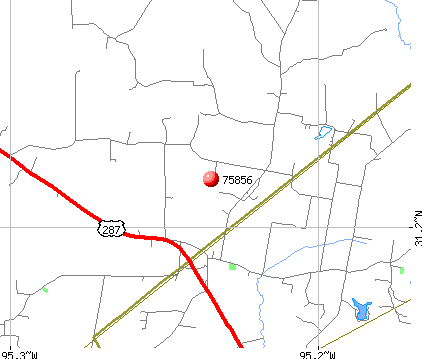
![75856 map]() Nearest zip codes: 75847
Nearest zip codes: 75847,
75845,
75862,
75858,
75835,
75851.
Percentage of family households:| This zip code: | 74.3% |
| Texas: | 50.5% |
Percentage of households with unmarried partners:| This zip code: | 14.0% |
| Texas: | 48.7% |
No gay or lesbian households reported
Household received Food Stamps/SNAP in the past 12 months: 0
Household did not receive Food Stamps/SNAP in the past 12 months: 89
Women who did not have a birth in the past 12 months: 89 (65 now married, 22 unmarried)
Residents with income below the poverty level in 2022:
| This zip code: | 9.2% |
| Whole state: | 14.0% |
| This zip code: | 9.2% |
| Whole state: | 7.4% |

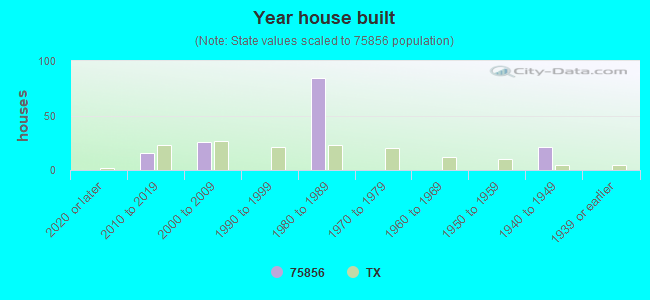
- Year house built (houses)
- 02020 or later
- 162010 to 2019
- 262000 to 2009
- 01990 to 1999
- 851980 to 1989
- 01970 to 1979
- 01960 to 1969
- 01950 to 1959
- 211940 to 1949
- 01939 or earlier
![Zip code 75856 satellite photo by USGS]()
Zip code 75856 household income distribution in 2022
![Zip code 75856 household income distribution in 2022]()
- 19$15,000 to $19,999
- 23$75,000 to $99,999
- 12$125,000 to $149,999
- 31$200,000 or more
Estimate of home value of owner-occupied houses/condos in 2022 in zip code 75856
![Estimate of home value of owner-occupied houses/condos in 2022 in zip code 75856]()
- 23$250,000 to $299,999
- 18$500,000 to $749,999
Rent paid by renters in 2022 in zip code 75856
![Rent paid by renters in 2022 in zip code 75856]()
- 32$650 to $699
- 20No cash rent
Estimated median house (or condo) value in 2022 for:
- White Non-Hispanic householders: $285,818
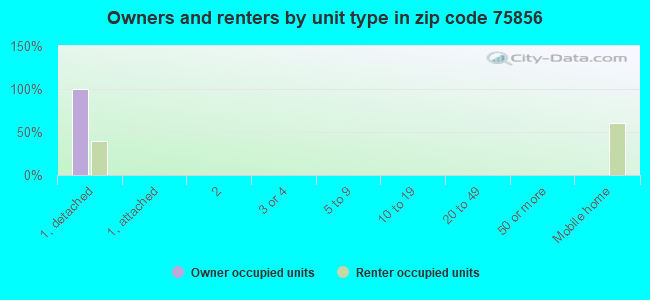
Housing units in structures:
- One, detached: 92
- Mobile homes: 57
Means of transportation to work in zip code 75856
![Means of transportation to work in zip code 75856]()
- 77.8%103Drove a car alone
- 17.4%23Walked
Travel time to work (commute) in zip code 75856
![Travel time to work (commute) in zip code 75856]()
- 22Less than 5 minutes
- 2310 to 14 minutes
- 2520 to 24 minutes
- 2625 to 29 minutes
- 3030 to 34 minutes
Percentage of zip code residents living and working in this county: 18.2%
Household type by relationship:
Households: 216
- Male householders: 89 (22 living alone), Female householders: 0 (0 living alone)
67 spouses (67 opposite-sex spouses), 0 unmarried partners, (0 opposite-sex unmarried partners), 61 children (61 natural, 0 adopted, 0 stepchildren), 0 grandchildren, 0 brothers or sisters, 0 parents, 0 foster children, 0 other relatives, 0 non-relatives
Size of family households: 31 2-persons, 13 3-persons, 22 4-persons
Size of nonfamily households: 21 1-person
52 married couples with children.
0 single-parent households ().
92.6% of residents of 75856 zip code speak English at home.
6.5% of residents speak Spanish at home (100% very well).
Foreign born population: 0 (0.0%)
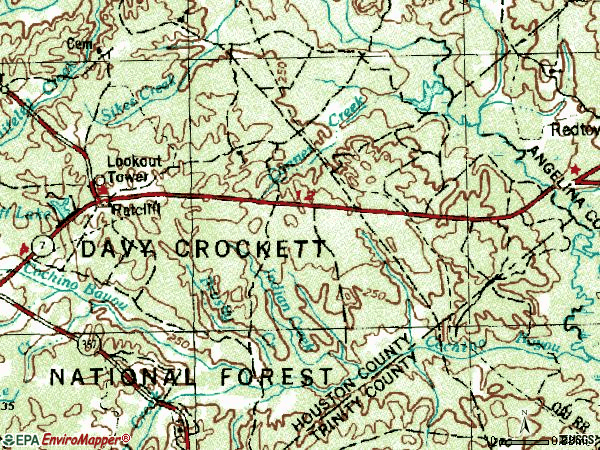
![Zip code 75856 topographic map]()
Housing units lacking complete plumbing facilities: 7.8%

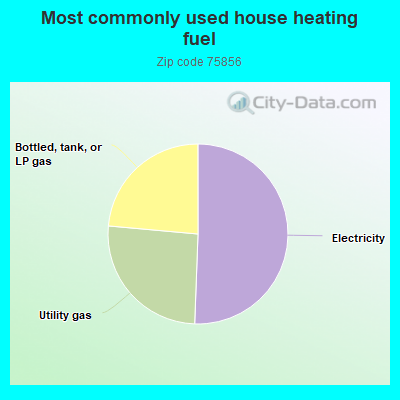
- 51.1%Electricity
- 26.1%Utility gas
- 23.8%Bottled, tank, or LP gas
Population in 1990: 565.
Place of birth for U.S.-born residents:
- This state: 177
- Midwest: 37
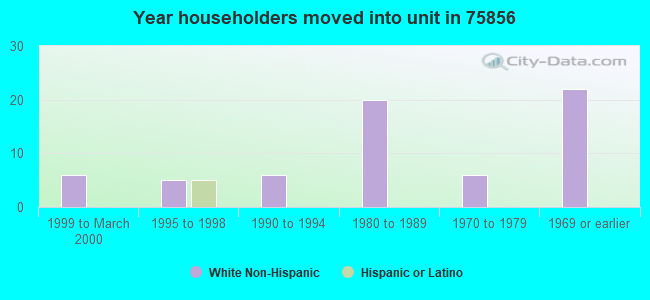
73% of the 75856 zip code residents lived in the same house 5 years ago.
Out of people who lived in different houses, 15% lived in this county.
71% of the 75856 zip code residents lived in the same house 1 year ago.
Out of people who lived in different houses, 111% moved from different state.
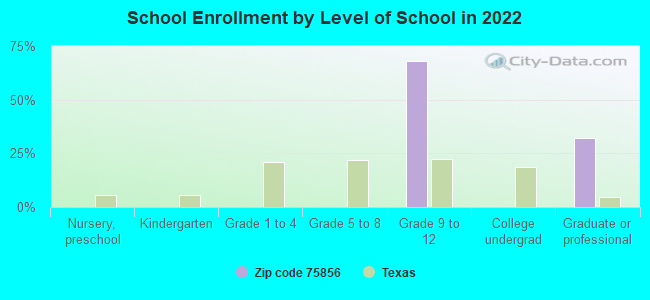
Students in private schools in grades 9 to 12 (high school):
Top industries in this zip code by the number of employees in 2005:
- Accommodation and Food Services: Full-Service Restaurants (1-4 employees: 1 establishment)
- Other Services (except Public Administration): Civic and Social Organizations (1-4: 1)
- Utilities: Water Supply and Irrigation Systems (1-4: 1)
| Most common first names in zip code 75856 among deceased individuals |
| Name | Count | Lived (average) |
|---|
| John | 4 | 80.0 years |
| Joe | 3 | 80.0 years |
| Mary | 3 | 74.0 years |
| Robert | 3 | 84.0 years |
| Willie | 3 | 71.0 years |
| Evelyn | 2 | 77.4 years |
| James | 2 | 80.0 years |
| Gladys | 2 | 76.1 years |
| Anna | 2 | 85.0 years |
| Annie | 2 | 84.0 years |
| Most common last names in zip code 75856 among deceased individuals |
| Last name | Count | Lived (average) |
|---|
| Williams | 7 | 82.0 years |
| David | 6 | 69.3 years |
| Magee | 5 | 89.4 years |
| Nelms | 5 | 86.0 years |
| Avery | 4 | 76.5 years |
| Dominy | 4 | 77.9 years |
| Pegoda | 4 | 75.0 years |
| Scurlock | 4 | 57.7 years |
| Davis | 3 | 90.3 years |
| Holmes | 3 | 84.3 years |
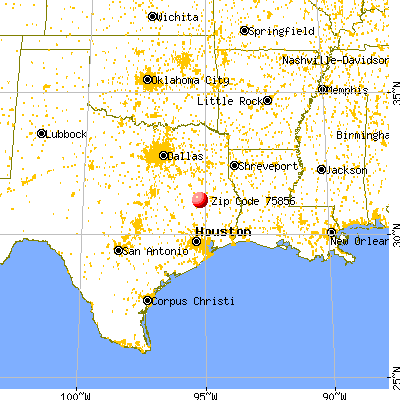


 Nearest zip codes: 75847, 75845, 75862, 75858, 75835, 75851.