Estimated zip code population in 2022: 22,569
Zip code population in 2010: 20,196
Zip code population in 2000: 23,884
Houses and condos: 9,616
Renter-occupied apartments: 4,154
% of renters here:
47%State:
38%
March 2022 cost of living index in zip code 76086: 95.2
(near average, U.S. average is 100)
Land area: 14.7
sq. mi.
Water area: 0.0
sq. mi.
Population density: 1,538 people per square mile (low).
OSM Map
General Map
Google Map
MSN Map
OSM Map
General Map
Google Map
MSN Map
OSM Map
General Map
Google Map
MSN Map
OSM Map
General Map
Google Map
MSN Map
Please wait while loading the map...
Real estate property taxes paid for housing units in 2022:
This zip code:
1.2% ($2,792)Texas:
1.5% ($4,050)
Median real estate property taxes paid for housing units with mortgages in 2022: $3,314 (1.2%)
Median real estate property taxes paid for housing units with no mortgage in 2022: $2,442 (1.3%)
Profiles of local businesses
Business Search - 14 Million verified businesses
Males: 11,351 Females: 11,218
For population 25 years and over in 76086:
High school or higher: 88.6%Bachelor's degree or higher: 23.7%Graduate or professional degree: 7.4%Unemployed: 3.4%Mean travel time to work (commute): 26.5 minutes
For population 15 years and over in 76086:
Never married: 29.7%Now married: 46.7%Separated: 1.2%Widowed: 8.3%Divorced: 14.1%
Zip code 76086 compared to state average:
Black race population percentage significantly below state average. Hispanic race population percentage below state average. Foreign-born population percentage significantly below state average. 16,605 73.6% White 3,680 16.3% Hispanic or Latino 901 4.0% Two or more races 882 3.9% Black 435 1.9% Asian 64 0.3% American Indian
Data:
Median household income ($)
Median household income (% change since 2000)
Household income diversity
Ratio of average income to average house value (%)
Ratio of average income to average rent
Median household income ($) - White
Median household income ($) - Black or African American
Median household income ($) - Asian
Median household income ($) - Hispanic or Latino
Median household income ($) - American Indian and Alaska Native
Median household income ($) - Multirace
Median household income ($) - Other Race
Median household income for houses/condos with a mortgage ($)
Median household income for apartments without a mortgage ($)
Races - White alone (%)
Races - White alone (% change since 2000)
Races - Black alone (%)
Races - Black alone (% change since 2000)
Races - American Indian alone (%)
Races - American Indian alone (% change since 2000)
Races - Asian alone (%)
Races - Asian alone (% change since 2000)
Races - Hispanic (%)
Races - Hispanic (% change since 2000)
Races - Native Hawaiian and Other Pacific Islander alone (%)
Races - Native Hawaiian and Other Pacific Islander alone (% change since 2000)
Races - Two or more races (%)
Races - Two or more races (% change since 2000)
Races - Other race alone (%)
Races - Other race alone (% change since 2000)
Racial diversity
Unemployment (%)
Unemployment (% change since 2000)
Unemployment (%) - White
Unemployment (%) - Black or African American
Unemployment (%) - Asian
Unemployment (%) - Hispanic or Latino
Unemployment (%) - American Indian and Alaska Native
Unemployment (%) - Multirace
Unemployment (%) - Other Race
Population density (people per square mile)
Population - Males (%)
Population - Females (%)
Population - Males (%) - White
Population - Males (%) - Black or African American
Population - Males (%) - Asian
Population - Males (%) - Hispanic or Latino
Population - Males (%) - American Indian and Alaska Native
Population - Males (%) - Multirace
Population - Males (%) - Other Race
Population - Females (%) - White
Population - Females (%) - Black or African American
Population - Females (%) - Asian
Population - Females (%) - Hispanic or Latino
Population - Females (%) - American Indian and Alaska Native
Population - Females (%) - Multirace
Population - Females (%) - Other Race
Coronavirus confirmed cases (Apr 27, 2024)
Deaths caused by coronavirus (Apr 27, 2024)
Coronavirus confirmed cases (per 100k population) (Apr 27, 2024)
Deaths caused by coronavirus (per 100k population) (Apr 27, 2024)
Daily increase in number of cases (Apr 27, 2024)
Weekly increase in number of cases (Apr 27, 2024)
Cases doubled (in days) (Apr 27, 2024)
Hospitalized patients (Apr 18, 2022)
Negative test results (Apr 18, 2022)
Total test results (Apr 18, 2022)
COVID Vaccine doses distributed (per 100k population) (Sep 19, 2023)
COVID Vaccine doses administered (per 100k population) (Sep 19, 2023)
COVID Vaccine doses distributed (Sep 19, 2023)
COVID Vaccine doses administered (Sep 19, 2023)
Likely homosexual households (%)
Likely homosexual households (% change since 2000)
Likely homosexual households - Lesbian couples (%)
Likely homosexual households - Lesbian couples (% change since 2000)
Likely homosexual households - Gay men (%)
Likely homosexual households - Gay men (% change since 2000)
Cost of living index
Median gross rent ($)
Median contract rent ($)
Median monthly housing costs ($)
Median house or condo value ($)
Median house or condo value ($ change since 2000)
Mean house or condo value by units in structure - 1, detached ($)
Mean house or condo value by units in structure - 1, attached ($)
Mean house or condo value by units in structure - 2 ($)
Mean house or condo value by units in structure by units in structure - 3 or 4 ($)
Mean house or condo value by units in structure - 5 or more ($)
Mean house or condo value by units in structure - Boat, RV, van, etc. ($)
Mean house or condo value by units in structure - Mobile home ($)
Median house or condo value ($) - White
Median house or condo value ($) - Black or African American
Median house or condo value ($) - Asian
Median house or condo value ($) - Hispanic or Latino
Median house or condo value ($) - American Indian and Alaska Native
Median house or condo value ($) - Multirace
Median house or condo value ($) - Other Race
Median resident age
Resident age diversity
Median resident age - Males
Median resident age - Females
Median resident age - White
Median resident age - Black or African American
Median resident age - Asian
Median resident age - Hispanic or Latino
Median resident age - American Indian and Alaska Native
Median resident age - Multirace
Median resident age - Other Race
Median resident age - Males - White
Median resident age - Males - Black or African American
Median resident age - Males - Asian
Median resident age - Males - Hispanic or Latino
Median resident age - Males - American Indian and Alaska Native
Median resident age - Males - Multirace
Median resident age - Males - Other Race
Median resident age - Females - White
Median resident age - Females - Black or African American
Median resident age - Females - Asian
Median resident age - Females - Hispanic or Latino
Median resident age - Females - American Indian and Alaska Native
Median resident age - Females - Multirace
Median resident age - Females - Other Race
Commute - mean travel time to work (minutes)
Travel time to work - Less than 5 minutes (%)
Travel time to work - Less than 5 minutes (% change since 2000)
Travel time to work - 5 to 9 minutes (%)
Travel time to work - 5 to 9 minutes (% change since 2000)
Travel time to work - 10 to 19 minutes (%)
Travel time to work - 10 to 19 minutes (% change since 2000)
Travel time to work - 20 to 29 minutes (%)
Travel time to work - 20 to 29 minutes (% change since 2000)
Travel time to work - 30 to 39 minutes (%)
Travel time to work - 30 to 39 minutes (% change since 2000)
Travel time to work - 40 to 59 minutes (%)
Travel time to work - 40 to 59 minutes (% change since 2000)
Travel time to work - 60 to 89 minutes (%)
Travel time to work - 60 to 89 minutes (% change since 2000)
Travel time to work - 90 or more minutes (%)
Travel time to work - 90 or more minutes (% change since 2000)
Marital status - Never married (%)
Marital status - Now married (%)
Marital status - Separated (%)
Marital status - Widowed (%)
Marital status - Divorced (%)
Median family income ($)
Median family income (% change since 2000)
Median non-family income ($)
Median non-family income (% change since 2000)
Median per capita income ($)
Median per capita income (% change since 2000)
Median family income ($) - White
Median family income ($) - Black or African American
Median family income ($) - Asian
Median family income ($) - Hispanic or Latino
Median family income ($) - American Indian and Alaska Native
Median family income ($) - Multirace
Median family income ($) - Other Race
Median year house/condo built
Median year apartment built
Year house built - Built 2005 or later (%)
Year house built - Built 2000 to 2004 (%)
Year house built - Built 1990 to 1999 (%)
Year house built - Built 1980 to 1989 (%)
Year house built - Built 1970 to 1979 (%)
Year house built - Built 1960 to 1969 (%)
Year house built - Built 1950 to 1959 (%)
Year house built - Built 1940 to 1949 (%)
Year house built - Built 1939 or earlier (%)
Average household size
Household density (households per square mile)
Average household size - White
Average household size - Black or African American
Average household size - Asian
Average household size - Hispanic or Latino
Average household size - American Indian and Alaska Native
Average household size - Multirace
Average household size - Other Race
Occupied housing units (%)
Vacant housing units (%)
Owner occupied housing units (%)
Renter occupied housing units (%)
Vacancy status - For rent (%)
Vacancy status - For sale only (%)
Vacancy status - Rented or sold, not occupied (%)
Vacancy status - For seasonal, recreational, or occasional use (%)
Vacancy status - For migrant workers (%)
Vacancy status - Other vacant (%)
Residents with income below the poverty level (%)
Residents with income below 50% of the poverty level (%)
Children below poverty level (%)
Poor families by family type - Married-couple family (%)
Poor families by family type - Male, no wife present (%)
Poor families by family type - Female, no husband present (%)
Poverty status for native-born residents (%)
Poverty status for foreign-born residents (%)
Poverty among high school graduates not in families (%)
Poverty among people who did not graduate high school not in families (%)
Residents with income below the poverty level (%) - White
Residents with income below the poverty level (%) - Black or African American
Residents with income below the poverty level (%) - Asian
Residents with income below the poverty level (%) - Hispanic or Latino
Residents with income below the poverty level (%) - American Indian and Alaska Native
Residents with income below the poverty level (%) - Multirace
Residents with income below the poverty level (%) - Other Race
Air pollution - Air Quality Index (AQI)
Air pollution - CO
Air pollution - NO2
Air pollution - SO2
Air pollution - Ozone
Air pollution - PM10
Air pollution - PM25
Air pollution - Pb
Crime - Murders per 100,000 population
Crime - Rapes per 100,000 population
Crime - Robberies per 100,000 population
Crime - Assaults per 100,000 population
Crime - Burglaries per 100,000 population
Crime - Thefts per 100,000 population
Crime - Auto thefts per 100,000 population
Crime - Arson per 100,000 population
Crime - City-data.com crime index
Crime - Violent crime index
Crime - Property crime index
Crime - Murders per 100,000 population (5 year average)
Crime - Rapes per 100,000 population (5 year average)
Crime - Robberies per 100,000 population (5 year average)
Crime - Assaults per 100,000 population (5 year average)
Crime - Burglaries per 100,000 population (5 year average)
Crime - Thefts per 100,000 population (5 year average)
Crime - Auto thefts per 100,000 population (5 year average)
Crime - Arson per 100,000 population (5 year average)
Crime - City-data.com crime index (5 year average)
Crime - Violent crime index (5 year average)
Crime - Property crime index (5 year average)
1996 Presidential Elections Results (%) - Democratic Party (Clinton)
1996 Presidential Elections Results (%) - Republican Party (Dole)
1996 Presidential Elections Results (%) - Other
2000 Presidential Elections Results (%) - Democratic Party (Gore)
2000 Presidential Elections Results (%) - Republican Party (Bush)
2000 Presidential Elections Results (%) - Other
2004 Presidential Elections Results (%) - Democratic Party (Kerry)
2004 Presidential Elections Results (%) - Republican Party (Bush)
2004 Presidential Elections Results (%) - Other
2008 Presidential Elections Results (%) - Democratic Party (Obama)
2008 Presidential Elections Results (%) - Republican Party (McCain)
2008 Presidential Elections Results (%) - Other
2012 Presidential Elections Results (%) - Democratic Party (Obama)
2012 Presidential Elections Results (%) - Republican Party (Romney)
2012 Presidential Elections Results (%) - Other
2016 Presidential Elections Results (%) - Democratic Party (Clinton)
2016 Presidential Elections Results (%) - Republican Party (Trump)
2016 Presidential Elections Results (%) - Other
2020 Presidential Elections Results (%) - Democratic Party (Biden)
2020 Presidential Elections Results (%) - Republican Party (Trump)
2020 Presidential Elections Results (%) - Other
Ancestries Reported - Arab (%)
Ancestries Reported - Czech (%)
Ancestries Reported - Danish (%)
Ancestries Reported - Dutch (%)
Ancestries Reported - English (%)
Ancestries Reported - French (%)
Ancestries Reported - French Canadian (%)
Ancestries Reported - German (%)
Ancestries Reported - Greek (%)
Ancestries Reported - Hungarian (%)
Ancestries Reported - Irish (%)
Ancestries Reported - Italian (%)
Ancestries Reported - Lithuanian (%)
Ancestries Reported - Norwegian (%)
Ancestries Reported - Polish (%)
Ancestries Reported - Portuguese (%)
Ancestries Reported - Russian (%)
Ancestries Reported - Scotch-Irish (%)
Ancestries Reported - Scottish (%)
Ancestries Reported - Slovak (%)
Ancestries Reported - Subsaharan African (%)
Ancestries Reported - Swedish (%)
Ancestries Reported - Swiss (%)
Ancestries Reported - Ukrainian (%)
Ancestries Reported - United States (%)
Ancestries Reported - Welsh (%)
Ancestries Reported - West Indian (%)
Ancestries Reported - Other (%)
Educational Attainment - No schooling completed (%)
Educational Attainment - Less than high school (%)
Educational Attainment - High school or equivalent (%)
Educational Attainment - Less than 1 year of college (%)
Educational Attainment - 1 or more years of college (%)
Educational Attainment - Associate degree (%)
Educational Attainment - Bachelor's degree (%)
Educational Attainment - Master's degree (%)
Educational Attainment - Professional school degree (%)
Educational Attainment - Doctorate degree (%)
School Enrollment - Nursery, preschool (%)
School Enrollment - Kindergarten (%)
School Enrollment - Grade 1 to 4 (%)
School Enrollment - Grade 5 to 8 (%)
School Enrollment - Grade 9 to 12 (%)
School Enrollment - College undergrad (%)
School Enrollment - Graduate or professional (%)
School Enrollment - Not enrolled in school (%)
School enrollment - Public schools (%)
School enrollment - Private schools (%)
School enrollment - Not enrolled (%)
Median number of rooms in houses and condos
Median number of rooms in apartments
Housing units lacking complete plumbing facilities (%)
Housing units lacking complete kitchen facilities (%)
Density of houses
Urban houses (%)
Rural houses (%)
Households with people 60 years and over (%)
Households with people 65 years and over (%)
Households with people 75 years and over (%)
Households with one or more nonrelatives (%)
Households with no nonrelatives (%)
Population in households (%)
Family households (%)
Nonfamily households (%)
Population in families (%)
Family households with own children (%)
Median number of bedrooms in owner occupied houses
Mean number of bedrooms in owner occupied houses
Median number of bedrooms in renter occupied houses
Mean number of bedrooms in renter occupied houses
Median number of vehichles in owner occupied houses
Mean number of vehichles in owner occupied houses
Median number of vehichles in renter occupied houses
Mean number of vehichles in renter occupied houses
Mortgage status - with mortgage (%)
Mortgage status - with second mortgage (%)
Mortgage status - with home equity loan (%)
Mortgage status - with both second mortgage and home equity loan (%)
Mortgage status - without a mortgage (%)
Average family size
Average family size - White
Average family size - Black or African American
Average family size - Asian
Average family size - Hispanic or Latino
Average family size - American Indian and Alaska Native
Average family size - Multirace
Average family size - Other Race
Geographical mobility - Same house 1 year ago (%)
Geographical mobility - Moved within same county (%)
Geographical mobility - Moved from different county within same state (%)
Geographical mobility - Moved from different state (%)
Geographical mobility - Moved from abroad (%)
Place of birth - Born in state of residence (%)
Place of birth - Born in other state (%)
Place of birth - Native, outside of US (%)
Place of birth - Foreign born (%)
Housing units in structures - 1, detached (%)
Housing units in structures - 1, attached (%)
Housing units in structures - 2 (%)
Housing units in structures - 3 or 4 (%)
Housing units in structures - 5 to 9 (%)
Housing units in structures - 10 to 19 (%)
Housing units in structures - 20 to 49 (%)
Housing units in structures - 50 or more (%)
Housing units in structures - Mobile home (%)
Housing units in structures - Boat, RV, van, etc. (%)
House/condo owner moved in on average (years ago)
Renter moved in on average (years ago)
Year householder moved into unit - Moved in 1999 to March 2000 (%)
Year householder moved into unit - Moved in 1995 to 1998 (%)
Year householder moved into unit - Moved in 1990 to 1994 (%)
Year householder moved into unit - Moved in 1980 to 1989 (%)
Year householder moved into unit - Moved in 1970 to 1979 (%)
Year householder moved into unit - Moved in 1969 or earlier (%)
Means of transportation to work - Drove car alone (%)
Means of transportation to work - Carpooled (%)
Means of transportation to work - Public transportation (%)
Means of transportation to work - Bus or trolley bus (%)
Means of transportation to work - Streetcar or trolley car (%)
Means of transportation to work - Subway or elevated (%)
Means of transportation to work - Railroad (%)
Means of transportation to work - Ferryboat (%)
Means of transportation to work - Taxicab (%)
Means of transportation to work - Motorcycle (%)
Means of transportation to work - Bicycle (%)
Means of transportation to work - Walked (%)
Means of transportation to work - Other means (%)
Working at home (%)
Industry diversity
Most Common Industries - Agriculture, forestry, fishing and hunting, and mining (%)
Most Common Industries - Agriculture, forestry, fishing and hunting (%)
Most Common Industries - Mining, quarrying, and oil and gas extraction (%)
Most Common Industries - Construction (%)
Most Common Industries - Manufacturing (%)
Most Common Industries - Wholesale trade (%)
Most Common Industries - Retail trade (%)
Most Common Industries - Transportation and warehousing, and utilities (%)
Most Common Industries - Transportation and warehousing (%)
Most Common Industries - Utilities (%)
Most Common Industries - Information (%)
Most Common Industries - Finance and insurance, and real estate and rental and leasing (%)
Most Common Industries - Finance and insurance (%)
Most Common Industries - Real estate and rental and leasing (%)
Most Common Industries - Professional, scientific, and management, and administrative and waste management services (%)
Most Common Industries - Professional, scientific, and technical services (%)
Most Common Industries - Management of companies and enterprises (%)
Most Common Industries - Administrative and support and waste management services (%)
Most Common Industries - Educational services, and health care and social assistance (%)
Most Common Industries - Educational services (%)
Most Common Industries - Health care and social assistance (%)
Most Common Industries - Arts, entertainment, and recreation, and accommodation and food services (%)
Most Common Industries - Arts, entertainment, and recreation (%)
Most Common Industries - Accommodation and food services (%)
Most Common Industries - Other services, except public administration (%)
Most Common Industries - Public administration (%)
Occupation diversity
Most Common Occupations - Management, business, science, and arts occupations (%)
Most Common Occupations - Management, business, and financial occupations (%)
Most Common Occupations - Management occupations (%)
Most Common Occupations - Business and financial operations occupations (%)
Most Common Occupations - Computer, engineering, and science occupations (%)
Most Common Occupations - Computer and mathematical occupations (%)
Most Common Occupations - Architecture and engineering occupations (%)
Most Common Occupations - Life, physical, and social science occupations (%)
Most Common Occupations - Education, legal, community service, arts, and media occupations (%)
Most Common Occupations - Community and social service occupations (%)
Most Common Occupations - Legal occupations (%)
Most Common Occupations - Education, training, and library occupations (%)
Most Common Occupations - Arts, design, entertainment, sports, and media occupations (%)
Most Common Occupations - Healthcare practitioners and technical occupations (%)
Most Common Occupations - Health diagnosing and treating practitioners and other technical occupations (%)
Most Common Occupations - Health technologists and technicians (%)
Most Common Occupations - Service occupations (%)
Most Common Occupations - Healthcare support occupations (%)
Most Common Occupations - Protective service occupations (%)
Most Common Occupations - Fire fighting and prevention, and other protective service workers including supervisors (%)
Most Common Occupations - Law enforcement workers including supervisors (%)
Most Common Occupations - Food preparation and serving related occupations (%)
Most Common Occupations - Building and grounds cleaning and maintenance occupations (%)
Most Common Occupations - Personal care and service occupations (%)
Most Common Occupations - Sales and office occupations (%)
Most Common Occupations - Sales and related occupations (%)
Most Common Occupations - Office and administrative support occupations (%)
Most Common Occupations - Natural resources, construction, and maintenance occupations (%)
Most Common Occupations - Farming, fishing, and forestry occupations (%)
Most Common Occupations - Construction and extraction occupations (%)
Most Common Occupations - Installation, maintenance, and repair occupations (%)
Most Common Occupations - Production, transportation, and material moving occupations (%)
Most Common Occupations - Production occupations (%)
Most Common Occupations - Transportation occupations (%)
Most Common Occupations - Material moving occupations (%)
People in Group quarters - Institutionalized population (%)
People in Group quarters - Correctional institutions (%)
People in Group quarters - Federal prisons and detention centers (%)
People in Group quarters - Halfway houses (%)
People in Group quarters - Local jails and other confinement facilities (including police lockups) (%)
People in Group quarters - Military disciplinary barracks (%)
People in Group quarters - State prisons (%)
People in Group quarters - Other types of correctional institutions (%)
People in Group quarters - Nursing homes (%)
People in Group quarters - Hospitals/wards, hospices, and schools for the handicapped (%)
People in Group quarters - Hospitals/wards and hospices for chronically ill (%)
People in Group quarters - Hospices or homes for chronically ill (%)
People in Group quarters - Military hospitals or wards for chronically ill (%)
People in Group quarters - Other hospitals or wards for chronically ill (%)
People in Group quarters - Hospitals or wards for drug/alcohol abuse (%)
People in Group quarters - Mental (Psychiatric) hospitals or wards (%)
People in Group quarters - Schools, hospitals, or wards for the mentally retarded (%)
People in Group quarters - Schools, hospitals, or wards for the physically handicapped (%)
People in Group quarters - Institutions for the deaf (%)
People in Group quarters - Institutions for the blind (%)
People in Group quarters - Orthopedic wards and institutions for the physically handicapped (%)
People in Group quarters - Wards in general hospitals for patients who have no usual home elsewhere (%)
People in Group quarters - Wards in military hospitals for patients who have no usual home elsewhere (%)
People in Group quarters - Juvenile institutions (%)
People in Group quarters - Long-term care (%)
People in Group quarters - Homes for abused, dependent, and neglected children (%)
People in Group quarters - Residential treatment centers for emotionally disturbed children (%)
People in Group quarters - Training schools for juvenile delinquents (%)
People in Group quarters - Short-term care, detention or diagnostic centers for delinquent children (%)
People in Group quarters - Type of juvenile institution unknown (%)
People in Group quarters - Noninstitutionalized population (%)
People in Group quarters - College dormitories (includes college quarters off campus) (%)
People in Group quarters - Military quarters (%)
People in Group quarters - On base (%)
People in Group quarters - Barracks, unaccompanied personnel housing (UPH), (Enlisted/Officer), ;and similar group living quarters for military personnel (%)
People in Group quarters - Transient quarters for temporary residents (%)
People in Group quarters - Military ships (%)
People in Group quarters - Group homes (%)
People in Group quarters - Homes or halfway houses for drug/alcohol abuse (%)
People in Group quarters - Homes for the mentally ill (%)
People in Group quarters - Homes for the mentally retarded (%)
People in Group quarters - Homes for the physically handicapped (%)
People in Group quarters - Other group homes (%)
People in Group quarters - Religious group quarters (%)
People in Group quarters - Dormitories (%)
People in Group quarters - Agriculture workers' dormitories on farms (%)
People in Group quarters - Job Corps and vocational training facilities (%)
People in Group quarters - Other workers' dormitories (%)
People in Group quarters - Crews of maritime vessels (%)
People in Group quarters - Other nonhousehold living situations (%)
People in Group quarters - Other noninstitutional group quarters (%)
Residents speaking English at home (%)
Residents speaking English at home - Born in the United States (%)
Residents speaking English at home - Native, born elsewhere (%)
Residents speaking English at home - Foreign born (%)
Residents speaking Spanish at home (%)
Residents speaking Spanish at home - Born in the United States (%)
Residents speaking Spanish at home - Native, born elsewhere (%)
Residents speaking Spanish at home - Foreign born (%)
Residents speaking other language at home (%)
Residents speaking other language at home - Born in the United States (%)
Residents speaking other language at home - Native, born elsewhere (%)
Residents speaking other language at home - Foreign born (%)
Class of Workers - Employee of private company (%)
Class of Workers - Self-employed in own incorporated business (%)
Class of Workers - Private not-for-profit wage and salary workers (%)
Class of Workers - Local government workers (%)
Class of Workers - State government workers (%)
Class of Workers - Federal government workers (%)
Class of Workers - Self-employed workers in own not incorporated business and Unpaid family workers (%)
House heating fuel used in houses and condos - Utility gas (%)
House heating fuel used in houses and condos - Bottled, tank, or LP gas (%)
House heating fuel used in houses and condos - Electricity (%)
House heating fuel used in houses and condos - Fuel oil, kerosene, etc. (%)
House heating fuel used in houses and condos - Coal or coke (%)
House heating fuel used in houses and condos - Wood (%)
House heating fuel used in houses and condos - Solar energy (%)
House heating fuel used in houses and condos - Other fuel (%)
House heating fuel used in houses and condos - No fuel used (%)
House heating fuel used in apartments - Utility gas (%)
House heating fuel used in apartments - Bottled, tank, or LP gas (%)
House heating fuel used in apartments - Electricity (%)
House heating fuel used in apartments - Fuel oil, kerosene, etc. (%)
House heating fuel used in apartments - Coal or coke (%)
House heating fuel used in apartments - Wood (%)
House heating fuel used in apartments - Solar energy (%)
House heating fuel used in apartments - Other fuel (%)
House heating fuel used in apartments - No fuel used (%)
Armed forces status - In Armed Forces (%)
Armed forces status - Civilian (%)
Armed forces status - Civilian - Veteran (%)
Armed forces status - Civilian - Nonveteran (%)
Fatal accidents locations in years 2005-2021
Fatal accidents locations in 2005
Fatal accidents locations in 2006
Fatal accidents locations in 2007
Fatal accidents locations in 2008
Fatal accidents locations in 2009
Fatal accidents locations in 2010
Fatal accidents locations in 2011
Fatal accidents locations in 2012
Fatal accidents locations in 2013
Fatal accidents locations in 2014
Fatal accidents locations in 2015
Fatal accidents locations in 2016
Fatal accidents locations in 2017
Fatal accidents locations in 2018
Fatal accidents locations in 2019
Fatal accidents locations in 2020
Fatal accidents locations in 2021
Alcohol use - People drinking some alcohol every month (%)
Alcohol use - People not drinking at all (%)
Alcohol use - Average days/month drinking alcohol
Alcohol use - Average drinks/week
Alcohol use - Average days/year people drink much
Audiometry - Average condition of hearing (%)
Audiometry - People that can hear a whisper from across a quiet room (%)
Audiometry - People that can hear normal voice from across a quiet room (%)
Audiometry - Ears ringing, roaring, buzzing (%)
Audiometry - Had a job exposure to loud noise (%)
Audiometry - Had off-work exposure to loud noise (%)
Blood Pressure & Cholesterol - Has high blood pressure (%)
Blood Pressure & Cholesterol - Checking blood pressure at home (%)
Blood Pressure & Cholesterol - Frequently checking blood cholesterol (%)
Blood Pressure & Cholesterol - Has high cholesterol level (%)
Consumer Behavior - Money monthly spent on food at supermarket/grocery store
Consumer Behavior - Money monthly spent on food at other stores
Consumer Behavior - Money monthly spent on eating out
Consumer Behavior - Money monthly spent on carryout/delivered foods
Consumer Behavior - Income spent on food at supermarket/grocery store (%)
Consumer Behavior - Income spent on food at other stores (%)
Consumer Behavior - Income spent on eating out (%)
Consumer Behavior - Income spent on carryout/delivered foods (%)
Current Health Status - General health condition (%)
Current Health Status - Blood donors (%)
Current Health Status - Has blood ever tested for HIV virus (%)
Current Health Status - Left-handed people (%)
Dermatology - People using sunscreen (%)
Diabetes - Diabetics (%)
Diabetes - Had a blood test for high blood sugar (%)
Diabetes - People taking insulin (%)
Diet Behavior & Nutrition - Diet health (%)
Diet Behavior & Nutrition - Milk product consumption (# of products/month)
Diet Behavior & Nutrition - Meals not home prepared (#/week)
Diet Behavior & Nutrition - Meals from fast food or pizza place (#/week)
Diet Behavior & Nutrition - Ready-to-eat foods (#/month)
Diet Behavior & Nutrition - Frozen meals/pizza (#/month)
Drug Use - People that ever used marijuana or hashish (%)
Drug Use - Ever used hard drugs (%)
Drug Use - Ever used any form of cocaine (%)
Drug Use - Ever used heroin (%)
Drug Use - Ever used methamphetamine (%)
Health Insurance - People covered by health insurance (%)
Kidney Conditions-Urology - Avg. # of times urinating at night
Medical Conditions - People with asthma (%)
Medical Conditions - People with anemia (%)
Medical Conditions - People with psoriasis (%)
Medical Conditions - People with overweight (%)
Medical Conditions - Elderly people having difficulties in thinking or remembering (%)
Medical Conditions - People who ever received blood transfusion (%)
Medical Conditions - People having trouble seeing even with glass/contacts (%)
Medical Conditions - People with arthritis (%)
Medical Conditions - People with gout (%)
Medical Conditions - People with congestive heart failure (%)
Medical Conditions - People with coronary heart disease (%)
Medical Conditions - People with angina pectoris (%)
Medical Conditions - People who ever had heart attack (%)
Medical Conditions - People who ever had stroke (%)
Medical Conditions - People with emphysema (%)
Medical Conditions - People with thyroid problem (%)
Medical Conditions - People with chronic bronchitis (%)
Medical Conditions - People with any liver condition (%)
Medical Conditions - People who ever had cancer or malignancy (%)
Mental Health - People who have little interest in doing things (%)
Mental Health - People feeling down, depressed, or hopeless (%)
Mental Health - People who have trouble sleeping or sleeping too much (%)
Mental Health - People feeling tired or having little energy (%)
Mental Health - People with poor appetite or overeating (%)
Mental Health - People feeling bad about themself (%)
Mental Health - People who have trouble concentrating on things (%)
Mental Health - People moving or speaking slowly or too fast (%)
Mental Health - People having thoughts they would be better off dead (%)
Oral Health - Average years since last visit a dentist
Oral Health - People embarrassed because of mouth (%)
Oral Health - People with gum disease (%)
Oral Health - General health of teeth and gums (%)
Oral Health - Average days a week using dental floss/device
Oral Health - Average days a week using mouthwash for dental problem
Oral Health - Average number of teeth
Pesticide Use - Households using pesticides to control insects (%)
Pesticide Use - Households using pesticides to kill weeds (%)
Physical Activity - People doing vigorous-intensity work activities (%)
Physical Activity - People doing moderate-intensity work activities (%)
Physical Activity - People walking or bicycling (%)
Physical Activity - People doing vigorous-intensity recreational activities (%)
Physical Activity - People doing moderate-intensity recreational activities (%)
Physical Activity - Average hours a day doing sedentary activities
Physical Activity - Average hours a day watching TV or videos
Physical Activity - Average hours a day using computer
Physical Functioning - People having limitations keeping them from working (%)
Physical Functioning - People limited in amount of work they can do (%)
Physical Functioning - People that need special equipment to walk (%)
Physical Functioning - People experiencing confusion/memory problems (%)
Physical Functioning - People requiring special healthcare equipment (%)
Prescription Medications - Average number of prescription medicines taking
Preventive Aspirin Use - Adults 40+ taking low-dose aspirin (%)
Reproductive Health - Vaginal deliveries (%)
Reproductive Health - Cesarean deliveries (%)
Reproductive Health - Deliveries resulted in a live birth (%)
Reproductive Health - Pregnancies resulted in a delivery (%)
Reproductive Health - Women breastfeeding newborns (%)
Reproductive Health - Women that had a hysterectomy (%)
Reproductive Health - Women that had both ovaries removed (%)
Reproductive Health - Women that have ever taken birth control pills (%)
Reproductive Health - Women taking birth control pills (%)
Reproductive Health - Women that have ever used Depo-Provera or injectables (%)
Reproductive Health - Women that have ever used female hormones (%)
Sexual Behavior - People 18+ that ever had sex (vaginal, anal, or oral) (%)
Sexual Behavior - Males 18+ that ever had vaginal sex with a woman (%)
Sexual Behavior - Males 18+ that ever performed oral sex on a woman (%)
Sexual Behavior - Males 18+ that ever had anal sex with a woman (%)
Sexual Behavior - Males 18+ that ever had any sex with a man (%)
Sexual Behavior - Females 18+ that ever had vaginal sex with a man (%)
Sexual Behavior - Females 18+ that ever performed oral sex on a man (%)
Sexual Behavior - Females 18+ that ever had anal sex with a man (%)
Sexual Behavior - Females 18+ that ever had any kind of sex with a woman (%)
Sexual Behavior - Average age people first had sex
Sexual Behavior - Average number of female sex partners in lifetime (males 18+)
Sexual Behavior - Average number of female vaginal sex partners in lifetime (males 18+)
Sexual Behavior - Average age people first performed oral sex on a woman (18+)
Sexual Behavior - Average number of woman performed oral sex on in lifetime (18+)
Sexual Behavior - Average number of male sex partners in lifetime (males 18+)
Sexual Behavior - Average number of male anal sex partners in lifetime (males 18+)
Sexual Behavior - Average age people first performed oral sex on a man (18+)
Sexual Behavior - Average number of male oral sex partners in lifetime (18+)
Sexual Behavior - People using protection when performing oral sex (%)
Sexual Behavior - Average number of times people have vaginal or anal sex a year
Sexual Behavior - People having sex without condom (%)
Sexual Behavior - Average number of male sex partners in lifetime (females 18+)
Sexual Behavior - Average number of male vaginal sex partners in lifetime (females 18+)
Sexual Behavior - Average number of female sex partners in lifetime (females 18+)
Sexual Behavior - Circumcised males 18+ (%)
Sleep Disorders - Average hours sleeping at night
Sleep Disorders - People that has trouble sleeping (%)
Smoking-Cigarette Use - People smoking cigarettes (%)
Taste & Smell - People 40+ having problems with smell (%)
Taste & Smell - People 40+ having problems with taste (%)
Taste & Smell - People 40+ that ever had wisdom teeth removed (%)
Taste & Smell - People 40+ that ever had tonsils teeth removed (%)
Taste & Smell - People 40+ that ever had a loss of consciousness because of a head injury (%)
Taste & Smell - People 40+ that ever had a broken nose or other serious injury to face or skull (%)
Taste & Smell - People 40+ that ever had two or more sinus infections (%)
Weight - Average height (inches)
Weight - Average weight (pounds)
Weight - Average BMI
Weight - People that are obese (%)
Weight - People that ever were obese (%)
Weight - People trying to lose weight (%)
Urban population: 17,332
Rural population: 5,236
Estimated median house/condo value in 2022: $236,057
76086:
$236,057Texas:
$275,400
According to our research of Texas and other state lists, there were 41 registered sex offenders living in 76086 zip code as of April 27, 2024 . The ratio of all residents to sex offenders in zip code 76086 is 531 to 1.The ratio of registered sex offenders to all residents in this zip code is near the state average.
Median resident age: This zip code:
35.8 yearsTexas median age:
35.6 years
Average household size: This zip code:
2.4 peopleTexas:
2.6 people
Averages for the 2020 tax year for zip code 76086, filed in 2021:
Average Adjusted Gross Income (AGI) in 2020: $58,162 (Individual Income Tax Returns) Here:
$58,162State:
$77,054
Salary/wage: $49,863 (reported on 81.5% of returns )Here:
$49,863State:
$62,766
(% of AGI for various income ranges: 1212.3% for AGIs below $25k , 3550.5% for AGIs $25k-50k , 6468.3% for AGIs $50k-75k , 9464.7% for AGIs $75k-100k , 17713.7% for AGIs $100k-200k , 67584.3% for AGIs over 200k ) Taxable interest for individuals: $1,830 (reported on 21.1% of returns )This zip code:
$1,830Texas:
$2,665
(% of AGI for various income ranges: 14.2% for AGIs below $25k , 18.5% for AGIs $25k-50k , 31.1% for AGIs $50k-75k , 46.8% for AGIs $75k-100k , 152.8% for AGIs $100k-200k , 2171.4% for AGIs over 200k ) Ordinary dividends: $5,212 (reported on 11.3% of returns )(% of AGI for various income ranges: 15.8% for AGIs below $25k , 20.8% for AGIs $25k-50k , 43.6% for AGIs $50k-75k , 77.6% for AGIs $75k-100k , 223.7% for AGIs $100k-200k , 3887.1% for AGIs over 200k ) Net capital gain/loss in AGI: +$20,586 (reported on 11.3% of returns )Here:
+$20,586State:
+$39,590
(% of AGI for various income ranges: 8.2% for AGIs below $25k , 27.9% for AGIs $25k-50k , 37.9% for AGIs $50k-75k , 171.2% for AGIs $75k-100k , 460.6% for AGIs $100k-200k , 27000.0% for AGIs over 200k ) Profit/loss from business: +$11,338 (reported on 19.4% of returns )Here:
+$11,338State:
+$10,888
(% of AGI for various income ranges: 159.4% for AGIs below $25k , 170.7% for AGIs $25k-50k , 325.6% for AGIs $50k-75k , 387.4% for AGIs $75k-100k , 772.5% for AGIs $100k-200k , 4287.1% for AGIs over 200k ) Taxable individual retirement arrangement distribution: $18,803 (reported on 7.0% of returns )76086:
$18,803Texas:
$24,740
(% of AGI for various income ranges: 48.5% for AGIs below $25k , 70.0% for AGIs $25k-50k , 151.9% for AGIs $50k-75k , 190.0% for AGIs $75k-100k , 637.8% for AGIs $100k-200k , 4751.4% for AGIs over 200k ) Total itemized deductions: $38,202 (reported on 5.7% of returns )Here:
$38,202State:
$40,428
(% of AGI for various income ranges: 56.2% for AGIs below $25k , 95.5% for AGIs $25k-50k , 213.2% for AGIs $50k-75k , 345.1% for AGIs $75k-100k , 791.0% for AGIs $100k-200k , 12671.4% for AGIs over 200k ) Charity contributions: $13,424 (reported on 4.3% of returns )Here:
$13,424State:
$18,201
(% of AGI for various income ranges: 4.2% for AGIs below $25k , 14.3% for AGIs $25k-50k , 32.9% for AGIs $50k-75k , 62.9% for AGIs $75k-100k , 279.0% for AGIs $100k-200k , 4120.0% for AGIs over 200k ) Taxes paid: $6,129 (reported on 5.5% of returns )(% of AGI for various income ranges: 6.7% for AGIs below $25k , 13.7% for AGIs $25k-50k , 39.9% for AGIs $50k-75k , 70.4% for AGIs $75k-100k , 168.8% for AGIs $100k-200k , 1347.1% for AGIs over 200k ) Earned income credit: $2,413 (reported on 17.8% of returns )(% of AGI for various income ranges: 104.2% for AGIs below $25k , 73.8% for AGIs $25k-50k , 1.8% for AGIs $50k-75k ) Percentage of individuals using paid preparers for their 2020 taxes: 93.6%(% for various income ranges: 92.9% for AGIs below $25k , 93.4% for AGIs $25k-50k , 94.7% for AGIs $50k-75k , 94.8% for AGIs $75k-100k , 94.0% for AGIs $100k-200k , 92.6% for AGIs over 200k )
Averages for the 2012 tax year for zip code 76086, filed in 2013:
Average Adjusted Gross Income (AGI) in 2012: $49,698 (Individual Income Tax Returns) Here:
$49,698State:
$65,384
Salary/wage: $42,431 (reported on 82.2% of returns )Here:
$42,431State:
$52,524
(% of AGI for various income ranges: 75.4% for AGIs below $25k , 78.8% for AGIs $25k-50k , 77.6% for AGIs $50k-75k , 78.2% for AGIs $75k-100k , 72.5% for AGIs $100k-200k , 40.8% for AGIs over 200k ) Taxable interest for individuals: $2,469 (reported on 23.9% of returns )This zip code:
$2,469Texas:
$2,372
(% of AGI for various income ranges: 1.2% for AGIs below $25k , 0.7% for AGIs $25k-50k , 1.0% for AGIs $50k-75k , 0.5% for AGIs $75k-100k , 1.2% for AGIs $100k-200k , 2.4% for AGIs over 200k ) Ordinary dividends: $5,293 (reported on 11.8% of returns )(% of AGI for various income ranges: 1.0% for AGIs below $25k , 0.5% for AGIs $25k-50k , 0.8% for AGIs $50k-75k , 0.6% for AGIs $75k-100k , 1.1% for AGIs $100k-200k , 3.4% for AGIs over 200k ) Net capital gain/loss in AGI: +$13,566 (reported on 11.0% of returns )Here:
+$13,566State:
+$35,319
(% of AGI for various income ranges: 0.3% for AGIs $25k-50k , 1.0% for AGIs $50k-75k , 1.1% for AGIs $75k-100k , 2.0% for AGIs $100k-200k , 12.4% for AGIs over 200k ) Profit/loss from business: +$12,209 (reported on 19.0% of returns )Here:
+$12,209State:
+$13,732
(% of AGI for various income ranges: 9.6% for AGIs below $25k , 4.0% for AGIs $25k-50k , 3.4% for AGIs $50k-75k , 3.6% for AGIs $75k-100k , 4.7% for AGIs $100k-200k , 4.6% for AGIs over 200k ) Taxable individual retirement arrangement distribution: $12,927 (reported on 9.0% of returns )76086:
$12,927Texas:
$19,511
(% of AGI for various income ranges: 2.2% for AGIs below $25k , 2.0% for AGIs $25k-50k , 2.0% for AGIs $50k-75k , 2.1% for AGIs $75k-100k , 2.8% for AGIs $100k-200k , 2.9% for AGIs over 200k ) Self-employment retirement plans: $17,750 (reported on 0.2% of returns )76086:
$17,750Texas:
$23,938
Total itemized deductions: $20,383 (21% of AGI, reported on 22.5% of returns )Here:
$20,383State:
$24,724
Here:
20.6% of AGIState:
15.9% of AGI
(% of AGI for various income ranges: 8.1% for AGIs below $25k , 8.4% for AGIs $25k-50k , 10.1% for AGIs $50k-75k , 9.9% for AGIs $75k-100k , 10.7% for AGIs $100k-200k , 7.7% for AGIs over 200k ) Charity contributions: $5,216 (reported on 16.3% of returns )(% of AGI for various income ranges: 0.9% for AGIs below $25k , 1.1% for AGIs $25k-50k , 1.3% for AGIs $50k-75k , 1.9% for AGIs $75k-100k , 2.4% for AGIs $100k-200k , 2.3% for AGIs over 200k ) Taxes paid: $4,867 (reported on 22.0% of returns )(% of AGI for various income ranges: 1.4% for AGIs below $25k , 1.7% for AGIs $25k-50k , 2.2% for AGIs $50k-75k , 2.2% for AGIs $75k-100k , 3.0% for AGIs $100k-200k , 2.0% for AGIs over 200k ) Earned income credit: $2,382 (reported on 20.8% of returns )(% of AGI for various income ranges: 7.1% for AGIs below $25k , 1.3% for AGIs $25k-50k ) Percentage of individuals using paid preparers for their 2012 taxes: 51.6%(% for various income ranges: 46.2% for AGIs below $25k , 50.0% for AGIs $25k-50k , 54.1% for AGIs $50k-75k , 59.5% for AGIs $75k-100k , 63.9% for AGIs $100k-200k , 88.2% for AGIs over 200k )
Averages for the 2004 tax year for zip code 76086, filed in 2005:
Average Adjusted Gross Income (AGI) in 2004: $40,347 (Individual Income Tax Returns) Here:
$40,347State:
$47,881
Salary/wage: $35,803 (reported on 81.1% of returns )Here:
$35,803State:
$41,947
(% of AGI for various income ranges: 156.7% for AGIs below $10k , 77.5% for AGIs $10k-25k , 79.0% for AGIs $25k-50k , 79.8% for AGIs $50k-75k , 78.5% for AGIs $75k-100k , 51.1% for AGIs over 100k ) Taxable interest for individuals: $3,170 (reported on 34.3% of returns )This zip code:
$3,170Texas:
$2,255
(% of AGI for various income ranges: 11.9% for AGIs below $10k , 2.1% for AGIs $10k-25k , 1.7% for AGIs $25k-50k , 1.7% for AGIs $50k-75k , 1.8% for AGIs $75k-100k , 4.5% for AGIs over 100k ) Taxable dividends: $2,532 (reported on 16.0% of returns )(% of AGI for various income ranges: 4.9% for AGIs below $10k , 0.8% for AGIs $10k-25k , 0.5% for AGIs $25k-50k , 0.6% for AGIs $50k-75k , 0.6% for AGIs $75k-100k , 1.8% for AGIs over 100k ) Net capital gain/loss: +$13,317 (reported on 14.8% of returns )Here:
+$13,317State:
+$16,110
(% of AGI for various income ranges: -0.5% for AGIs below $10k , -0.1% for AGIs $10k-25k , 0.5% for AGIs $25k-50k , 0.9% for AGIs $50k-75k , 1.5% for AGIs $75k-100k , 15.3% for AGIs over 100k ) Profit/loss from business: +$9,099 (reported on 20.1% of returns )Here:
+$9,099State:
+$11,013
(% of AGI for various income ranges: 16.9% for AGIs below $10k , 6.9% for AGIs $10k-25k , 4.0% for AGIs $25k-50k , 4.2% for AGIs $50k-75k , 2.7% for AGIs $75k-100k , 4.6% for AGIs over 100k ) IRA payment deduction: $2,763 (reported on 2.1% of returns )(% of AGI for various income ranges: 0.2% for AGIs $10k-25k , 0.2% for AGIs $25k-50k , 0.1% for AGIs $50k-75k , 0.2% for AGIs $75k-100k , 0.1% for AGIs over 100k ) Self-employed pension: $11,814 (reported on 0.5% of returns )Here:
$11,814Texas:
$16,401
Total itemized deductions: $17,284 (23% of AGI, reported on 24.2% of returns )Here:
$17,284State:
$19,631
Here:
23.2% of AGIState:
18.9% of AGI
(% of AGI for various income ranges: 22.7% for AGIs below $10k , 8.1% for AGIs $10k-25k , 9.0% for AGIs $25k-50k , 10.9% for AGIs $50k-75k , 11.0% for AGIs $75k-100k , 11.0% for AGIs over 100k ) Charity contributions deductions: $5,485 (7% of AGI, reported on 19.2% of returns )Here:
6.9% of AGIState:
4.2% of AGI
(% of AGI for various income ranges: 1.6% for AGIs below $10k , 1.0% for AGIs $10k-25k , 1.5% for AGIs $25k-50k , 2.0% for AGIs $50k-75k , 2.6% for AGIs $75k-100k , 4.6% for AGIs over 100k ) Total tax: $6,044 (reported on 73.2% of returns )(% of AGI for various income ranges: 6.5% for AGIs below $10k , 4.2% for AGIs $10k-25k , 6.9% for AGIs $25k-50k , 9.2% for AGIs $50k-75k , 11.2% for AGIs $75k-100k , 18.3% for AGIs over 100k ) Earned income credit: $1,860 (reported on 19.3% of returns )Percentage of individuals using paid preparers for their 2004 taxes: 57.5%(% for various income ranges: 51.1% for AGIs below $10k , 60.4% for AGIs $10k-25k , 57.0% for AGIs $25k-50k , 57.1% for AGIs $50k-75k , 59.5% for AGIs $75k-100k , 67.7% for AGIs over 100k )
Estimated median household income in 2022: This zip code:
$65,031Texas:
$72,284
Nearest zip codes: 76087 ,
76085 ,
76088 ,
76008 ,
76066 ,
76082 .
Weatherford Zip Code Map
Percentage of family households: This zip code:
44.0%Texas:
50.5%
Percentage of households with unmarried partners: This zip code:
6.5%Texas:
48.7%
Likely homosexual households (counted as self-reported same-sex unmarried-partner households)
Lesbian couples: 0.2% of all households Gay men: 0.0% of all households
Household received Food Stamps/SNAP in the past 12 months: 655Household did not receive Food Stamps/SNAP in the past 12 months: 8,226
Women who had a birth in the past 12 months: 311 (187 now married , 122 unmarried) Women who did not have a birth in the past 12 months: 4,967 (2,396 now married , 2,564 unmarried)
Housing units in zip code 76086 with a mortgage: 2,777 (76
second mortgage , 28
home equity loan , 36
both second mortgage and home equity loan )
Houses without a mortgage: 53
Median monthly owner costs for units with a mortgage: $1,654
Median monthly owner costs for units without a mortgage: $623
Residents with income below the poverty level in 2022:
This zip code:
11.9%Whole state:
14.0%
Residents with income below 50% of the poverty level in 2022:
This zip code:
7.8%Whole state:
7.4%
Median number of rooms in houses and condos: Median number of rooms in apartments: Notable locations in this zip code not listed on our city pages
Click to draw/clear zip code borders Notable locations in zip code 76086: (A) , Weatherford Downtown Historic District (B) , Holland Lake Park (C) , Parker County Courthouse (D) , Parker County Fire Marshal's Office (E) , Weatherford Fire Department Station 1 (F) , Parker County Museum and Trading Post (G) , Weatherford Fire Department Station 3 (H) , Life Care Emergency Medical Services (I) , The Double Log Cabin (J) . Display/hide their locations on the map
Churches in zip code 76086 include: (A) , Church of Christ (B) , Church of Christ - Spanish Ministries (C) , Church of Christ - South Main (D) , Church of Christ (E) , Victory Baptist Church (F) , Santa Fe Drive Baptist Church (G) , North Side Baptist Church (H) , New Hope Baptist Church (I) . Display/hide their locations on the map
Cemeteries: (1) , Curtis Cemetery (2) , Hill Crest Cemetery (3) . Display/hide their locations on the map
Reservoirs: (A) , Soil Conservation Service Site 29 Reservoir (B) . Display/hide their locations on the map
Streams, rivers, and creeks: (A) , Black Warrior Branch (B) . Display/hide their locations on the map
Parks in zip code 76086 include: (1) , Soldier Springs Park (2) , McGratton Park (3) , Chandor Gardens (4) , Kangaroo Stadium (5) , Cherry Park (6) . Display/hide their locations on the map
Year house built (houses)
75 2020 or later1,217 2010 to 20191,723 2000 to 20091,019 1990 to 19991,022 1980 to 19891,215 1970 to 19791,067 1960 to 1969866 1950 to 1959360 1940 to 1949691 1939 or earlier
Zip code 76086 household income distribution in 2022 505 Less than $10,000519 $10,000 to $14,999460 $15,000 to $19,999247 $20,000 to $24,999186 $25,000 to $29,999644 $30,000 to $34,999456 $35,000 to $39,999473 $40,000 to $44,999299 $45,000 to $49,999408 $50,000 to $59,9991,094 $60,000 to $74,9991,365 $75,000 to $99,999842 $100,000 to $124,999379 $125,000 to $149,999616 $150,000 to $199,999443 $200,000 or moreEstimate of home value of owner-occupied houses/condos in 2022 in zip code 76086 14 Less than $10,00029 $15,000 to $19,99949 $20,000 to $24,99944 $35,000 to $39,99937 $40,000 to $49,99990 $50,000 to $59,99955 $60,000 to $69,99928 $70,000 to $79,999141 $80,000 to $89,99994 $90,000 to $99,999292 $100,000 to $124,999299 $125,000 to $149,999286 $150,000 to $174,999353 $175,000 to $199,999823 $200,000 to $249,999604 $250,000 to $299,999747 $300,000 to $399,999262 $400,000 to $499,99945 $500,000 to $749,9999 $1,000,000 to $1,499,999Rent paid by renters in 2022 in zip code 76086 44 $100 to $14935 $150 to $19954 $200 to $24912 $250 to $29966 $300 to $34915 $350 to $399107 $400 to $44910 $450 to $49945 $500 to $54982 $550 to $59942 $600 to $64962 $650 to $69928 $700 to $74967 $750 to $799287 $800 to $899446 $900 to $9991,177 $1,000 to $1,249567 $1,250 to $1,499573 $1,500 to $1,99945 $2,000 to $2,499152 $3,500 or more179 No cash rent
Median gross rent in 2022: $1,351.
Median price asked for vacant for-sale houses and condos in 2022: $181,122.
Estimated median house (or condo) value in 2022 for: White Non-Hispanic householders: $242,793Black or African American householders: $160,495American Indian or Alaska Native householders: $137,944Asian householders: $274,716Some other race householders: $197,690Two or more races householders: $457,763Hispanic or Latino householders: $173,381Estimated median house or condo value in 2022: $236,057
76086:
$236,057Texas:
$275,400
Lower value quartile - upper value quartile: $152,889 - $315,413
Mean price in 2022: Detached houses: $240,951Here:
$240,951State:
$369,058
Townhouses or other attached units: $142,988Here:
$142,988State:
$327,631
Mobile homes: $109,677Here:
$109,677State:
$124,413
Housing units in structures:
One, detached: 6,267One, attached: 473Two: 1883 or 4: 8785 to 9: 40910 to 19: 36820 to 49: 19250 or more: 649Mobile homes: 223Unemployment : 3.4%
Means of transportation to work in zip code 76086 74.8% 8,269 Drove a car alone9.8% 1,087 Carpooled0.7% 81 Bus or trolley bus1.9% 213 Walked1.6% 172 Other means9.8% 1,084 Worked at homeTravel time to work (commute) in zip code 76086 331 Less than 5 minutes1,940 5 to 9 minutes1,442 10 to 14 minutes1,171 15 to 19 minutes653 20 to 24 minutes363 25 to 29 minutes1,188 30 to 34 minutes409 35 to 39 minutes399 40 to 44 minutes861 45 to 59 minutes867 60 to 89 minutes195 90 or more minutes
Percentage of zip code residents living and working in this county: 67.6%
Household type by relationship:
Households: 22,569
Male householders: 4,060 (1,700 living alone ), Female householders: 4,849 (1,898 living alone )3,619 spouses (3,577 opposite-sex spouses ), 488 unmarried partners , (478 opposite-sex unmarried partners ), 5,689 children (5,223 natural , 311 adopted , 157 stepchildren ), 792 grandchildren , 223 brothers or sisters , 215 parents , 0 foster children , 469 other relatives , 762 non-relatives In group quarters: 1,399 (-1 institutionalized population )
Size of family households: 2,282 2-persons , 930 3-persons , 877 4-persons , 515 5-persons , 237 6-persons , 173 7-or-more-persons
Size of nonfamily households: 3,597 1-person , 302 2-persons , 5 3-persons , 24 4-persons
3,100 married couples with children. single-parent households (259 men , 854 women ).
87.6% of residents of 76086 zip code speak English at home. of residents speak Spanish at home (70% very well, 11% well, 14% not well, 5% not at all ).of residents speak other Indo-European language at home (100% very well ).of residents speak Asian or Pacific Island language at home (93% very well, 7% not well ).of residents speak other language at home (38% well, 62% not well ).
Foreign born population: 1,400 (6.2%)
(46.4%
of them are naturalized citizens )
This zip code:
6.2%Whole state:
17.2%
56% Honduras 12% Barbados 7% Thailand 4% Japan 3% Malaysia 2% Belgium 2% El Salvador 14% English 11% American 10% Irish 9% German 4% European 2% Italian 1% Scotch-Irish
Year of entry for the foreign-born population
546 2010 or later 140 2000 to 2009 371 1990 to 1999 631 Before 1990
Facilities with environmental interests located in this zip code:
AUSTIN EL (1776 TEXAS DR in WEATHERFORD, TX)
(National Center for Education Statistics) - STATE ID-184903106 Organizations: WEATHERFORD ISD (SCHOOL DISTRICT)
A. J. LAMBERT OIL CO. INC. BULK STORAGE (133 W WATER ST in WEATHERFORD, TX)
(Integrated Compliance Information System) - ICIS-06-2000-0545, FORMAL ENFORCEMENT ACTION, ICIS-06-2000-0793, Business SIC classification: PETROLEUM BULK STATIONS AND TERMINALS
ANTELOPE OIL TOOL AND MANUFACTURING COMPANY (1400 GREENWOOD ROAD in WEATHERFORD, TX)
AIR MINOR (AIRS/AFS) Business SIC classification: FABRICATED METAL PRODUCTS
B AND N GARAGE (200 W FOURTH ST in WEATHERFORD, TX)
TRANSPORTER (Resource Conservation and Recovery Act (tracking hazardous waste)) - notification
Housing units lacking complete plumbing facilities: 2.7%
Housing units lacking complete kitchen facilities: 4.9%
65.3% Electricity 29.7% Utility gas 2.5% No fuel used 2.1% Bottled, tank, or LP gas
Population in 1990: 29,937.
Place of birth for U.S.-born residents:
This state: 15,399Northeast: 418Midwest: 1,289South: 1,643West: 2,086
48% of the 76086 zip code residents lived in the same house 5 years ago.
Out of people who lived in different houses, 44% lived in this county.
Out of people who lived in different counties, 50% lived in Texas.
85% of the 76086 zip code residents lived in the same house 1 year ago.
Out of people who lived in different houses, 35% moved from this county.
Out of people who lived in different houses, 51% moved from different county within same state.
Out of people who lived in different houses, 12% moved from different state.
Out of people who lived in different houses, 4% moved from abroad.
Private vs. public school enrollment:
Students in private schools in grades 1 to 8 (elementary and middle school): 195
Students in private schools in grades 9 to 12 (high school): 193
Students in private undergraduate colleges: 224
Occupation by median earnings in the past 12 months ($)
91,124 Computer and mathematical occupations 86,240 Life, physical, and social science occupations 78,716 Health diagnosing and treating practitioners and other technical occupations 66,832 Architecture and engineering occupations 62,595 Community and social service occupations 61,298 Law enforcement workers including supervisors
Companies with federal contracts located in this zip code (WEATHERFORD, TX):
JORDAN WELDON C & BILL CNSTR, (1516 FORT WORTH HWY; small business)
$45,940 with Army for Construction of Structures and Facilities -- Other Non-Building Facilities. Signed on 2000-08-15. Completion date: 2000-10-31.
CJ HOME AND OFFICE (100 AUSTIN AVE, STE 207; small business) in 3 contracts from 2004 to 2005
$28,949 with Army for Office Furniture. Signed on 2005-06-22. Completion date: 2005-07-05.
with Air Force for Cabinets, Lockers, Bins, and Shelving. Taking place in NE. Signed on 2004-05-26. Completion date: 2004-06-18.
with Defense Logistics Agency for Miscellaneous Items. Taking place in VA. Signed on 2005-02-04. Completion date: 2005-02-23.
K A A COMPANY (1309 MADISON ST; small business) in 2 contracts from 2004 to 2005
$3,492 with Defense Logistics Agency for Hardware, Commercial. Signed on 2005-05-04. Completion date: 2005-08-03.
, same as above. Signed on 2004-11-18. Completion date: 2005-01-18.
SCHRICK TRAILER SALES, LTD (1624 FORT WORTH HWY; small business)
$3,620 with Army for Trailers. Signed on 2003-05-21. Completion date: 2003-06-04.
H & T RIDDLE INC (815 FORT WORTH ST; small business) in 2 contracts in 2006
$5,700 with Army for Miscellaneous Construction Equipment. Signed on 2006-02-08. Completion date: 2006-02-24.
, same as above. Signed on 2006-03-13. Completion date: 2006-02-24.
Top industries in this zip code by the number of employees in 2005:
Health Care and Social Assistance: General Medical and Surgical Hospitals (500-999 employees: 1 establishment)Accommodation and Food Services: Limited-Service Restaurants (50-99: 1, 20-49: 13, 10-19: 7, 5-9: 7, 1-4: 3)Accommodation and Food Services: Full-Service Restaurants (50-99: 2, 20-49: 7, 10-19: 5, 5-9: 2, 1-4: 5)Health Care and Social Assistance: Nursing Care Facilities (100-249: 1, 50-99: 2, 20-49: 3)Other Services (except Public Administration): Religious Organizations (50-99: 2, 20-49: 2, 10-19: 3, 5-9: 6, 1-4: 12)
People in group quarters in 2010:
380 people in local jails and other municipal confinement facilities
367 people in nursing facilities/skilled-nursing facilities
214 people in college/university student housing
15 people in group homes for juveniles (non-correctional)
11 people in workers' group living quarters and job corps centers
7 people in group homes intended for adults
People in group quarters in 2000:
411 people in nursing homes
167 people in college dormitories (includes college quarters off campus)
153 people in local jails and other confinement facilities (including police lockups)
31 people in unknown juvenile institutions
24 people in other noninstitutional group quarters
11 people in homes for the mentally retarded
Fatal accident statistics in 2014:
Fatal accident count: 1Vehicles involved in fatal accidents: 1Fatal accidents caused by drunken drivers: 1Fatalities: 1Persons involved in fatal accidents: 2Pedestrians involved in fatal accidents: 0
Fatal accident statistics in 2013:
Fatal accident count: 1Vehicles involved in fatal accidents: 1Fatal accidents caused by drunken drivers: 0Fatalities: 1Persons involved in fatal accidents: 2Pedestrians involved in fatal accidents: 0
Home Mortgage Disclosure Act Aggregated Statistics For Year 2009(Based on 4 full and 8 partial tracts) A) FHA, FSA/RHS & VA B) Conventional C) Refinancings D) Home Improvement Loans E) Loans on Dwellings For 5+ Families F) Non-occupant Loans on G) Loans On Manufactured Number Average Value Number Average Value Number Average Value Number Average Value Number Average Value Number Average Value Number Average Value
LOANS ORIGINATED 324 $134,606 255 $122,405 563 $160,355 61 $57,403 2 $5,866,575 104 $76,300 49 $59,360 APPLICATIONS APPROVED, NOT ACCEPTED 12 $122,016 16 $109,444 62 $144,094 15 $55,130 0 $0 6 $101,217 9 $76,919 APPLICATIONS DENIED 57 $105,376 71 $102,391 263 $146,466 94 $29,791 0 $0 26 $96,151 37 $53,838 APPLICATIONS WITHDRAWN 27 $109,071 27 $124,072 179 $148,864 19 $53,817 0 $0 16 $115,369 12 $70,046 FILES CLOSED FOR INCOMPLETENESS 6 $97,562 6 $196,997 38 $94,561 6 $26,570 0 $0 4 $59,725 8 $62,919
Aggregated Statistics For Year 2008(Based on 4 full and 8 partial tracts) A) FHA, FSA/RHS & VA B) Conventional C) Refinancings D) Home Improvement Loans E) Loans on Dwellings For 5+ Families F) Non-occupant Loans on G) Loans On Manufactured Number Average Value Number Average Value Number Average Value Number Average Value Number Average Value Number Average Value Number Average Value
LOANS ORIGINATED 371 $129,924 459 $140,031 386 $134,716 118 $46,858 3 $522,270 128 $116,438 81 $84,535 APPLICATIONS APPROVED, NOT ACCEPTED 26 $135,575 66 $118,977 64 $123,498 34 $45,841 0 $0 15 $124,670 28 $77,124 APPLICATIONS DENIED 63 $110,078 93 $99,601 310 $119,670 161 $47,926 2 $2,790,760 34 $109,945 60 $53,807 APPLICATIONS WITHDRAWN 35 $117,511 50 $161,011 140 $133,988 10 $61,913 0 $0 12 $104,872 10 $81,809 FILES CLOSED FOR INCOMPLETENESS 15 $110,155 13 $211,179 42 $157,892 4 $13,500 4 $2,379,072 8 $91,925 5 $67,246
Aggregated Statistics For Year 2007(Based on 4 full and 8 partial tracts) A) FHA, FSA/RHS & VA B) Conventional C) Refinancings D) Home Improvement Loans E) Loans on Dwellings For 5+ Families F) Non-occupant Loans on G) Loans On Manufactured Number Average Value Number Average Value Number Average Value Number Average Value Number Average Value Number Average Value Number Average Value
LOANS ORIGINATED 239 $121,062 994 $137,737 415 $135,521 208 $32,239 2 $623,460 292 $134,994 130 $89,419 APPLICATIONS APPROVED, NOT ACCEPTED 13 $115,042 100 $115,690 81 $122,072 31 $33,890 0 $0 32 $105,667 29 $59,480 APPLICATIONS DENIED 52 $102,397 271 $125,782 530 $123,816 185 $48,387 2 $4,544,950 131 $132,827 75 $53,615 APPLICATIONS WITHDRAWN 14 $119,698 111 $138,135 270 $117,258 25 $57,744 2 $882,080 48 $138,536 11 $96,435 FILES CLOSED FOR INCOMPLETENESS 10 $135,438 27 $123,696 89 $143,489 7 $15,989 0 $0 2 $55,815 5 $111,066
Aggregated Statistics For Year 2006(Based on 4 full and 8 partial tracts) A) FHA, FSA/RHS & VA B) Conventional C) Refinancings D) Home Improvement Loans E) Loans on Dwellings For 5+ Families F) Non-occupant Loans on G) Loans On Manufactured Number Average Value Number Average Value Number Average Value Number Average Value Number Average Value Number Average Value Number Average Value
LOANS ORIGINATED 197 $111,001 1,137 $105,602 501 $123,568 154 $42,702 5 $307,736 261 $79,782 99 $76,673 APPLICATIONS APPROVED, NOT ACCEPTED 13 $76,870 170 $86,645 84 $115,091 36 $60,928 0 $0 55 $72,360 32 $54,707 APPLICATIONS DENIED 34 $120,844 333 $103,841 477 $113,037 148 $40,374 0 $0 101 $106,258 78 $56,122 APPLICATIONS WITHDRAWN 15 $87,798 147 $93,810 312 $104,193 20 $33,580 0 $0 26 $78,617 12 $68,248 FILES CLOSED FOR INCOMPLETENESS 3 $100,880 29 $106,772 133 $120,963 7 $54,736 0 $0 11 $103,684 1 $101,590
Aggregated Statistics For Year 2005(Based on 4 full and 8 partial tracts) A) FHA, FSA/RHS & VA B) Conventional C) Refinancings D) Home Improvement Loans E) Loans on Dwellings For 5+ Families F) Non-occupant Loans on G) Loans On Manufactured Number Average Value Number Average Value Number Average Value Number Average Value Number Average Value Number Average Value Number Average Value
LOANS ORIGINATED 210 $102,569 1,159 $100,685 649 $115,100 184 $54,447 8 $1,372,455 261 $88,896 130 $76,454 APPLICATIONS APPROVED, NOT ACCEPTED 8 $115,545 125 $76,868 113 $120,298 33 $35,406 0 $0 18 $120,082 37 $50,749 APPLICATIONS DENIED 36 $90,043 293 $76,440 551 $104,628 181 $38,999 2 $560,250 92 $68,062 149 $54,873 APPLICATIONS WITHDRAWN 28 $99,061 137 $111,845 426 $118,200 67 $185,951 0 $0 29 $92,918 18 $81,484 FILES CLOSED FOR INCOMPLETENESS 6 $110,410 42 $99,102 114 $124,496 8 $74,030 0 $0 15 $77,987 3 $99,520
Aggregated Statistics For Year 2004(Based on 4 full and 8 partial tracts) A) FHA, FSA/RHS & VA B) Conventional C) Refinancings D) Home Improvement Loans E) Loans on Dwellings For 5+ Families F) Non-occupant Loans on G) Loans On Manufactured Number Average Value Number Average Value Number Average Value Number Average Value Number Average Value Number Average Value Number Average Value
LOANS ORIGINATED 226 $103,548 868 $96,720 780 $106,201 147 $42,792 8 $3,064,275 209 $71,748 139 $67,635 APPLICATIONS APPROVED, NOT ACCEPTED 12 $91,460 135 $89,494 135 $103,572 21 $33,442 0 $0 23 $82,770 75 $55,825 APPLICATIONS DENIED 37 $102,999 376 $71,817 646 $98,189 136 $31,761 0 $0 108 $77,430 240 $52,146 APPLICATIONS WITHDRAWN 25 $91,168 138 $100,428 390 $103,176 30 $72,867 0 $0 40 $106,199 24 $70,266 FILES CLOSED FOR INCOMPLETENESS 6 $117,503 24 $87,350 136 $116,531 8 $75,155 0 $0 6 $36,667 2 $119,895
Aggregated Statistics For Year 2003(Based on 4 full and 8 partial tracts) A) FHA, FSA/RHS & VA B) Conventional C) Refinancings D) Home Improvement Loans E) Loans on Dwellings For 5+ Families F) Non-occupant Loans on Number Average Value Number Average Value Number Average Value Number Average Value Number Average Value Number Average Value
LOANS ORIGINATED 159 $100,969 788 $91,691 1,353 $107,706 159 $26,520 7 $3,436,103 259 $75,319 APPLICATIONS APPROVED, NOT ACCEPTED 7 $69,251 98 $91,745 211 $100,713 31 $34,596 0 $0 45 $111,308 APPLICATIONS DENIED 22 $83,949 289 $79,753 671 $88,860 122 $27,789 2 $479,850 76 $117,832 APPLICATIONS WITHDRAWN 17 $103,084 101 $100,561 416 $97,908 9 $35,772 0 $0 40 $89,260 FILES CLOSED FOR INCOMPLETENESS 4 $82,250 38 $107,583 71 $89,335 11 $59,105 0 $0 9 $37,072
Aggregated Statistics For Year 2002(Based on 4 full and 2 partial tracts) A) FHA, FSA/RHS & VA B) Conventional C) Refinancings D) Home Improvement Loans F) Non-occupant Loans on Number Average Value Number Average Value Number Average Value Number Average Value Number Average Value
LOANS ORIGINATED 145 $99,099 508 $77,453 548 $85,211 93 $25,308 159 $94,858 APPLICATIONS APPROVED, NOT ACCEPTED 11 $82,398 60 $89,256 55 $66,572 15 $23,435 11 $68,244 APPLICATIONS DENIED 16 $93,652 137 $68,229 234 $72,069 64 $23,116 49 $86,798 APPLICATIONS WITHDRAWN 18 $93,171 68 $118,900 164 $72,212 10 $13,887 27 $121,700 FILES CLOSED FOR INCOMPLETENESS 5 $84,652 38 $87,859 32 $80,597 4 $34,330 15 $77,670
Aggregated Statistics For Year 2001(Based on 4 full and 2 partial tracts) A) FHA, FSA/RHS & VA B) Conventional C) Refinancings D) Home Improvement Loans E) Loans on Dwellings For 5+ Families F) Non-occupant Loans on Number Average Value Number Average Value Number Average Value Number Average Value Number Average Value Number Average Value
LOANS ORIGINATED 197 $87,320 438 $75,159 382 $82,163 97 $19,220 2 $1,519,965 103 $59,409 APPLICATIONS APPROVED, NOT ACCEPTED 17 $111,459 68 $59,919 39 $56,733 17 $27,544 0 $0 16 $55,091 APPLICATIONS DENIED 19 $79,731 170 $64,335 167 $71,279 47 $19,256 2 $153,550 31 $76,910 APPLICATIONS WITHDRAWN 12 $93,705 39 $86,331 129 $80,402 14 $44,795 0 $0 9 $55,401 FILES CLOSED FOR INCOMPLETENESS 4 $75,290 30 $53,567 26 $70,716 0 $0 0 $0 0 $0
Aggregated Statistics For Year 2000(Based on 4 full and 2 partial tracts) A) FHA, FSA/RHS & VA B) Conventional C) Refinancings D) Home Improvement Loans E) Loans on Dwellings For 5+ Families F) Non-occupant Loans on Number Average Value Number Average Value Number Average Value Number Average Value Number Average Value Number Average Value
LOANS ORIGINATED 150 $80,475 430 $77,488 148 $63,704 111 $18,609 2 $91,695 118 $49,146 APPLICATIONS APPROVED, NOT ACCEPTED 12 $82,322 105 $51,757 37 $78,957 19 $14,587 0 $0 5 $66,820 APPLICATIONS DENIED 22 $72,929 263 $51,582 98 $53,985 66 $11,200 0 $0 20 $57,962 APPLICATIONS WITHDRAWN 28 $74,731 53 $75,038 50 $58,442 7 $56,497 0 $0 7 $44,413 FILES CLOSED FOR INCOMPLETENESS 2 $60,800 18 $74,492 28 $73,305 0 $0 0 $0 5 $52,868
Aggregated Statistics For Year 1999(Based on 2 full and 3 partial tracts) A) FHA, FSA/RHS & VA B) Conventional C) Refinancings D) Home Improvement Loans E) Loans on Dwellings For 5+ Families F) Non-occupant Loans on Number Average Value Number Average Value Number Average Value Number Average Value Number Average Value Number Average Value
LOANS ORIGINATED 102 $76,963 392 $70,708 205 $76,814 81 $19,985 2 $952,740 86 $57,804 APPLICATIONS APPROVED, NOT ACCEPTED 2 $91,005 121 $56,762 60 $75,511 23 $16,044 0 $0 10 $37,158 APPLICATIONS DENIED 11 $80,838 441 $60,160 110 $81,671 79 $12,569 0 $0 34 $79,532 APPLICATIONS WITHDRAWN 7 $86,411 47 $90,725 81 $74,461 5 $16,228 0 $0 6 $75,807 FILES CLOSED FOR INCOMPLETENESS 1 $50,430 12 $68,032 29 $87,833 2 $28,080 0 $0 5 $64,856
Private Mortgage Insurance Companies Aggregated Statistics For Year 2009(Based on 4 full and 8 partial tracts) A) Conventional B) Refinancings C) Non-occupant Loans on Number Average Value Number Average Value Number Average Value
LOANS ORIGINATED 45 $183,872 26 $210,388 0 $0 APPLICATIONS APPROVED, NOT ACCEPTED 12 $190,984 11 $207,382 0 $0 APPLICATIONS DENIED 9 $192,626 4 $186,940 0 $0 APPLICATIONS WITHDRAWN 4 $147,598 5 $276,824 0 $0 FILES CLOSED FOR INCOMPLETENESS 1 $238,270 3 $81,700 2 $56,810
Aggregated Statistics For Year 2008(Based on 4 full and 8 partial tracts) A) Conventional B) Refinancings C) Non-occupant Loans on D) Loans On Manufactured Number Average Value Number Average Value Number Average Value Number Average Value
LOANS ORIGINATED 156 $163,784 44 $170,604 24 $123,195 0 $0 APPLICATIONS APPROVED, NOT ACCEPTED 46 $170,262 31 $155,138 7 $81,967 0 $0 APPLICATIONS DENIED 5 $142,160 6 $232,515 5 $207,818 1 $51,690 APPLICATIONS WITHDRAWN 12 $135,531 1 $171,810 0 $0 0 $0 FILES CLOSED FOR INCOMPLETENESS 3 $92,807 2 $203,685 3 $113,903 0 $0
Aggregated Statistics For Year 2007(Based on 4 full and 8 partial tracts) A) Conventional B) Refinancings C) Non-occupant Loans on D) Loans On Manufactured Number Average Value Number Average Value Number Average Value Number Average Value
LOANS ORIGINATED 300 $136,624 32 $140,497 44 $91,669 2 $70,790 APPLICATIONS APPROVED, NOT ACCEPTED 37 $146,888 5 $268,894 6 $65,970 0 $0 APPLICATIONS DENIED 0 $0 2 $100,400 0 $0 0 $0 APPLICATIONS WITHDRAWN 19 $194,338 2 $175,635 0 $0 0 $0 FILES CLOSED FOR INCOMPLETENESS 4 $92,610 0 $0 0 $0 0 $0
Aggregated Statistics For Year 2006(Based on 4 full and 8 partial tracts) A) Conventional B) Refinancings C) Non-occupant Loans on D) Loans On Manufactured Number Average Value Number Average Value Number Average Value Number Average Value
LOANS ORIGINATED 199 $127,954 27 $152,227 39 $102,894 2 $56,965 APPLICATIONS APPROVED, NOT ACCEPTED 18 $169,839 14 $204,152 1 $194,870 1 $24,950 APPLICATIONS DENIED 0 $0 2 $71,020 2 $71,020 0 $0 APPLICATIONS WITHDRAWN 8 $165,841 3 $130,463 2 $67,180 0 $0 FILES CLOSED FOR INCOMPLETENESS 0 $0 0 $0 0 $0 0 $0
Aggregated Statistics For Year 2005(Based on 4 full and 8 partial tracts) A) Conventional B) Refinancings C) Non-occupant Loans on D) Loans On Manufactured Number Average Value Number Average Value Number Average Value Number Average Value
LOANS ORIGINATED 180 $108,502 56 $167,067 29 $73,954 6 $76,835 APPLICATIONS APPROVED, NOT ACCEPTED 25 $134,559 14 $180,041 0 $0 2 $35,415 APPLICATIONS DENIED 0 $0 0 $0 0 $0 0 $0 APPLICATIONS WITHDRAWN 10 $106,432 3 $232,310 2 $13,690 0 $0 FILES CLOSED FOR INCOMPLETENESS 1 $61,250 0 $0 0 $0 0 $0
Aggregated Statistics For Year 2004(Based on 4 full and 8 partial tracts) A) Conventional B) Refinancings C) Non-occupant Loans on D) Loans On Manufactured Number Average Value Number Average Value Number Average Value Number Average Value
LOANS ORIGINATED 192 $102,577 75 $122,209 36 $82,740 3 $88,227 APPLICATIONS APPROVED, NOT ACCEPTED 45 $87,267 35 $154,673 7 $56,527 2 $51,610 APPLICATIONS DENIED 0 $0 0 $0 0 $0 0 $0 APPLICATIONS WITHDRAWN 15 $122,739 11 $156,502 9 $154,351 1 $48,560 FILES CLOSED FOR INCOMPLETENESS 0 $0 1 $95,360 0 $0 1 $95,360
Aggregated Statistics For Year 2003(Based on 4 full and 8 partial tracts) A) Conventional B) Refinancings C) Non-occupant Loans on Number Average Value Number Average Value Number Average Value
LOANS ORIGINATED 261 $96,521 128 $128,394 49 $67,140 APPLICATIONS APPROVED, NOT ACCEPTED 36 $94,229 46 $139,157 16 $80,089 APPLICATIONS DENIED 6 $90,477 4 $146,828 4 $87,210 APPLICATIONS WITHDRAWN 10 $55,745 11 $94,123 7 $47,316 FILES CLOSED FOR INCOMPLETENESS 2 $65,575 2 $172,605 0 $0
Aggregated Statistics For Year 2002(Based on 4 full and 2 partial tracts) A) Conventional B) Refinancings C) Non-occupant Loans on Number Average Value Number Average Value Number Average Value
LOANS ORIGINATED 192 $89,781 51 $110,372 22 $80,903 APPLICATIONS APPROVED, NOT ACCEPTED 29 $132,495 4 $46,012 10 $154,489 APPLICATIONS DENIED 8 $108,322 4 $111,538 6 $135,552 APPLICATIONS WITHDRAWN 8 $72,062 4 $91,698 2 $100,770 FILES CLOSED FOR INCOMPLETENESS 4 $43,435 0 $0 2 $38,030
Aggregated Statistics For Year 2001(Based on 4 full and 2 partial tracts) A) Conventional B) Refinancings C) Non-occupant Loans on Number Average Value Number Average Value Number Average Value
LOANS ORIGINATED 144 $86,863 34 $116,770 20 $66,914 APPLICATIONS APPROVED, NOT ACCEPTED 11 $88,917 11 $100,055 0 $0 APPLICATIONS DENIED 5 $87,664 0 $0 0 $0 APPLICATIONS WITHDRAWN 0 $0 2 $95,010 0 $0 FILES CLOSED FOR INCOMPLETENESS 3 $111,447 2 $112,285 2 $21,295
Aggregated Statistics For Year 2000(Based on 4 full and 2 partial tracts) A) Conventional B) Refinancings C) Non-occupant Loans on Number Average Value Number Average Value Number Average Value
LOANS ORIGINATED 134 $87,955 9 $86,146 11 $59,687 APPLICATIONS APPROVED, NOT ACCEPTED 11 $84,720 4 $67,918 2 $67,775 APPLICATIONS DENIED 7 $104,240 0 $0 0 $0 APPLICATIONS WITHDRAWN 4 $94,482 0 $0 0 $0 FILES CLOSED FOR INCOMPLETENESS 7 $67,703 0 $0 0 $0
Aggregated Statistics For Year 1999(Based on 2 full and 3 partial tracts) A) Conventional B) Refinancings C) Non-occupant Loans on Number Average Value Number Average Value Number Average Value
LOANS ORIGINATED 71 $91,475 29 $105,526 7 $58,429 APPLICATIONS APPROVED, NOT ACCEPTED 9 $102,050 3 $123,873 0 $0 APPLICATIONS DENIED 6 $82,027 1 $303,700 2 $55,740 APPLICATIONS WITHDRAWN 3 $83,177 1 $58,540 0 $0 FILES CLOSED FOR INCOMPLETENESS 6 $88,855 1 $83,060 0 $0
2002 - 2018 National Fire Incident Reporting System (NFIRS) incidents See full 2006 National Fire Incident Reporting System statistics for zip code 76086, Texas
Most common first names in zip code 76086 among deceased individuals Name Count Lived (average)
Mary 208 79.5 years James 206 76.1 years William 200 77.2 years John 198 77.6 years Charles 104 74.0 years Robert 103 73.0 years George 91 78.8 years Ruby 59 82.3 years Willie 57 78.2 years Walter 56 75.5 years
Most common last names in zip code 76086 among deceased individuals Last name Count Lived (average)
Smith 97 78.3 years Jones 97 75.0 years Williams 59 78.3 years Davis 58 76.9 years Johnson 54 76.4 years Young 50 79.0 years Martin 49 75.3 years Walker 46 79.7 years Moore 46 77.2 years Jackson 45 75.5 years
Businesses in zip code 76086
Name Count Name Count
AT&T 2 Jack In The Box 2 Ace Hardware 1 KFC 1 Albertsons 1 Kohl's 1 Applebee's 1 La Quinta 1 Arby's 1 La-Z-Boy 1 AutoZone 1 Lane Furniture 1 Bed Bath & Beyond 1 Little Caesars Pizza 1 Best Western 1 Long John Silver's 1 Blockbuster 1 Marriott 1 CVS 1 McDonald's 1 Cinnabon 1 Motel 6 1 Circle K 1 Nike 2 Comfort Suites 1 OfficeMax 1 Cracker Barrel 1 Olive Garden 1 Dairy Queen 2 Payless 1 Dennys 1 Pizza Hut 1 Discount Tire 1 RadioShack 1 Domino's Pizza 1 Rue21 1 Famous Footwear 1 SONIC Drive-In 2 FedEx 8 Sears 1 Firestone Complete Auto Care 1 Starbucks 1 GNC 1 Super 8 1 GameStop 1 T-Mobile 2 Goodwill 2 Taco Bell 1 H&R Block 1 U-Haul 2 Home Depot 1 UPS 7 IHOP 1 Walmart 1 JCPenney 1 Wendy's 1
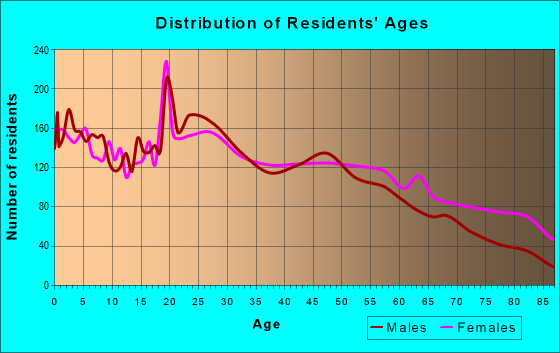
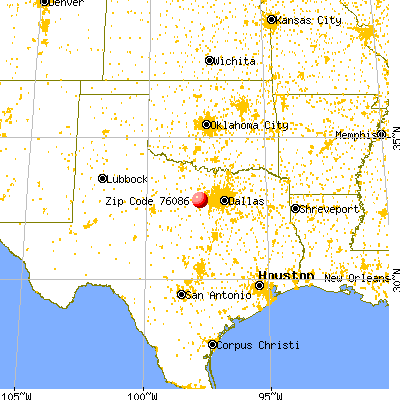


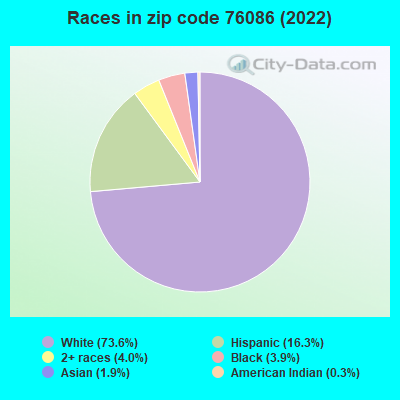


 Nearest zip codes: 76087, 76085, 76088, 76008, 76066, 76082.
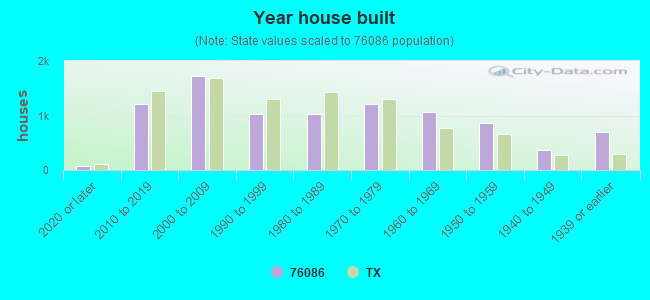

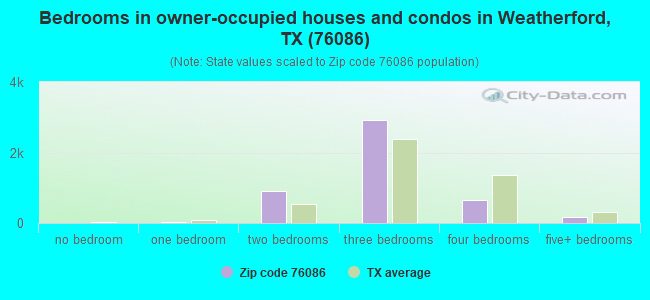
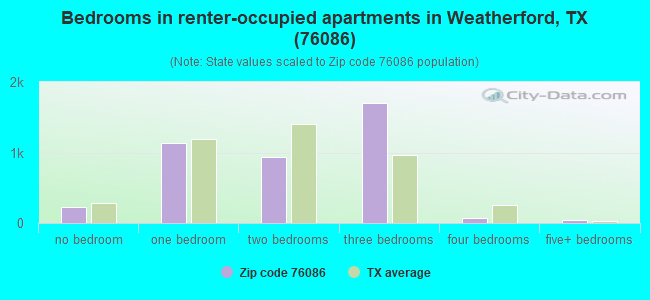
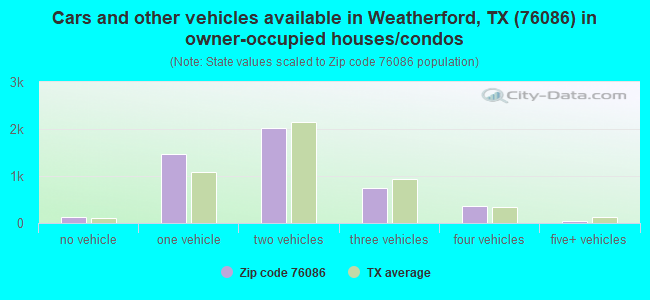


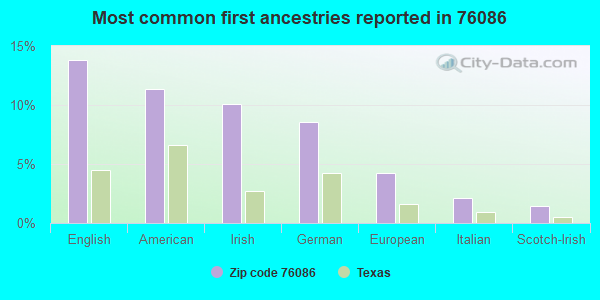
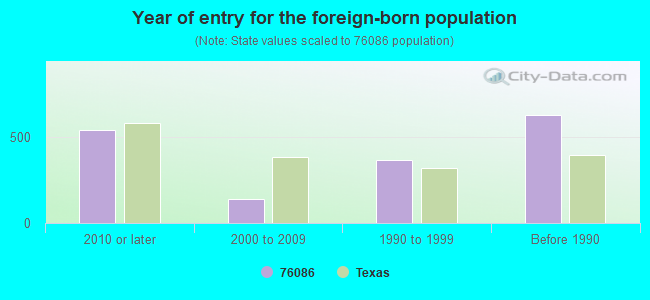


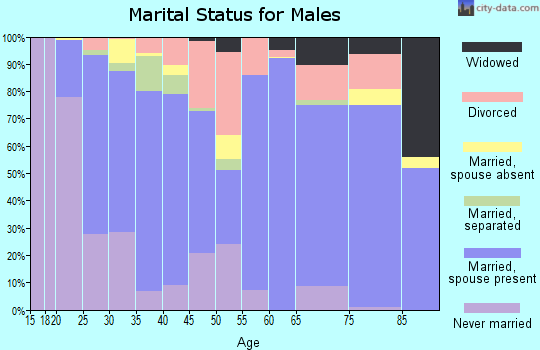
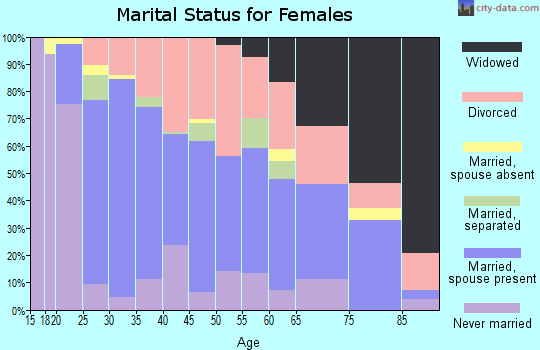
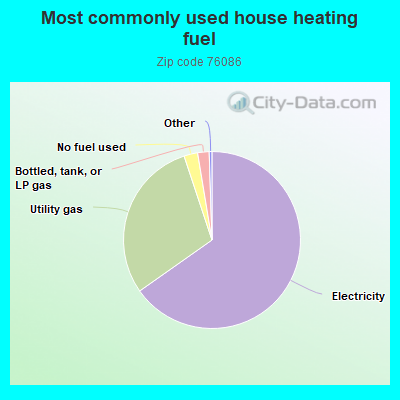
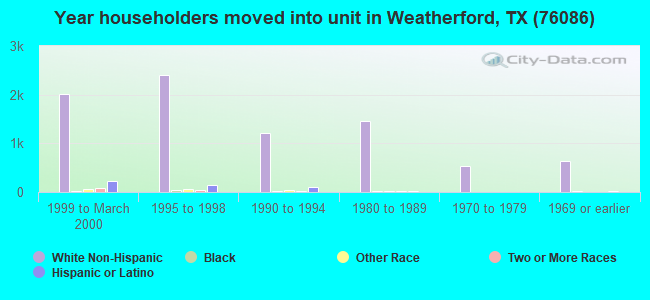
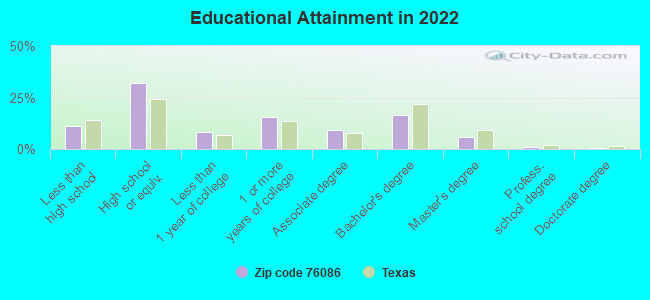
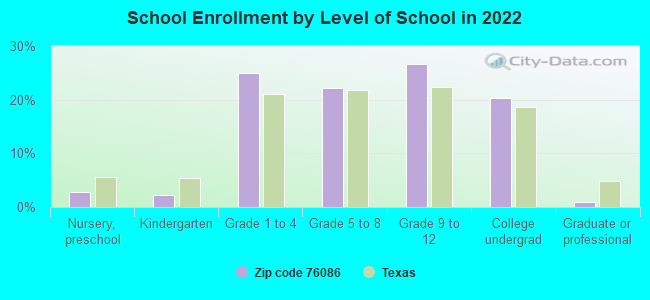
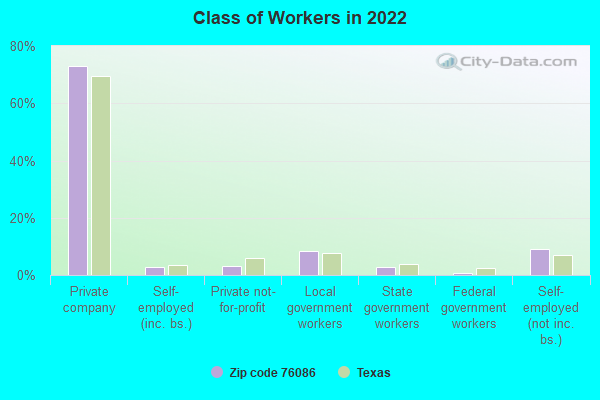
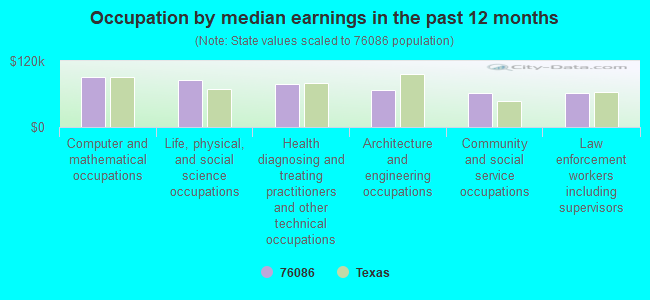
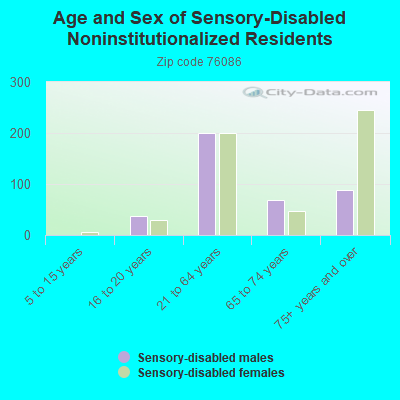
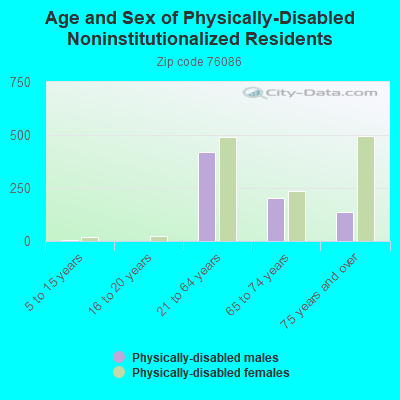
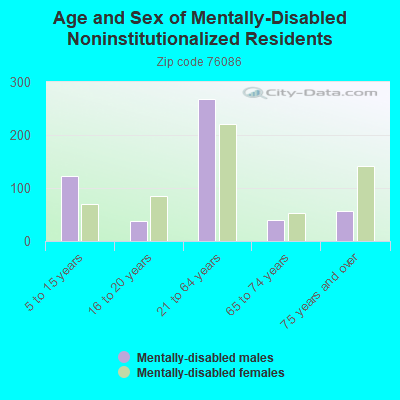

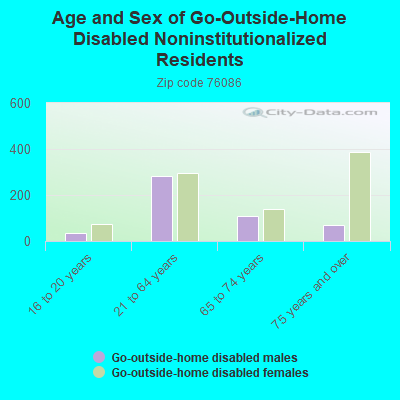

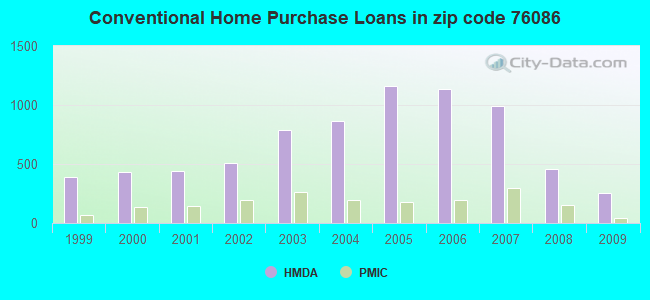
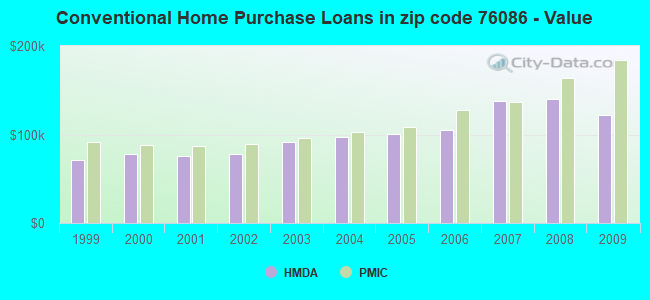
 According to the data from the years 2002 - 2018 the average number of fire incidents per year is 129. The highest number of fires - 340 took place in 2005, and the least - 8 in 2007. The data has a growing trend.
 When looking into fire subcategories, the most reports belonged to: Outside Fires (55.2%), and Structure Fires (28.4%).