Weatherford, Texas Submit your own pictures of this city and show them to the world
OSM Map
General Map
Google Map
MSN Map
OSM Map
General Map
Google Map
MSN Map
OSM Map
General Map
Google Map
MSN Map
OSM Map
General Map
Google Map
MSN Map
Please wait while loading the map...
Population in 2022: 36,251 (94% urban, 6% rural). Population change since 2000: +90.8%Males: 18,859 Females: 17,392
March 2022 cost of living index in Weatherford: 96.0 (near average, U.S. average is 100) Percentage of residents living in poverty in 2022: 8.8%for White Non-Hispanic residents , 44.2% for Black residents , 9.5% for Hispanic or Latino residents , 3.0% for American Indian residents , 5.3% for other race residents , 9.5% for two or more races residents )
Profiles of local businesses
Business Search - 14 Million verified businesses
Data:
Median household income ($)
Median household income (% change since 2000)
Household income diversity
Ratio of average income to average house value (%)
Ratio of average income to average rent
Median household income ($) - White
Median household income ($) - Black or African American
Median household income ($) - Asian
Median household income ($) - Hispanic or Latino
Median household income ($) - American Indian and Alaska Native
Median household income ($) - Multirace
Median household income ($) - Other Race
Median household income for houses/condos with a mortgage ($)
Median household income for apartments without a mortgage ($)
Races - White alone (%)
Races - White alone (% change since 2000)
Races - Black alone (%)
Races - Black alone (% change since 2000)
Races - American Indian alone (%)
Races - American Indian alone (% change since 2000)
Races - Asian alone (%)
Races - Asian alone (% change since 2000)
Races - Hispanic (%)
Races - Hispanic (% change since 2000)
Races - Native Hawaiian and Other Pacific Islander alone (%)
Races - Native Hawaiian and Other Pacific Islander alone (% change since 2000)
Races - Two or more races (%)
Races - Two or more races (% change since 2000)
Races - Other race alone (%)
Races - Other race alone (% change since 2000)
Racial diversity
Unemployment (%)
Unemployment (% change since 2000)
Unemployment (%) - White
Unemployment (%) - Black or African American
Unemployment (%) - Asian
Unemployment (%) - Hispanic or Latino
Unemployment (%) - American Indian and Alaska Native
Unemployment (%) - Multirace
Unemployment (%) - Other Race
Population density (people per square mile)
Population - Males (%)
Population - Females (%)
Population - Males (%) - White
Population - Males (%) - Black or African American
Population - Males (%) - Asian
Population - Males (%) - Hispanic or Latino
Population - Males (%) - American Indian and Alaska Native
Population - Males (%) - Multirace
Population - Males (%) - Other Race
Population - Females (%) - White
Population - Females (%) - Black or African American
Population - Females (%) - Asian
Population - Females (%) - Hispanic or Latino
Population - Females (%) - American Indian and Alaska Native
Population - Females (%) - Multirace
Population - Females (%) - Other Race
Coronavirus confirmed cases (Apr 27, 2024)
Deaths caused by coronavirus (Apr 27, 2024)
Coronavirus confirmed cases (per 100k population) (Apr 27, 2024)
Deaths caused by coronavirus (per 100k population) (Apr 27, 2024)
Daily increase in number of cases (Apr 27, 2024)
Weekly increase in number of cases (Apr 27, 2024)
Cases doubled (in days) (Apr 27, 2024)
Hospitalized patients (Apr 18, 2022)
Negative test results (Apr 18, 2022)
Total test results (Apr 18, 2022)
COVID Vaccine doses distributed (per 100k population) (Sep 19, 2023)
COVID Vaccine doses administered (per 100k population) (Sep 19, 2023)
COVID Vaccine doses distributed (Sep 19, 2023)
COVID Vaccine doses administered (Sep 19, 2023)
Likely homosexual households (%)
Likely homosexual households (% change since 2000)
Likely homosexual households - Lesbian couples (%)
Likely homosexual households - Lesbian couples (% change since 2000)
Likely homosexual households - Gay men (%)
Likely homosexual households - Gay men (% change since 2000)
Cost of living index
Median gross rent ($)
Median contract rent ($)
Median monthly housing costs ($)
Median house or condo value ($)
Median house or condo value ($ change since 2000)
Mean house or condo value by units in structure - 1, detached ($)
Mean house or condo value by units in structure - 1, attached ($)
Mean house or condo value by units in structure - 2 ($)
Mean house or condo value by units in structure by units in structure - 3 or 4 ($)
Mean house or condo value by units in structure - 5 or more ($)
Mean house or condo value by units in structure - Boat, RV, van, etc. ($)
Mean house or condo value by units in structure - Mobile home ($)
Median house or condo value ($) - White
Median house or condo value ($) - Black or African American
Median house or condo value ($) - Asian
Median house or condo value ($) - Hispanic or Latino
Median house or condo value ($) - American Indian and Alaska Native
Median house or condo value ($) - Multirace
Median house or condo value ($) - Other Race
Median resident age
Resident age diversity
Median resident age - Males
Median resident age - Females
Median resident age - White
Median resident age - Black or African American
Median resident age - Asian
Median resident age - Hispanic or Latino
Median resident age - American Indian and Alaska Native
Median resident age - Multirace
Median resident age - Other Race
Median resident age - Males - White
Median resident age - Males - Black or African American
Median resident age - Males - Asian
Median resident age - Males - Hispanic or Latino
Median resident age - Males - American Indian and Alaska Native
Median resident age - Males - Multirace
Median resident age - Males - Other Race
Median resident age - Females - White
Median resident age - Females - Black or African American
Median resident age - Females - Asian
Median resident age - Females - Hispanic or Latino
Median resident age - Females - American Indian and Alaska Native
Median resident age - Females - Multirace
Median resident age - Females - Other Race
Commute - mean travel time to work (minutes)
Travel time to work - Less than 5 minutes (%)
Travel time to work - Less than 5 minutes (% change since 2000)
Travel time to work - 5 to 9 minutes (%)
Travel time to work - 5 to 9 minutes (% change since 2000)
Travel time to work - 10 to 19 minutes (%)
Travel time to work - 10 to 19 minutes (% change since 2000)
Travel time to work - 20 to 29 minutes (%)
Travel time to work - 20 to 29 minutes (% change since 2000)
Travel time to work - 30 to 39 minutes (%)
Travel time to work - 30 to 39 minutes (% change since 2000)
Travel time to work - 40 to 59 minutes (%)
Travel time to work - 40 to 59 minutes (% change since 2000)
Travel time to work - 60 to 89 minutes (%)
Travel time to work - 60 to 89 minutes (% change since 2000)
Travel time to work - 90 or more minutes (%)
Travel time to work - 90 or more minutes (% change since 2000)
Marital status - Never married (%)
Marital status - Now married (%)
Marital status - Separated (%)
Marital status - Widowed (%)
Marital status - Divorced (%)
Median family income ($)
Median family income (% change since 2000)
Median non-family income ($)
Median non-family income (% change since 2000)
Median per capita income ($)
Median per capita income (% change since 2000)
Median family income ($) - White
Median family income ($) - Black or African American
Median family income ($) - Asian
Median family income ($) - Hispanic or Latino
Median family income ($) - American Indian and Alaska Native
Median family income ($) - Multirace
Median family income ($) - Other Race
Median year house/condo built
Median year apartment built
Year house built - Built 2005 or later (%)
Year house built - Built 2000 to 2004 (%)
Year house built - Built 1990 to 1999 (%)
Year house built - Built 1980 to 1989 (%)
Year house built - Built 1970 to 1979 (%)
Year house built - Built 1960 to 1969 (%)
Year house built - Built 1950 to 1959 (%)
Year house built - Built 1940 to 1949 (%)
Year house built - Built 1939 or earlier (%)
Average household size
Household density (households per square mile)
Average household size - White
Average household size - Black or African American
Average household size - Asian
Average household size - Hispanic or Latino
Average household size - American Indian and Alaska Native
Average household size - Multirace
Average household size - Other Race
Occupied housing units (%)
Vacant housing units (%)
Owner occupied housing units (%)
Renter occupied housing units (%)
Vacancy status - For rent (%)
Vacancy status - For sale only (%)
Vacancy status - Rented or sold, not occupied (%)
Vacancy status - For seasonal, recreational, or occasional use (%)
Vacancy status - For migrant workers (%)
Vacancy status - Other vacant (%)
Residents with income below the poverty level (%)
Residents with income below 50% of the poverty level (%)
Children below poverty level (%)
Poor families by family type - Married-couple family (%)
Poor families by family type - Male, no wife present (%)
Poor families by family type - Female, no husband present (%)
Poverty status for native-born residents (%)
Poverty status for foreign-born residents (%)
Poverty among high school graduates not in families (%)
Poverty among people who did not graduate high school not in families (%)
Residents with income below the poverty level (%) - White
Residents with income below the poverty level (%) - Black or African American
Residents with income below the poverty level (%) - Asian
Residents with income below the poverty level (%) - Hispanic or Latino
Residents with income below the poverty level (%) - American Indian and Alaska Native
Residents with income below the poverty level (%) - Multirace
Residents with income below the poverty level (%) - Other Race
Air pollution - Air Quality Index (AQI)
Air pollution - CO
Air pollution - NO2
Air pollution - SO2
Air pollution - Ozone
Air pollution - PM10
Air pollution - PM25
Air pollution - Pb
Crime - Murders per 100,000 population
Crime - Rapes per 100,000 population
Crime - Robberies per 100,000 population
Crime - Assaults per 100,000 population
Crime - Burglaries per 100,000 population
Crime - Thefts per 100,000 population
Crime - Auto thefts per 100,000 population
Crime - Arson per 100,000 population
Crime - City-data.com crime index
Crime - Violent crime index
Crime - Property crime index
Crime - Murders per 100,000 population (5 year average)
Crime - Rapes per 100,000 population (5 year average)
Crime - Robberies per 100,000 population (5 year average)
Crime - Assaults per 100,000 population (5 year average)
Crime - Burglaries per 100,000 population (5 year average)
Crime - Thefts per 100,000 population (5 year average)
Crime - Auto thefts per 100,000 population (5 year average)
Crime - Arson per 100,000 population (5 year average)
Crime - City-data.com crime index (5 year average)
Crime - Violent crime index (5 year average)
Crime - Property crime index (5 year average)
1996 Presidential Elections Results (%) - Democratic Party (Clinton)
1996 Presidential Elections Results (%) - Republican Party (Dole)
1996 Presidential Elections Results (%) - Other
2000 Presidential Elections Results (%) - Democratic Party (Gore)
2000 Presidential Elections Results (%) - Republican Party (Bush)
2000 Presidential Elections Results (%) - Other
2004 Presidential Elections Results (%) - Democratic Party (Kerry)
2004 Presidential Elections Results (%) - Republican Party (Bush)
2004 Presidential Elections Results (%) - Other
2008 Presidential Elections Results (%) - Democratic Party (Obama)
2008 Presidential Elections Results (%) - Republican Party (McCain)
2008 Presidential Elections Results (%) - Other
2012 Presidential Elections Results (%) - Democratic Party (Obama)
2012 Presidential Elections Results (%) - Republican Party (Romney)
2012 Presidential Elections Results (%) - Other
2016 Presidential Elections Results (%) - Democratic Party (Clinton)
2016 Presidential Elections Results (%) - Republican Party (Trump)
2016 Presidential Elections Results (%) - Other
2020 Presidential Elections Results (%) - Democratic Party (Biden)
2020 Presidential Elections Results (%) - Republican Party (Trump)
2020 Presidential Elections Results (%) - Other
Ancestries Reported - Arab (%)
Ancestries Reported - Czech (%)
Ancestries Reported - Danish (%)
Ancestries Reported - Dutch (%)
Ancestries Reported - English (%)
Ancestries Reported - French (%)
Ancestries Reported - French Canadian (%)
Ancestries Reported - German (%)
Ancestries Reported - Greek (%)
Ancestries Reported - Hungarian (%)
Ancestries Reported - Irish (%)
Ancestries Reported - Italian (%)
Ancestries Reported - Lithuanian (%)
Ancestries Reported - Norwegian (%)
Ancestries Reported - Polish (%)
Ancestries Reported - Portuguese (%)
Ancestries Reported - Russian (%)
Ancestries Reported - Scotch-Irish (%)
Ancestries Reported - Scottish (%)
Ancestries Reported - Slovak (%)
Ancestries Reported - Subsaharan African (%)
Ancestries Reported - Swedish (%)
Ancestries Reported - Swiss (%)
Ancestries Reported - Ukrainian (%)
Ancestries Reported - United States (%)
Ancestries Reported - Welsh (%)
Ancestries Reported - West Indian (%)
Ancestries Reported - Other (%)
Educational Attainment - No schooling completed (%)
Educational Attainment - Less than high school (%)
Educational Attainment - High school or equivalent (%)
Educational Attainment - Less than 1 year of college (%)
Educational Attainment - 1 or more years of college (%)
Educational Attainment - Associate degree (%)
Educational Attainment - Bachelor's degree (%)
Educational Attainment - Master's degree (%)
Educational Attainment - Professional school degree (%)
Educational Attainment - Doctorate degree (%)
School Enrollment - Nursery, preschool (%)
School Enrollment - Kindergarten (%)
School Enrollment - Grade 1 to 4 (%)
School Enrollment - Grade 5 to 8 (%)
School Enrollment - Grade 9 to 12 (%)
School Enrollment - College undergrad (%)
School Enrollment - Graduate or professional (%)
School Enrollment - Not enrolled in school (%)
School enrollment - Public schools (%)
School enrollment - Private schools (%)
School enrollment - Not enrolled (%)
Median number of rooms in houses and condos
Median number of rooms in apartments
Housing units lacking complete plumbing facilities (%)
Housing units lacking complete kitchen facilities (%)
Density of houses
Urban houses (%)
Rural houses (%)
Households with people 60 years and over (%)
Households with people 65 years and over (%)
Households with people 75 years and over (%)
Households with one or more nonrelatives (%)
Households with no nonrelatives (%)
Population in households (%)
Family households (%)
Nonfamily households (%)
Population in families (%)
Family households with own children (%)
Median number of bedrooms in owner occupied houses
Mean number of bedrooms in owner occupied houses
Median number of bedrooms in renter occupied houses
Mean number of bedrooms in renter occupied houses
Median number of vehichles in owner occupied houses
Mean number of vehichles in owner occupied houses
Median number of vehichles in renter occupied houses
Mean number of vehichles in renter occupied houses
Mortgage status - with mortgage (%)
Mortgage status - with second mortgage (%)
Mortgage status - with home equity loan (%)
Mortgage status - with both second mortgage and home equity loan (%)
Mortgage status - without a mortgage (%)
Average family size
Average family size - White
Average family size - Black or African American
Average family size - Asian
Average family size - Hispanic or Latino
Average family size - American Indian and Alaska Native
Average family size - Multirace
Average family size - Other Race
Geographical mobility - Same house 1 year ago (%)
Geographical mobility - Moved within same county (%)
Geographical mobility - Moved from different county within same state (%)
Geographical mobility - Moved from different state (%)
Geographical mobility - Moved from abroad (%)
Place of birth - Born in state of residence (%)
Place of birth - Born in other state (%)
Place of birth - Native, outside of US (%)
Place of birth - Foreign born (%)
Housing units in structures - 1, detached (%)
Housing units in structures - 1, attached (%)
Housing units in structures - 2 (%)
Housing units in structures - 3 or 4 (%)
Housing units in structures - 5 to 9 (%)
Housing units in structures - 10 to 19 (%)
Housing units in structures - 20 to 49 (%)
Housing units in structures - 50 or more (%)
Housing units in structures - Mobile home (%)
Housing units in structures - Boat, RV, van, etc. (%)
House/condo owner moved in on average (years ago)
Renter moved in on average (years ago)
Year householder moved into unit - Moved in 1999 to March 2000 (%)
Year householder moved into unit - Moved in 1995 to 1998 (%)
Year householder moved into unit - Moved in 1990 to 1994 (%)
Year householder moved into unit - Moved in 1980 to 1989 (%)
Year householder moved into unit - Moved in 1970 to 1979 (%)
Year householder moved into unit - Moved in 1969 or earlier (%)
Means of transportation to work - Drove car alone (%)
Means of transportation to work - Carpooled (%)
Means of transportation to work - Public transportation (%)
Means of transportation to work - Bus or trolley bus (%)
Means of transportation to work - Streetcar or trolley car (%)
Means of transportation to work - Subway or elevated (%)
Means of transportation to work - Railroad (%)
Means of transportation to work - Ferryboat (%)
Means of transportation to work - Taxicab (%)
Means of transportation to work - Motorcycle (%)
Means of transportation to work - Bicycle (%)
Means of transportation to work - Walked (%)
Means of transportation to work - Other means (%)
Working at home (%)
Industry diversity
Most Common Industries - Agriculture, forestry, fishing and hunting, and mining (%)
Most Common Industries - Agriculture, forestry, fishing and hunting (%)
Most Common Industries - Mining, quarrying, and oil and gas extraction (%)
Most Common Industries - Construction (%)
Most Common Industries - Manufacturing (%)
Most Common Industries - Wholesale trade (%)
Most Common Industries - Retail trade (%)
Most Common Industries - Transportation and warehousing, and utilities (%)
Most Common Industries - Transportation and warehousing (%)
Most Common Industries - Utilities (%)
Most Common Industries - Information (%)
Most Common Industries - Finance and insurance, and real estate and rental and leasing (%)
Most Common Industries - Finance and insurance (%)
Most Common Industries - Real estate and rental and leasing (%)
Most Common Industries - Professional, scientific, and management, and administrative and waste management services (%)
Most Common Industries - Professional, scientific, and technical services (%)
Most Common Industries - Management of companies and enterprises (%)
Most Common Industries - Administrative and support and waste management services (%)
Most Common Industries - Educational services, and health care and social assistance (%)
Most Common Industries - Educational services (%)
Most Common Industries - Health care and social assistance (%)
Most Common Industries - Arts, entertainment, and recreation, and accommodation and food services (%)
Most Common Industries - Arts, entertainment, and recreation (%)
Most Common Industries - Accommodation and food services (%)
Most Common Industries - Other services, except public administration (%)
Most Common Industries - Public administration (%)
Occupation diversity
Most Common Occupations - Management, business, science, and arts occupations (%)
Most Common Occupations - Management, business, and financial occupations (%)
Most Common Occupations - Management occupations (%)
Most Common Occupations - Business and financial operations occupations (%)
Most Common Occupations - Computer, engineering, and science occupations (%)
Most Common Occupations - Computer and mathematical occupations (%)
Most Common Occupations - Architecture and engineering occupations (%)
Most Common Occupations - Life, physical, and social science occupations (%)
Most Common Occupations - Education, legal, community service, arts, and media occupations (%)
Most Common Occupations - Community and social service occupations (%)
Most Common Occupations - Legal occupations (%)
Most Common Occupations - Education, training, and library occupations (%)
Most Common Occupations - Arts, design, entertainment, sports, and media occupations (%)
Most Common Occupations - Healthcare practitioners and technical occupations (%)
Most Common Occupations - Health diagnosing and treating practitioners and other technical occupations (%)
Most Common Occupations - Health technologists and technicians (%)
Most Common Occupations - Service occupations (%)
Most Common Occupations - Healthcare support occupations (%)
Most Common Occupations - Protective service occupations (%)
Most Common Occupations - Fire fighting and prevention, and other protective service workers including supervisors (%)
Most Common Occupations - Law enforcement workers including supervisors (%)
Most Common Occupations - Food preparation and serving related occupations (%)
Most Common Occupations - Building and grounds cleaning and maintenance occupations (%)
Most Common Occupations - Personal care and service occupations (%)
Most Common Occupations - Sales and office occupations (%)
Most Common Occupations - Sales and related occupations (%)
Most Common Occupations - Office and administrative support occupations (%)
Most Common Occupations - Natural resources, construction, and maintenance occupations (%)
Most Common Occupations - Farming, fishing, and forestry occupations (%)
Most Common Occupations - Construction and extraction occupations (%)
Most Common Occupations - Installation, maintenance, and repair occupations (%)
Most Common Occupations - Production, transportation, and material moving occupations (%)
Most Common Occupations - Production occupations (%)
Most Common Occupations - Transportation occupations (%)
Most Common Occupations - Material moving occupations (%)
People in Group quarters - Institutionalized population (%)
People in Group quarters - Correctional institutions (%)
People in Group quarters - Federal prisons and detention centers (%)
People in Group quarters - Halfway houses (%)
People in Group quarters - Local jails and other confinement facilities (including police lockups) (%)
People in Group quarters - Military disciplinary barracks (%)
People in Group quarters - State prisons (%)
People in Group quarters - Other types of correctional institutions (%)
People in Group quarters - Nursing homes (%)
People in Group quarters - Hospitals/wards, hospices, and schools for the handicapped (%)
People in Group quarters - Hospitals/wards and hospices for chronically ill (%)
People in Group quarters - Hospices or homes for chronically ill (%)
People in Group quarters - Military hospitals or wards for chronically ill (%)
People in Group quarters - Other hospitals or wards for chronically ill (%)
People in Group quarters - Hospitals or wards for drug/alcohol abuse (%)
People in Group quarters - Mental (Psychiatric) hospitals or wards (%)
People in Group quarters - Schools, hospitals, or wards for the mentally retarded (%)
People in Group quarters - Schools, hospitals, or wards for the physically handicapped (%)
People in Group quarters - Institutions for the deaf (%)
People in Group quarters - Institutions for the blind (%)
People in Group quarters - Orthopedic wards and institutions for the physically handicapped (%)
People in Group quarters - Wards in general hospitals for patients who have no usual home elsewhere (%)
People in Group quarters - Wards in military hospitals for patients who have no usual home elsewhere (%)
People in Group quarters - Juvenile institutions (%)
People in Group quarters - Long-term care (%)
People in Group quarters - Homes for abused, dependent, and neglected children (%)
People in Group quarters - Residential treatment centers for emotionally disturbed children (%)
People in Group quarters - Training schools for juvenile delinquents (%)
People in Group quarters - Short-term care, detention or diagnostic centers for delinquent children (%)
People in Group quarters - Type of juvenile institution unknown (%)
People in Group quarters - Noninstitutionalized population (%)
People in Group quarters - College dormitories (includes college quarters off campus) (%)
People in Group quarters - Military quarters (%)
People in Group quarters - On base (%)
People in Group quarters - Barracks, unaccompanied personnel housing (UPH), (Enlisted/Officer), ;and similar group living quarters for military personnel (%)
People in Group quarters - Transient quarters for temporary residents (%)
People in Group quarters - Military ships (%)
People in Group quarters - Group homes (%)
People in Group quarters - Homes or halfway houses for drug/alcohol abuse (%)
People in Group quarters - Homes for the mentally ill (%)
People in Group quarters - Homes for the mentally retarded (%)
People in Group quarters - Homes for the physically handicapped (%)
People in Group quarters - Other group homes (%)
People in Group quarters - Religious group quarters (%)
People in Group quarters - Dormitories (%)
People in Group quarters - Agriculture workers' dormitories on farms (%)
People in Group quarters - Job Corps and vocational training facilities (%)
People in Group quarters - Other workers' dormitories (%)
People in Group quarters - Crews of maritime vessels (%)
People in Group quarters - Other nonhousehold living situations (%)
People in Group quarters - Other noninstitutional group quarters (%)
Residents speaking English at home (%)
Residents speaking English at home - Born in the United States (%)
Residents speaking English at home - Native, born elsewhere (%)
Residents speaking English at home - Foreign born (%)
Residents speaking Spanish at home (%)
Residents speaking Spanish at home - Born in the United States (%)
Residents speaking Spanish at home - Native, born elsewhere (%)
Residents speaking Spanish at home - Foreign born (%)
Residents speaking other language at home (%)
Residents speaking other language at home - Born in the United States (%)
Residents speaking other language at home - Native, born elsewhere (%)
Residents speaking other language at home - Foreign born (%)
Class of Workers - Employee of private company (%)
Class of Workers - Self-employed in own incorporated business (%)
Class of Workers - Private not-for-profit wage and salary workers (%)
Class of Workers - Local government workers (%)
Class of Workers - State government workers (%)
Class of Workers - Federal government workers (%)
Class of Workers - Self-employed workers in own not incorporated business and Unpaid family workers (%)
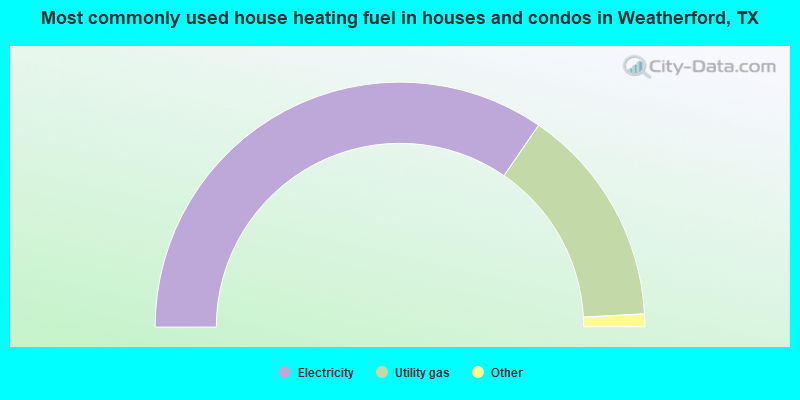
House heating fuel used in houses and condos - Utility gas (%)
House heating fuel used in houses and condos - Bottled, tank, or LP gas (%)
House heating fuel used in houses and condos - Electricity (%)
House heating fuel used in houses and condos - Fuel oil, kerosene, etc. (%)
House heating fuel used in houses and condos - Coal or coke (%)
House heating fuel used in houses and condos - Wood (%)
House heating fuel used in houses and condos - Solar energy (%)
House heating fuel used in houses and condos - Other fuel (%)
House heating fuel used in houses and condos - No fuel used (%)
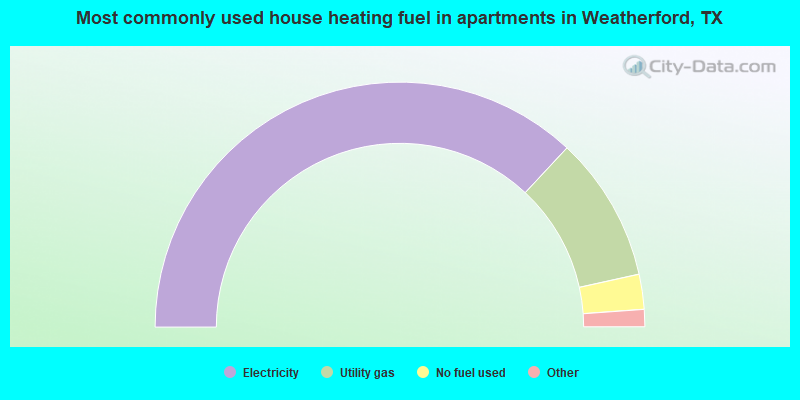
House heating fuel used in apartments - Utility gas (%)
House heating fuel used in apartments - Bottled, tank, or LP gas (%)
House heating fuel used in apartments - Electricity (%)
House heating fuel used in apartments - Fuel oil, kerosene, etc. (%)
House heating fuel used in apartments - Coal or coke (%)
House heating fuel used in apartments - Wood (%)
House heating fuel used in apartments - Solar energy (%)
House heating fuel used in apartments - Other fuel (%)
House heating fuel used in apartments - No fuel used (%)
Armed forces status - In Armed Forces (%)
Armed forces status - Civilian (%)
Armed forces status - Civilian - Veteran (%)
Armed forces status - Civilian - Nonveteran (%)
Fatal accidents locations in years 2005-2021
Fatal accidents locations in 2005
Fatal accidents locations in 2006
Fatal accidents locations in 2007
Fatal accidents locations in 2008
Fatal accidents locations in 2009
Fatal accidents locations in 2010
Fatal accidents locations in 2011
Fatal accidents locations in 2012
Fatal accidents locations in 2013
Fatal accidents locations in 2014
Fatal accidents locations in 2015
Fatal accidents locations in 2016
Fatal accidents locations in 2017
Fatal accidents locations in 2018
Fatal accidents locations in 2019
Fatal accidents locations in 2020
Fatal accidents locations in 2021
Alcohol use - People drinking some alcohol every month (%)
Alcohol use - People not drinking at all (%)
Alcohol use - Average days/month drinking alcohol
Alcohol use - Average drinks/week
Alcohol use - Average days/year people drink much
Audiometry - Average condition of hearing (%)
Audiometry - People that can hear a whisper from across a quiet room (%)
Audiometry - People that can hear normal voice from across a quiet room (%)
Audiometry - Ears ringing, roaring, buzzing (%)
Audiometry - Had a job exposure to loud noise (%)
Audiometry - Had off-work exposure to loud noise (%)
Blood Pressure & Cholesterol - Has high blood pressure (%)
Blood Pressure & Cholesterol - Checking blood pressure at home (%)
Blood Pressure & Cholesterol - Frequently checking blood cholesterol (%)
Blood Pressure & Cholesterol - Has high cholesterol level (%)
Consumer Behavior - Money monthly spent on food at supermarket/grocery store
Consumer Behavior - Money monthly spent on food at other stores
Consumer Behavior - Money monthly spent on eating out
Consumer Behavior - Money monthly spent on carryout/delivered foods
Consumer Behavior - Income spent on food at supermarket/grocery store (%)
Consumer Behavior - Income spent on food at other stores (%)
Consumer Behavior - Income spent on eating out (%)
Consumer Behavior - Income spent on carryout/delivered foods (%)
Current Health Status - General health condition (%)
Current Health Status - Blood donors (%)
Current Health Status - Has blood ever tested for HIV virus (%)
Current Health Status - Left-handed people (%)
Dermatology - People using sunscreen (%)
Diabetes - Diabetics (%)
Diabetes - Had a blood test for high blood sugar (%)
Diabetes - People taking insulin (%)
Diet Behavior & Nutrition - Diet health (%)
Diet Behavior & Nutrition - Milk product consumption (# of products/month)
Diet Behavior & Nutrition - Meals not home prepared (#/week)
Diet Behavior & Nutrition - Meals from fast food or pizza place (#/week)
Diet Behavior & Nutrition - Ready-to-eat foods (#/month)
Diet Behavior & Nutrition - Frozen meals/pizza (#/month)
Drug Use - People that ever used marijuana or hashish (%)
Drug Use - Ever used hard drugs (%)
Drug Use - Ever used any form of cocaine (%)
Drug Use - Ever used heroin (%)
Drug Use - Ever used methamphetamine (%)
Health Insurance - People covered by health insurance (%)
Kidney Conditions-Urology - Avg. # of times urinating at night
Medical Conditions - People with asthma (%)
Medical Conditions - People with anemia (%)
Medical Conditions - People with psoriasis (%)
Medical Conditions - People with overweight (%)
Medical Conditions - Elderly people having difficulties in thinking or remembering (%)
Medical Conditions - People who ever received blood transfusion (%)
Medical Conditions - People having trouble seeing even with glass/contacts (%)
Medical Conditions - People with arthritis (%)
Medical Conditions - People with gout (%)
Medical Conditions - People with congestive heart failure (%)
Medical Conditions - People with coronary heart disease (%)
Medical Conditions - People with angina pectoris (%)
Medical Conditions - People who ever had heart attack (%)
Medical Conditions - People who ever had stroke (%)
Medical Conditions - People with emphysema (%)
Medical Conditions - People with thyroid problem (%)
Medical Conditions - People with chronic bronchitis (%)
Medical Conditions - People with any liver condition (%)
Medical Conditions - People who ever had cancer or malignancy (%)
Mental Health - People who have little interest in doing things (%)
Mental Health - People feeling down, depressed, or hopeless (%)
Mental Health - People who have trouble sleeping or sleeping too much (%)
Mental Health - People feeling tired or having little energy (%)
Mental Health - People with poor appetite or overeating (%)
Mental Health - People feeling bad about themself (%)
Mental Health - People who have trouble concentrating on things (%)
Mental Health - People moving or speaking slowly or too fast (%)
Mental Health - People having thoughts they would be better off dead (%)
Oral Health - Average years since last visit a dentist
Oral Health - People embarrassed because of mouth (%)
Oral Health - People with gum disease (%)
Oral Health - General health of teeth and gums (%)
Oral Health - Average days a week using dental floss/device
Oral Health - Average days a week using mouthwash for dental problem
Oral Health - Average number of teeth
Pesticide Use - Households using pesticides to control insects (%)
Pesticide Use - Households using pesticides to kill weeds (%)
Physical Activity - People doing vigorous-intensity work activities (%)
Physical Activity - People doing moderate-intensity work activities (%)
Physical Activity - People walking or bicycling (%)
Physical Activity - People doing vigorous-intensity recreational activities (%)
Physical Activity - People doing moderate-intensity recreational activities (%)
Physical Activity - Average hours a day doing sedentary activities
Physical Activity - Average hours a day watching TV or videos
Physical Activity - Average hours a day using computer
Physical Functioning - People having limitations keeping them from working (%)
Physical Functioning - People limited in amount of work they can do (%)
Physical Functioning - People that need special equipment to walk (%)
Physical Functioning - People experiencing confusion/memory problems (%)
Physical Functioning - People requiring special healthcare equipment (%)
Prescription Medications - Average number of prescription medicines taking
Preventive Aspirin Use - Adults 40+ taking low-dose aspirin (%)
Reproductive Health - Vaginal deliveries (%)
Reproductive Health - Cesarean deliveries (%)
Reproductive Health - Deliveries resulted in a live birth (%)
Reproductive Health - Pregnancies resulted in a delivery (%)
Reproductive Health - Women breastfeeding newborns (%)
Reproductive Health - Women that had a hysterectomy (%)
Reproductive Health - Women that had both ovaries removed (%)
Reproductive Health - Women that have ever taken birth control pills (%)
Reproductive Health - Women taking birth control pills (%)
Reproductive Health - Women that have ever used Depo-Provera or injectables (%)
Reproductive Health - Women that have ever used female hormones (%)
Sexual Behavior - People 18+ that ever had sex (vaginal, anal, or oral) (%)
Sexual Behavior - Males 18+ that ever had vaginal sex with a woman (%)
Sexual Behavior - Males 18+ that ever performed oral sex on a woman (%)
Sexual Behavior - Males 18+ that ever had anal sex with a woman (%)
Sexual Behavior - Males 18+ that ever had any sex with a man (%)
Sexual Behavior - Females 18+ that ever had vaginal sex with a man (%)
Sexual Behavior - Females 18+ that ever performed oral sex on a man (%)
Sexual Behavior - Females 18+ that ever had anal sex with a man (%)
Sexual Behavior - Females 18+ that ever had any kind of sex with a woman (%)
Sexual Behavior - Average age people first had sex
Sexual Behavior - Average number of female sex partners in lifetime (males 18+)
Sexual Behavior - Average number of female vaginal sex partners in lifetime (males 18+)
Sexual Behavior - Average age people first performed oral sex on a woman (18+)
Sexual Behavior - Average number of woman performed oral sex on in lifetime (18+)
Sexual Behavior - Average number of male sex partners in lifetime (males 18+)
Sexual Behavior - Average number of male anal sex partners in lifetime (males 18+)
Sexual Behavior - Average age people first performed oral sex on a man (18+)
Sexual Behavior - Average number of male oral sex partners in lifetime (18+)
Sexual Behavior - People using protection when performing oral sex (%)
Sexual Behavior - Average number of times people have vaginal or anal sex a year
Sexual Behavior - People having sex without condom (%)
Sexual Behavior - Average number of male sex partners in lifetime (females 18+)
Sexual Behavior - Average number of male vaginal sex partners in lifetime (females 18+)
Sexual Behavior - Average number of female sex partners in lifetime (females 18+)
Sexual Behavior - Circumcised males 18+ (%)
Sleep Disorders - Average hours sleeping at night
Sleep Disorders - People that has trouble sleeping (%)
Smoking-Cigarette Use - People smoking cigarettes (%)
Taste & Smell - People 40+ having problems with smell (%)
Taste & Smell - People 40+ having problems with taste (%)
Taste & Smell - People 40+ that ever had wisdom teeth removed (%)
Taste & Smell - People 40+ that ever had tonsils teeth removed (%)
Taste & Smell - People 40+ that ever had a loss of consciousness because of a head injury (%)
Taste & Smell - People 40+ that ever had a broken nose or other serious injury to face or skull (%)
Taste & Smell - People 40+ that ever had two or more sinus infections (%)
Weight - Average height (inches)
Weight - Average weight (pounds)
Weight - Average BMI
Weight - People that are obese (%)
Weight - People that ever were obese (%)
Weight - People trying to lose weight (%)
Officers per 1,000 residents here:
1.62Texas average:
2.07
Latest news from Weatherford, TX collected exclusively by city-data.com from local newspapers, TV, and radio stations
Weatherford, TX City Guides: Ancestries: American (15.0%), English (12.6%), Irish (12.1%), German (10.2%), European (4.6%), Scottish (1.5%).
Current Local Time:
Land area: 20.9 square miles.
Population density: 1,736 people per square mile (low).
1,847 residents are foreign born (2.9% Latin America , 1.2% Asia , 1.2% Europe ).
This city:
5.2%Texas:
17.1%
Median real estate property taxes paid for housing units with mortgages in 2022: $4,939 (1.6%)Median real estate property taxes paid for housing units with no mortgage in 2022: $3,148 (1.2%)
Nearest city with pop. 50,000+: Fort Worth, TX
Nearest city with pop. 1,000,000+: Dallas, TX
Nearest cities:
Latitude: 32.76 N, Longitude: 97.78 W
Weatherford nicknames or aliases (official or unofficial):
Peach Capital of Texas, Watermelon Capital of the World, Cutting horse capital of the worldDaytime population change due to commuting: +2,981 (+8.4%)Workers who live and work in this city: 7,597 (42.1%)
Single-family new house construction building permits:
2022: 394 buildings , average cost: $201,4002021: 446 buildings , average cost: $210,2002020: 281 buildings , average cost: $233,1002019: 189 buildings , average cost: $201,0002018: 209 buildings , average cost: $203,1002017: 241 buildings , average cost: $199,9002016: 204 buildings , average cost: $201,8002015: 199 buildings , average cost: $205,3002014: 195 buildings , average cost: $181,1002013: 140 buildings , average cost: $209,1002012: 121 buildings , average cost: $195,9002011: 224 buildings , average cost: $121,3002010: 88 buildings , average cost: $187,8002009: 256 buildings , average cost: $174,5002008: 154 buildings , average cost: $175,5002007: 213 buildings , average cost: $171,0002006: 303 buildings , average cost: $145,5002005: 281 buildings , average cost: $107,1002004: 258 buildings , average cost: $107,8002003: 241 buildings , average cost: $104,9002002: 221 buildings , average cost: $104,8002001: 211 buildings , average cost: $105,2002000: 181 buildings , average cost: $103,5001999: 146 buildings , average cost: $102,5001998: 183 buildings , average cost: $104,3001997: 162 buildings , average cost: $97,000Unemployment in December 2023:
Population change in the 1990s: +3,160 (+19.9%).
Most common occupations in Weatherford, TX (%)
Both Males Females
Other management occupations, except farmers and farm managers (5.1%)
Other sales and related occupations, including supervisors (4.8%)
Secretaries and administrative assistants (4.3%)
Preschool, kindergarten, elementary, and middle school teachers (3.6%)
Retail sales workers, except cashiers (3.5%)
Other office and administrative support workers, including supervisors (3.1%)
Building and grounds cleaning and maintenance occupations (3.0%)
Other management occupations, except farmers and farm managers (5.4%)
Driver/sales workers and truck drivers (5.0%)
Other sales and related occupations, including supervisors (4.9%)
Vehicle and mobile equipment mechanics, installers, and repairers (4.1%)
Electrical equipment mechanics and other installation, maintenance, and repair workers, including supervisors (3.7%)
Construction traders workers except carpenters, electricians, painters, plumbers, and construction laborers (3.5%)
Engineers (3.5%)
Secretaries and administrative assistants (9.0%)
Preschool, kindergarten, elementary, and middle school teachers (6.2%)
Other office and administrative support workers, including supervisors (6.2%)
Other management occupations, except farmers and farm managers (4.7%)
Other sales and related occupations, including supervisors (4.7%)
Registered nurses (3.8%)
Health technologists and technicians (3.7%)
Air pollution and air quality trends(lower is better)
AQI NO2 Ozone
Tornado activity:
Weatherford-area historical tornado activity is above Texas state average. It is 123% greater than the overall U.S. average.
On 4/25/1990, a category F4 (max. wind speeds 207-260 mph) tornado 3.0 miles away from the Weatherford city center caused between $500,000 and $5,000,000 in damages.
On 5/4/1960, a category F3 (max. wind speeds 158-206 mph) tornado 20.8 miles away from the city center injured 12 people and caused between $50,000 and $500,000 in damages.
Earthquake activity:
Weatherford-area historical earthquake activity is significantly above Texas state average. It is 463% greater than the overall U.S. average. On 11/6/2011 at 03:53:10, a magnitude 5.7 (5.7 MW, Depth: 3.2 mi, Class: Moderate, Intensity: VI - VII) earthquake occurred 200.5 miles away from the city center On 9/3/2016 at 12:02:44, a magnitude 5.8 (5.8 MW, Depth: 3.5 mi) earthquake occurred 258.2 miles away from Weatherford center On 6/16/1978 at 11:46:54, a magnitude 5.3 (4.4 MB, 4.6 UK, 5.3 ML) earthquake occurred 174.1 miles away from the city center On 11/7/2016 at 01:44:24, a magnitude 5.0 (5.0 MW, Depth: 2.8 mi) earthquake occurred 230.4 miles away from the city center On 11/8/2011 at 02:46:57, a magnitude 4.8 (4.8 MW, Depth: 3.1 mi, Class: Light, Intensity: IV - V) earthquake occurred 200.0 miles away from Weatherford center On 11/5/2011 at 07:12:45, a magnitude 4.8 (4.8 MW, Depth: 1.9 mi) earthquake occurred 201.7 miles away from Weatherford center Magnitude types: body-wave magnitude (MB), local magnitude (ML), moment magnitude (MW) Natural disasters: The number of natural disasters in Parker County (22) is greater than the US average (15).Major Disasters (Presidential) Declared: 12Emergencies Declared: 8Storms: 10, Floods: 9, Fires: 6, Tornadoes: 5, Hurricanes: 4, Wind: 1, Other: 2 (Note: some incidents may be assigned to more than one category). Hospitals in Weatherford: HARRIS METHODIST WESTVIEW (808 SANTE FE DR) MILL STREET (1212 S MILL ST) WEATHERFORD REGIONAL MEDICAL CENTER (Proprietary, provides emergency services, 713 E ANDERSON ST) Nursing Homes in Weatherford: COLLEGE PARK REHABILITATION AND CARE CENTER (1715 MARTIN DR) CRESCENT SENIOR CARE LLC (970 HILLTOP DR) HOLLAND LAKE NURSING CENTER LTD (1201 HOLLAND LAKE DR) KEENELAND HEALTH AND REHAB CENTER (700 SOUTH BOWIE) KEENELAND NURSING AND REHABILITATION LP (700 S BOWIE DR) KEENELAND NURSING HOME (700 SOUTH BOWIE) PEACH TREE PLACE (315 W ANDERSON ST) SANTA FE HEALTH AND REHABILITATION CENTER (1205 SANTA FE DR) WEATHERFORD HEALTH CARE CENTER (521 W 7TH ST) Dialysis Facilities in Weatherford: TARRANT DIALYSIS CENTER-WEATHERFORD (504 SANTE FE) WEATHERFORD DIALYSIS CENTER (2025 FORT WORTH HIGHWAY) Home Health Centers in Weatherford: OMNI HOME CARE (1115 FORT WORTH HIGHWAY SUITE 1500) WEATHERFORD HOME HEALTH (1836 SANTA FE DRIVE) Airports and heliports located in Weatherford: Parker County Airport (WEA) Runways: , Itinerant Ops: 5,000, Local Ops: 12,000, Military Ops: 40)Horseshoe Bend Airport (F78) Runways: , Itinerant Ops: 150, Local Ops: 1,000)Post Oak Airfield Airport (TA19) Runways: , Itinerant Ops: 50, Local Ops: 100)Cross Wind Airport (08TX) Runways: Driftwood Ranch Airport (XA86) Runways: Flying K Airport (6TA7) Runways: J Bar Wc Ranch Airport (54TS) Runways: Buckmaster Heliport (34TX) Clear Fork Ranch Heliport (TA54) Jamak Fabrication Heliport (2TS7) Staggs Heliport (TE93) Weatherford Regional Medical Center Heliport (98TA) See details about Airports and heliports located in Weatherford, TX
College/University in Weatherford: Weatherford College Full-time enrollment: 4,080; Location: 225 College Park Drive; Public; Website: www.wc.edu)
Other colleges/universities with over 2000 students near Weatherford:
Texas Christian University (about 25 miles; Fort Worth, TX ; Full-time enrollment: 9,131)
Tarrant County College District (about 27 miles; Fort Worth, TX ; FT enrollment: 33,775)
The University of Texas at Arlington (about 40 miles; Arlington, TX ; FT enrollment: 27,453)
Tarleton State University (about 46 miles; Stephenville, TX ; FT enrollment: 8,882)
DeVry University-Texas (about 47 miles; Irving, TX ; FT enrollment: 4,098)
North Lake College (about 49 miles; Irving, TX ; FT enrollment: 6,191)
University of North Texas (about 49 miles; Denton, TX ; FT enrollment: 31,694)
Public high schools in Weatherford: WEATHERFORD H S Students: 1,578, Location: 2121 BETHEL RD, Grades: 9-12)CROSSTIMBERS ACADEMY Students: 149, Location: 242 HARMONY RD, Grades: 9-12, Charter school )PEASTER H S Location: 3600 HARWELL LK RD, Grades: 9-12)
Private high school in Weatherford: VICTORY BAPTIST ACADEMY Students: 95, Location: 1311 E BANKHEAD DR, Grades: PK-11)
Biggest public elementary/middle schools in Weatherford: IKARD EL Students: 614, Location: 100 IKARD LN, Grades: PK-6)TISON MIDDLE Students: 599, Location: 102 MEADOW VIEW RD, Grades: 7-8)GARNER EL Students: 204, Location: 2222 GARNER SCHOOL RD, Grades: PK-8)PEASTER EL Location: 3400 HARWELL LK RD, Grades: PK-5)
CROCKETT EL Location: 1015 JAMESON, Grades: PK-6)
WRIGHT EL Location: 1309 W CHARLES ST, Grades: PK-6)
HALL MIDDLE Location: 902 CHARLES, Grades: 7-8)
CURTIS EL Location: 501 W RUSSELL, Grades: PK-6)
AUSTIN EL Location: 1776 TEXAS DR, Grades: PK-6)
MARTIN EL Location: 719 N OAK RDG DR, Grades: PK-6)
Private elementary/middle schools in Weatherford: COUTS CHRISTIAN ACADEMY Students: 161, Location: 802 N ELM ST, Grades: PK-6)
THE ACADEMY Students: 51, Location: 1200 S MAIN ST, Grades: PK-7)
See full list of schools located in Weatherford Library in Weatherford: WEATHERFORD PUBLIC LIBRARY Operating income: $1,131,118; Location: 1014 CHARLES ST; 81,700 books ; 3,360 audio materials ; 7,450 video materials ; 1 local licensed databases ; 50 state licensed databases ; 150 print serial subscriptions )
User-submitted facts and corrections:
Hospital is no longer Campbell Health System...Is now Weatherford Regional Medical Center...address and phone stayed the same added by Community Partner
Notable locations in Weatherford: (A) , Live Oak Country Club (B) , Weatherford Downtown Historic District (C) , Holland Lake Park (D) , Parker County Courthouse (E) , Parker County Fire Marshal's Office (F) , Weatherford Fire Department Station 1 (G) , Weatherford Fire Department Station 2 (H) , Parker County Museum and Trading Post (I) , Weatherford Fire Department Station 3 (J) , Life Care Emergency Medical Services (K) , The Double Log Cabin (L) . Display/hide their locations on the map
Churches in Weatherford include: (A) , Church of God (B) , Willow Park Church of Christ (C) , Church of Christ (D) , Church of Christ - Spanish Ministries (E) , Church of Christ - South Main (F) , Church of Christ (G) , Saint Stephens Catholic Church (H) , Victory Baptist Church (I) . Display/hide their locations on the map
Cemeteries: (1) , Curtis Cemetery (2) , Hill Crest Cemetery (3) . Display/hide their locations on the map
Lakes and reservoirs: (A) , Lake Weatherford (B) , Sunshine Lake (C) . Display/hide their locations on the map
Streams, rivers, and creeks: (A) , Hays Branch (B) , Black Warrior Branch (C) . Display/hide their locations on the map
Parks in Weatherford include: (1) , Soldier Springs Park (2) , McGratton Park (3) , Chandor Gardens (4) , Kangaroo Stadium (5) , Cherry Park (6) . Display/hide their locations on the map
Tourist attraction: (1) . Display/hide its approximate location on the map
Hotels: (1) , Best Western Santa Fe Inn (1927 Santa Fe Drive) (2) , Best Value Inn (111 West Interstate 20) (3) , Comfort Inn (809 Palo Pinto St) (4) . Display/hide their approximate locations on the map
Birthplace of: Mary Martin - Actress, Matt Williams (American football) - Football player, Stephen Carpenter (writer) - Cinematographer, William Hood Simpson - General, Joe Bertram Frantz - Historian, Rip Collins - Baseball player, Kapron Lewis-Moore - Football player, Keith Ranspot - Football player.
Parker County has a predicted average indoor radon screening level less than 2 pCi/L (pico curies per liter) - Low Potential Drinking water stations with addresses in Weatherford and their reported violations in the past:
QUICK PICK FOOD STORE (Population served: 400, Groundwater):
Past monitoring violations:
One routine major monitoring violation
Population served: 156, Groundwater):
Past monitoring violations:
Initial Tap Sampling for Pb and Cu - In JUL-01-2014, Contaminant: Lead and Copper Rule
Initial Tap Sampling for Pb and Cu - In JAN-01-2014, Contaminant: Lead and Copper Rule. Follow-up actions: St Formal NOV issued (JUL-18-2014)
Monitoring and Reporting (DBP) - Between JAN-2014 and MAR-2014, Contaminant: Chlorine. Follow-up actions: St Public Notif requested (JUL-02-2014), St Violation/Reminder Notice (JUL-02-2014), St Formal NOV issued (JUL-18-2014)
Monitoring and Reporting (DBP) - Between OCT-2013 and DEC-2013, Contaminant: Chlorine. Follow-up actions: St Public Notif requested (MAY-20-2014), St Violation/Reminder Notice (MAY-20-2014), St Formal NOV issued (JUL-18-2014)
Initial Tap Sampling for Pb and Cu - In JUL-01-2013, Contaminant: Lead and Copper Rule. Follow-up actions: St Formal NOV issued (JUL-18-2014)
2 routine major monitoring violations
59 regular monitoring violations
24 other older monitoring violations
Population served: 118, Groundwater):
Past health violations:
MCL, Monthly (TCR) - In DEC-2010, Contaminant: Coliform. Follow-up actions: St Compliance achieved (DEC-31-2010), St Public Notif received (JAN-06-2011), St Public Notif requested (JAN-14-2011), St Violation/Reminder Notice (JAN-14-2011)
Population served: 100, Groundwater):
Past health violations:
MCL, Monthly (TCR) - In MAY-2013, Contaminant: Coliform. Follow-up actions: St Public Notif requested (MAY-17-2013), St Violation/Reminder Notice (MAY-17-2013), St Public Notif received (MAY-30-2013)
MCL, Monthly (TCR) - In NOV-2011, Contaminant: Coliform. Follow-up actions: St Public Notif requested (NOV-22-2011), St Violation/Reminder Notice (NOV-22-2011), St Public Notif received (DEC-05-2011), St Compliance achieved (FEB-01-2012)
Past monitoring violations:
Monitoring, Source Water (GWR) - In MAY-01-2013, Contaminant: E. COLI. Follow-up actions: St Violation/Reminder Notice (AUG-01-2013), St Public Notif requested (AUG-01-2013)
9 routine major monitoring violations
3 minor monitoring violations
Population served: 100, Groundwater):
Past health violations:
MCL, Monthly (TCR) - In FEB-2010, Contaminant: Coliform. Follow-up actions: St Public Notif received (FEB-08-2010), St Violation/Reminder Notice (2 times from FEB-24-2010 to FEB-24-2010), St Public Notif requested (2 times from FEB-24-2010 to FEB-24-2010), St Compliance achieved (FEB-28-2010)
Past monitoring violations:
Monitoring, Repeat Major (TCR) - In FEB-2010, Contaminant: Coliform (TCR). Follow-up actions: St Compliance achieved (FEB-28-2010), St Public Notif requested (MAR-19-2010), St Violation/Reminder Notice (MAR-19-2010), St Public Notif received (JUL-19-2011)
8 routine major monitoring violations
Population served: 90, Groundwater):
Past monitoring violations:
One minor monitoring violation
One regular monitoring violation
Population served: 85, Groundwater):
Past health violations:
MCL, Monthly (TCR) - In AUG-2006, Contaminant: Coliform. Follow-up actions: St Compliance achieved (AUG-31-2006), St Public Notif requested (SEP-02-2006), St Violation/Reminder Notice (SEP-02-2006), St Public Notif received (OCT-02-2006)
MCL, Monthly (TCR) - In JUL-2006, Contaminant: Coliform. Follow-up actions: St Compliance achieved (JUL-31-2006), St Public Notif requested (AUG-02-2006), St Violation/Reminder Notice (AUG-02-2006), St Public Notif received (SEP-01-2006)
MCL, Monthly (TCR) - In MAR-2005, Contaminant: Coliform. Follow-up actions: St Compliance achieved (MAR-31-2005), St Public Notif requested (APR-02-2005), St Violation/Reminder Notice (APR-02-2005), St Public Notif received (MAY-02-2005)
Past monitoring violations:
One minor monitoring violation
Population served: 40, Groundwater):
Past monitoring violations:
2 routine major monitoring violations
Average household size: This city:
2.5 peopleTexas:
2.8 people
Percentage of family households: This city:
66.1%Whole state:
69.9%
Percentage of households with unmarried partners: This city:
5.7%Whole state:
6.0%
Likely homosexual households (counted as self-reported same-sex unmarried-partner households)
Lesbian couples: 0.3% of all households Gay men: 0.2% of all households
People in group quarters in Weatherford in 2010:
450 people in nursing facilities/skilled-nursing facilities
380 people in local jails and other municipal confinement facilities
214 people in college/university student housing
15 people in group homes for juveniles (non-correctional)
11 people in workers' group living quarters and job corps centers
7 people in group homes intended for adults
People in group quarters in Weatherford in 2000:
411 people in nursing homes
167 people in college dormitories (includes college quarters off campus)
153 people in local jails and other confinement facilities (including police lockups)
31 people in unknown juvenile institutions
24 people in other noninstitutional group quarters
11 people in homes for the mentally retarded
Banks with most branches in Weatherford (2011 data):
First National Bank Texas: Weatherford Banking Center - Rc 803 at 1836 South Main Street, Suite 102, branch established on 1999/10/20; Hudson Oaks Banking Center - Rc 899 at 2801 E I 20, branch established on 2005/08/24. Info updated 2006/11/03: Bank assets: $944.3 mil, Deposits: $815.9 mil, headquarters in Killeen, TX, positive income , Mortgage Lending Specialization, 250 total offices , Holding Company: First Community Bancshares, Inc.
First Financial Bank, National Association: College Park Branch at 101 College Park Drive, branch established on 1868/01/01; First Financial Bank, National Association at 101 North Main Street, branch established on 1984/07/16. Info updated 2009/06/26: Bank assets: $403.3 mil, Deposits: $342.7 mil, local headquarters , positive income , 7 total offices , Holding Company: First Financial Bankshares, Inc.
Compass Bank: Santa Fe Branch at 1400 Santa Fe Drive, branch established on 1968/09/30; Weatherford Main Branch at 102 North Main Street, branch established on 1997/06/23. Info updated 2011/02/24: Bank assets: $63,107.0 mil, Deposits: $46,232.4 mil, headquarters in Birmingham, AL, negative income in the last year , Commercial Lending Specialization, 720 total offices , Holding Company: Banco Bilbao Vizcaya Argentaria, S.A.
PlainsCapital Bank: Weatherford Branch at 1001 Santa Fe Drive, branch established on 2006/04/18. Info updated 2012/02/06: Bank assets: $5,681.5 mil, Deposits: $4,256.6 mil, headquarters in Dallas, TX, positive income , Commercial Lending Specialization, 33 total offices , Holding Company: Maedgen & White, Ltd.
American State Bank: Weatherford Branch at 1300 Santa Fe Drive, branch established on 2005/09/26. Info updated 2006/11/03: Bank assets: $3,079.1 mil, Deposits: $2,459.5 mil, headquarters in Lubbock, TX, positive income , Commercial Lending Specialization, 46 total offices , Holding Company: American State Financial Corporation
LegacyTexas Bank: Weatherford Banking Center Branch at 1111 Santa Fe Drive, branch established on 2008/08/04. Info updated 2006/11/03: Bank assets: $1,584.0 mil, Deposits: $1,355.7 mil, headquarters in Plano, TX, positive income , Commercial Lending Specialization, 19 total offices , Holding Company: Legacytexas Group, Inc.
First National Bank and Trust Company of Weatherford: First National Bank And Trust Compan at 220 Palo Pinto Street, branch established on 1880/05/15. Info updated 2006/11/03: Bank assets: $197.5 mil, Deposits: $178.7 mil, local headquarters , positive income , Commercial Lending Specialization, 1 total offices , Holding Company: First Baird Bancshares, Inc.
Citibank, National Association: 800 Santa Fe Branch at 800 Santa Fe Drive, branch established on 1927/01/01. Info updated 2012/01/10: Bank assets: $1,288,658.0 mil, Deposits: $882,541.0 mil, headquarters in Sioux Falls, SD, positive income , International Specialization, 1048 total offices , Holding Company: Citigroup Inc.
First State Bank of Mineral Wells: 06 Weatherford Branch at 1901 Wall Street, branch established on 2006/02/01. Info updated 2011/02/15: Bank assets: $109.2 mil, Deposits: $96.6 mil, headquarters in Mineral Wells, TX, positive income , Commercial Lending Specialization, 4 total offices , Holding Company: Mineral Wells Bancshares, Inc.
3 other banks with 3 local branches
For population 15 years and over in Weatherford:
Never married: 28.2%Now married: 47.0%Separated: 1.7%Widowed: 6.7%Divorced: 16.5% For population 25 years and over in Weatherford:
High school or higher: 90.9%Bachelor's degree or higher: 28.3%Graduate or professional degree: 8.8%Unemployed: 5.3%Mean travel time to work (commute): 25.8 minutes
Education Gini index (Inequality in education) Here:
10.5Texas average:
14.0
Religion statistics for Weatherford, TX (based on Parker County data)
Religion Adherents Congregations Evangelical Protestant 50,787 137 Mainline Protestant 8,284 23 Catholic 4,493 2 Other 999 5 None 52,364 -
Source: Clifford Grammich, Kirk Hadaway, Richard Houseal, Dale E.Jones, Alexei Krindatch, Richie Stanley and Richard H.Taylor. 2012. 2010 U.S.Religion Census: Religious Congregations & Membership Study. Association of Statisticians of American Religious Bodies. Jones, Dale E., et al. 2002. Congregations and Membership in the United States 2000. Nashville, TN: Glenmary Research Center. Graphs represent county-level data
Food Environment Statistics: Number of grocery stores : 10Here :
0.92 / 10,000 pop.Texas :
1.47 / 10,000 pop.
Number of supercenters and club stores : 2Parker County :
0.18 / 10,000 pop.State :
0.14 / 10,000 pop.
Number of convenience stores (no gas) : 4Parker County :
0.37 / 10,000 pop.Texas :
1.11 / 10,000 pop.
Number of convenience stores (with gas) : 45Here :
4.15 / 10,000 pop.Texas :
3.95 / 10,000 pop.
Number of full-service restaurants : 57Parker County :
5.26 / 10,000 pop.Texas :
6.13 / 10,000 pop.
Adult diabetes rate : Parker County :
9.1%Texas :
8.9%
Adult obesity rate : Parker County :
28.9%Texas :
26.6%
Low-income preschool obesity rate : Parker County :
13.4%Texas :
15.7%
Health and Nutrition: Healthy diet rate : Weatherford:
49.2%Texas:
48.6%
Average overall health of teeth and gums : This city:
45.5%Texas:
47.4%
Average BMI : Weatherford:
28.4State:
28.5
People feeling badly about themselves : Weatherford:
20.9%Texas:
20.6%
People not drinking alcohol at all : Weatherford:
10.7%State:
10.3%
Average hours sleeping at night : Overweight people : This city:
33.3%Texas:
33.1%
General health condition : This city:
55.2%Texas:
56.2%
Average condition of hearing : Weatherford:
77.6%State:
80.7%
More about Health and Nutrition of Weatherford, TX Residents
Local government employment and payroll (March 2022)
Function
Full-time employees
Monthly full-time payroll
Average yearly full-time wage
Part-time employees
Monthly part-time payroll
Police Protection - Officers
57 $289,117 $60,867 5 $10,522 Firefighters
51 $401,800 $94,541 0 $0 Water Supply
41 $165,611 $48,472 0 $0 Other Government Administration
27 $183,485 $81,549 5 $500 Electric Power
27 $128,070 $56,920 0 $0 Parks and Recreation
22 $93,381 $50,935 0 $0 Police - Other
21 $84,858 $48,490 1 $281 Solid Waste Management
18 $64,363 $42,909 0 $0 Health
17 $61,940 $43,722 0 $0 Streets and Highways
16 $85,892 $64,419 0 $0 Financial Administration
12 $27,811 $27,811 0 $0 Local Libraries
10 $42,807 $51,368 3 $3,392 Other and Unallocable
7 $26,385 $45,231 0 $0 Fire - Other
5 $20,168 $48,403 0 $0 Sewerage
4 $24,512 $73,536 0 $0 Judicial and Legal
3 $11,922 $47,688 0 $0
Totals for Government
338 $1,712,122 $60,785 14 $14,696
Weatherford government finances - Expenditure in 2021 (per resident):
Construction - Water Utilities: $7,464,000 ($205.90)
Sewerage: $4,179,000 ($115.28)Parks and Recreation: $3,272,000 ($90.26)Electric Utilities: $2,894,000 ($79.83)Regular Highways: $1,656,000 ($45.68)Health - Other: $1,072,000 ($29.57)Current Operations - Electric Utilities: $14,520,000 ($400.54)
Water Utilities: $10,908,000 ($300.90)Police Protection: $9,290,000 ($256.27)Local Fire Protection: $7,269,000 ($200.52)Central Staff Services: $7,140,000 ($196.96)Regular Highways: $4,530,000 ($124.96)Sewerage: $3,908,000 ($107.80)Parks and Recreation: $3,821,000 ($105.40)Financial Administration: $2,645,000 ($72.96)Solid Waste Management: $2,641,000 ($72.85)Protective Inspection and Regulation - Other: $1,476,000 ($40.72)Health - Other: $1,410,000 ($38.90)Libraries: $1,114,000 ($30.73)General Public Buildings: $877,000 ($24.19)Judicial and Legal Services: $330,000 ($9.10)General - Other: $186,000 ($5.13)Electric Utilities - Interest on Debt: $1,320,000 ($36.41)
General - Interest on Debt: $1,356,000 ($37.41)
Intergovernmental to Local - Other - Electric Utilities: $18,068,000 ($498.41)
Other - Financial Administration: $220,000 ($6.07)Other Capital Outlay - Parks and Recreation: $151,000 ($4.17)
General Public Building: $96,000 ($2.65)Health - Other: $94,000 ($2.59)Police Protection: $70,000 ($1.93)Regular Highways: $57,000 ($1.57)Local Fire Protection: $54,000 ($1.49)Central Staff Services: $19,000 ($0.52)Total Salaries and Wages: $25,735,000 ($709.91)
Weatherford government finances - Revenue in 2021 (per resident):
Charges - Sewerage: $7,177,000 ($197.98)
Solid Waste Management: $2,538,000 ($70.01)Parks and Recreation: $809,000 ($22.32)Other: $21,000 ($0.58)Local Intergovernmental - Other: $1,794,000 ($49.49)
Miscellaneous - Interest Earnings: $2,071,000 ($57.13)
General Revenue - Other: $1,293,000 ($35.67)Rents: $1,237,000 ($34.12)Royalties: $384,000 ($10.59)Fines and Forfeits: $305,000 ($8.41)Donations From Private Sources: $119,000 ($3.28)Sale of Property: $97,000 ($2.68)Revenue - Electric Utilities: $36,167,000 ($997.68)
Water Utilities: $19,110,000 ($527.16)State Intergovernmental - Highways: $731,000 ($20.16)
General Local Government Support: $577,000 ($15.92)Water Utilities: $114,000 ($3.14)Other: $18,000 ($0.50)Tax - General Sales and Gross Receipts: $15,634,000 ($431.27)
Property: $13,442,000 ($370.80)Public Utilities Sales: $834,000 ($23.01)Other License: $797,000 ($21.99)Occupation and Business License - Other: $768,000 ($21.19)Alcoholic Beverage License: $19,000 ($0.52)
Weatherford government finances - Debt in 2021 (per resident):
Long Term Debt - Beginning Outstanding - Unspecified Public Purpose: $95,242,000 ($2627.29)
Outstanding Unspecified Public Purpose: $86,539,000 ($2387.22)Retired Unspecified Public Purpose: $39,953,000 ($1102.12)Issue, Unspecified Public Purpose: $31,250,000 ($862.05)Short Term Debt Outstanding - Beginning: $7,515,000 ($207.30)
End of Fiscal Year: $5,795,000 ($159.86)
Weatherford government finances - Cash and Securities in 2021 (per resident):
Other Funds - Cash and Securities: $10,463,000 ($288.63)
12.84% of this county's 2021 resident taxpayers lived in other counties in 2020 ($89,033 average adjusted gross income )
Here:
12.84%Texas average:
8.12%
0.03% of residents moved from foreign countries ($194 average AGI )Parker County:
0.03%Texas average:
0.04%
Top counties from which taxpayers relocated into this county between 2020 and 2021:
Businesses in Weatherford, TX
Name Count Name Count
AT&T 2 KFC 1 Ace Hardware 1 Kohl's 1 Albertsons 1 La Quinta 1 Applebee's 1 La-Z-Boy 1 Arby's 1 Lane Furniture 1 AutoZone 1 Little Caesars Pizza 1 Bed Bath & Beyond 1 Long John Silver's 1 Best Western 1 Lowe's 1 Blockbuster 1 Marriott 1 Burger King 1 Maurices 1 CVS 1 McDonald's 1 Chevrolet 1 Motel 6 1 Chick-Fil-A 1 Nike 4 Cinnabon 1 Nissan 1 Circle K 1 OfficeMax 1 Comfort Suites 1 Olive Garden 1 Cracker Barrel 1 On The Border 1 Dairy Queen 3 Payless 1 Dennys 1 PetSmart 1 Discount Tire 1 Pizza Hut 1 Domino's Pizza 1 RadioShack 1 Econo Lodge 1 Rue21 1 Famous Footwear 1 SONIC Drive-In 3 FedEx 10 Sears 1 Firestone Complete Auto Care 1 Sprint Nextel 1 Ford 1 Starbucks 2 GNC 2 Super 8 1 GameStop 1 T-Mobile 2 Goodwill 2 Taco Bell 1 H&R Block 2 Target 1 Hilton 1 Toyota 1 Holiday Inn 2 U-Haul 4 Home Depot 1 UPS 7 IHOP 1 Vans 2 JCPenney 1 Waffle House 1 Jack In The Box 2 Walmart 1 Jones New York 1 Wendy's 2 Justice 1
Strongest AM radio stations in Weatherford:
KZEE (1220 AM; 0 kW; WEATHERFORD, TX; Owner: TARRANT RADIO BROADCASTING, INC.)
KAHZ (1360 AM; 50 kW; HURST, TX)
WBAP (820 AM; 50 kW; FORT WORTH, TX; Owner: WBAP-KSCS OPERATING, LTD.)
KESS (1270 AM; 50 kW; FORT WORTH, TX; Owner: KESS-AM LICENSE CORP.)
KZMP (1540 AM; 50 kW; UNIVERSITY PARK, TX; Owner: ENTRAVISION HOLDINGS, LLC)
KHVN (970 AM; 10 kW; FORT WORTH, TX; Owner: MORTENSON BROADCASTING COMPANY)
KRLD (1080 AM; 50 kW; DALLAS, TX; Owner: TEXAS INFINITY BROADCASTING L.P.)
KBIS (1150 AM; 25 kW; HIGHLAND PARK, TX; Owner: DALLAS AM RADIO PARTNERS, L.P.)
KSKY (660 AM; 20 kW; BALCH SPRINGS, TX; Owner: BISON MEDIA, INC.)
KFXR (1190 AM; 50 kW; DALLAS, TX; Owner: CLEAR CHANNEL BROADCASTING LICENSES, INC.)
KNAX (1630 AM; 10 kW; FT. WORTH, TX; Owner: MORTENSON BROADCASTING COMPANY)
KTNO (1440 AM; 12 kW; DENTON, TX; Owner: MORTENSON BROADCASTING COMPANY)
KLIF (570 AM; 5 kW; DALLAS, TX; Owner: KLIF LICO, INC.)
Strongest FM radio stations in Weatherford:
KYQX (89.5 FM; WEATHERFORD, TX; Owner: CSSI NON-PROFIT EDUCATIONAL BROADCASTING CORPORATION)
KDXX (107.1 FM; BENBROOK, TX; Owner: KCYT-FM LICENSE CORP.)
KFWR (95.9 FM; MINERAL WELLS, TX; Owner: LKCM RADIO GROUP, LP)
KTFW-FM (92.1 FM; GLEN ROSE, TX; Owner: M&M BROADCASTERS, LTD.)
KRNB (105.7 FM; DECATUR, TX; Owner: SERVICE BROADCASTING I, LTD.)
KDKR (91.3 FM; DECATUR, TX; Owner: CSN INTERNATIONAL)
KMEO (96.7 FM; FLOWER MOUND, TX; Owner: ABC, INC.)
KKDL (106.7 FM; MUENSTER, TX; Owner: ENTRAVISION HOLDINGS, LLC)
KZMP-FM (101.7 FM; AZLE, TX; Owner: ENTRAVISION HOLDINGS, LLC)
KHCK-FM (99.1 FM; DENTON, TX; Owner: KHCK-FM LICENSE CORP.)
KLLI (105.3 FM; DALLAS, TX; Owner: INFINITY BROADCASTING CORPORATION OF DALLAS)
KRBV (100.3 FM; DALLAS, TX; Owner: INFINITY BROADCASTING CORP. OF FORT WORTH)
KPLX (99.5 FM; FORT WORTH, TX; Owner: KPLX LICO, INC.)
KNOR (93.7 FM; HEALDTON, OK; Owner: AM & PM BROADCASTERS, LLC)
KKDA-FM (104.5 FM; DALLAS, TX; Owner: SERVICE BROADCASTING I, LTD.)
KZPS (92.5 FM; DALLAS, TX; Owner: AMFM TEXAS LICENSES LIMITED PARTNERSHIP)
KHKS (106.1 FM; DENTON, TX; Owner: AMFM TEXAS LICENSES LIMITED PARTNERSHIP)
KVIL-FM (103.7 FM; HIGHLAND PARK-DALLAS, TX; Owner: INFINITY BROADCASTING CORPORATION OF TEXAS)
KOAI (107.5 FM; FORT WORTH, TX; Owner: INFINITY KOAI-FM, INC.)
KEGL (97.1 FM; FORT WORTH, TX; Owner: CITICASTERS LICENSES, L.P.)
TV broadcast stations around Weatherford:
KFWD (Channel 52; FORT WORTH, TX; Owner: HIC BROADCAST, INC.)
KTVT (Channel 11; FORT WORTH, TX; Owner: CBS STATIONS GROUP OF TEXAS L.P.)
KXAS-TV (Channel 5; FORT WORTH, TX; Owner: STATION VENTURE OPERATIONS, LP)
KDTN (Channel 2; DENTON, TX; Owner: NORTH TEXAS PUBLIC BROADCASTING, INC.)
KUVN-CA (Channel 31; FORT WORTH, TX; Owner: KUVN LICENSE PARTNERSHIP, L.P.)
KSTR-TV (Channel 49; IRVING, TX; Owner: TELEFUTURA DALLAS LLC)
KPXD (Channel 68; ARLINGTON, TX; Owner: PAXSON DALLAS LICENSE, INC.)
KUVN (Channel 23; GARLAND, TX; Owner: KUVN LICENSE PARTNERSHIP, L.P.)
KTXA (Channel 21; FORT WORTH, TX; Owner: VIACOM TELEVISION STATIONS GROUP OF DALLAS/FORT WORTH L.P.)
KMPX (Channel 29; DECATUR, TX; Owner: WORD OF GOD FELLOWSHIP, INC.)
WFAA-TV (Channel 8; DALLAS, TX; Owner: WFAA-TV, L.P.)
KDAF (Channel 33; DALLAS, TX; Owner: TRIBUNE TELEVISION COMPANY)
KDFW (Channel 4; DALLAS, TX; Owner: KDFW LICENSE, INC.)
KERA-TV (Channel 13; DALLAS, TX; Owner: NORTH TEXAS PUBLIC BROADCASTING, INC.)
KDFI (Channel 27; DALLAS, TX; Owner: NEW DMIC, INC.)
KXTX-TV (Channel 39; DALLAS, TX; Owner: TELEMUNDO OF TEXAS PARTNERSHIP, LP)
KDTX-TV (Channel 58; DALLAS, TX; Owner: TRINITY BROADCASTING OF TEXAS, INC.)
KLDT (Channel 55; LAKE DALLAS, TX; Owner: JOHNSON BROADCASTING OF DALLAS, INC.)
National Bridge Inventory (NBI) Statistics 119 Number of bridges1,375ft / 419m Total length $498,000 Total costs1,471,291 Total average daily traffic288,829 Total average daily truck traffic
New bridges - historical statistics
1 1910-1919 7 1930-1939 3 1940-1949 3 1950-1959 41 1960-1969 4 1970-1979 2 1980-1989 9 1990-1999 21 2000-2009 28 2010-2019
See full National Bridge Inventory statistics for Weatherford, TX
Home Mortgage Disclosure Act Aggregated Statistics For Year 2009(Based on 1 full and 2 partial tracts) A) FHA, FSA/RHS & VA B) Conventional C) Refinancings D) Home Improvement Loans E) Loans on Dwellings For 5+ Families F) Non-occupant Loans on G) Loans On Manufactured Number Average Value Number Average Value Number Average Value Number Average Value Number Average Value Number Average Value Number Average Value
LOANS ORIGINATED 85 $118,033 52 $89,458 96 $117,046 12 $34,305 1 $5,886,000 29 $79,013 0 $0 APPLICATIONS APPROVED, NOT ACCEPTED 2 $87,795 3 $71,073 15 $119,497 5 $52,706 0 $0 2 $96,945 0 $0 APPLICATIONS DENIED 16 $103,746 17 $84,384 54 $101,998 17 $24,505 0 $0 8 $95,744 5 $63,394 APPLICATIONS WITHDRAWN 6 $99,048 6 $78,593 35 $126,527 5 $63,718 0 $0 5 $95,478 0 $0 FILES CLOSED FOR INCOMPLETENESS 0 $0 1 $113,000 10 $78,930 1 $10,000 0 $0 1 $69,510 0 $0
Aggregated Statistics For Year 2008(Based on 1 full and 2 partial tracts) A) FHA, FSA/RHS & VA B) Conventional C) Refinancings D) Home Improvement Loans E) Loans on Dwellings For 5+ Families F) Non-occupant Loans on G) Loans On Manufactured Number Average Value Number Average Value Number Average Value Number Average Value Number Average Value Number Average Value Number Average Value
LOANS ORIGINATED 97 $122,633 103 $110,210 91 $105,296 22 $38,497 1 $532,760 36 $116,376 1 $22,930 APPLICATIONS APPROVED, NOT ACCEPTED 6 $125,020 15 $123,463 14 $105,834 6 $69,485 0 $0 6 $133,858 5 $98,592 APPLICATIONS DENIED 12 $95,513 23 $85,892 66 $99,846 29 $48,916 1 $2,800,000 10 $112,125 5 $41,218 APPLICATIONS WITHDRAWN 9 $126,244 9 $109,047 28 $91,698 2 $45,790 0 $0 5 $93,876 0 $0 FILES CLOSED FOR INCOMPLETENESS 4 $109,710 3 $176,933 10 $161,140 0 $0 2 $2,210,365 2 $115,030 0 $0
Aggregated Statistics For Year 2007(Based on 1 full and 2 partial tracts) A) FHA, FSA/RHS & VA B) Conventional C) Refinancings D) Home Improvement Loans E) Loans on Dwellings For 5+ Families F) Non-occupant Loans on G) Loans On Manufactured Number Average Value Number Average Value Number Average Value Number Average Value Number Average Value Number Average Value Number Average Value
LOANS ORIGINATED 44 $121,101 262 $124,580 94 $96,887 50 $24,207 0 $0 102 $137,347 4 $52,108 APPLICATIONS APPROVED, NOT ACCEPTED 1 $116,000 25 $94,831 21 $89,649 6 $29,872 0 $0 11 $115,138 5 $71,472 APPLICATIONS DENIED 12 $110,673 72 $123,865 127 $102,366 39 $41,200 1 $4,560,000 44 $125,230 4 $43,900 APPLICATIONS WITHDRAWN 2 $154,560 29 $110,683 69 $97,209 7 $51,909 1 $885,000 16 $147,352 0 $0 FILES CLOSED FOR INCOMPLETENESS 1 $101,990 7 $91,677 23 $103,707 2 $11,860 0 $0 1 $56,000 0 $0
Aggregated Statistics For Year 2006(Based on 1 full and 2 partial tracts) A) FHA, FSA/RHS & VA B) Conventional C) Refinancings D) Home Improvement Loans E) Loans on Dwellings For 5+ Families F) Non-occupant Loans on G) Loans On Manufactured Number Average Value Number Average Value Number Average Value Number Average Value Number Average Value Number Average Value Number Average Value
LOANS ORIGINATED 41 $107,175 280 $85,139 113 $95,335 27 $43,316 2 $305,000 79 $69,716 4 $47,610 APPLICATIONS APPROVED, NOT ACCEPTED 3 $62,767 42 $61,746 22 $96,583 7 $35,830 0 $0 16 $61,373 5 $56,944 APPLICATIONS DENIED 9 $142,527 85 $85,554 117 $96,874 27 $34,473 0 $0 21 $79,357 9 $42,308 APPLICATIONS WITHDRAWN 2 $77,840 36 $81,977 77 $84,860 6 $32,003 0 $0 5 $67,220 1 $42,210 FILES CLOSED FOR INCOMPLETENESS 1 $79,060 5 $77,808 31 $96,739 1 $62,420 0 $0 1 $39,000 0 $0
Aggregated Statistics For Year 2005(Based on 1 full and 2 partial tracts) A) FHA, FSA/RHS & VA B) Conventional C) Refinancings D) Home Improvement Loans E) Loans on Dwellings For 5+ Families F) Non-occupant Loans on G) Loans On Manufactured Number Average Value Number Average Value Number Average Value Number Average Value Number Average Value Number Average Value Number Average Value
LOANS ORIGINATED 42 $107,035 295 $84,070 142 $91,064 38 $49,216 3 $1,480,570 79 $92,133 1 $56,960 APPLICATIONS APPROVED, NOT ACCEPTED 2 $92,895 23 $60,520 20 $108,670 6 $21,657 0 $0 3 $111,227 4 $40,965 APPLICATIONS DENIED 4 $95,058 67 $70,242 132 $91,792 33 $25,235 0 $0 31 $70,550 18 $47,494 APPLICATIONS WITHDRAWN 7 $99,647 34 $107,155 102 $107,501 16 $185,595 0 $0 6 $70,260 2 $120,170 FILES CLOSED FOR INCOMPLETENESS 2 $71,470 11 $89,316 26 $105,215 2 $23,955 0 $0 4 $74,695 0 $0
Aggregated Statistics For Year 2004(Based on 1 full and 2 partial tracts) A) FHA, FSA/RHS & VA B) Conventional C) Refinancings D) Home Improvement Loans E) Loans on Dwellings For 5+ Families F) Non-occupant Loans on G) Loans On Manufactured Number Average Value Number Average Value Number Average Value Number Average Value Number Average Value Number Average Value Number Average Value
LOANS ORIGINATED 50 $104,551 228 $78,634 192 $89,410 35 $37,979 4 $2,915,108 73 $70,665 14 $44,463 APPLICATIONS APPROVED, NOT ACCEPTED 3 $106,203 37 $77,321 36 $85,626 5 $32,690 0 $0 8 $73,428 25 $54,836 APPLICATIONS DENIED 6 $108,283 111 $66,195 154 $86,663 25 $24,616 0 $0 34 $75,103 64 $47,962 APPLICATIONS WITHDRAWN 7 $98,573 39 $96,246 97 $85,243 7 $97,466 0 $0 13 $102,052 0 $0 FILES CLOSED FOR INCOMPLETENESS 1 $127,000 4 $55,658 27 $93,171 2 $73,130 0 $0 3 $31,160 0 $0
Aggregated Statistics For Year 2003(Based on 1 full and 2 partial tracts) A) FHA, FSA/RHS & VA B) Conventional C) Refinancings D) Home Improvement Loans E) Loans on Dwellings For 5+ Families F) Non-occupant Loans on Number Average Value Number Average Value Number Average Value Number Average Value Number Average Value Number Average Value
LOANS ORIGINATED 30 $96,572 223 $81,271 307 $88,952 34 $19,619 3 $3,898,667 95 $80,862 APPLICATIONS APPROVED, NOT ACCEPTED 2 $35,970 28 $89,323 45 $80,302 5 $29,078 0 $0 16 $94,322 APPLICATIONS DENIED 4 $66,270 80 $88,029 154 $80,675 26 $28,806 1 $395,300 28 $123,306 APPLICATIONS WITHDRAWN 1 $89,600 27 $96,438 100 $88,532 2 $18,580 0 $0 13 $98,183 FILES CLOSED FOR INCOMPLETENESS 1 $70,000 9 $103,389 20 $74,788 2 $44,285 0 $0 4 $35,478
Aggregated Statistics For Year 2002(Based on 1 full and 2 partial tracts) A) FHA, FSA/RHS & VA B) Conventional C) Refinancings D) Home Improvement Loans F) Non-occupant Loans on Number Average Value Number Average Value Number Average Value Number Average Value Number Average Value
LOANS ORIGINATED 57 $101,947 212 $76,600 219 $86,933 36 $24,144 64 $94,459 APPLICATIONS APPROVED, NOT ACCEPTED 5 $74,152 25 $93,330 20 $64,169 5 $21,966 5 $64,154 APPLICATIONS DENIED 6 $102,597 59 $66,813 92 $73,127 26 $23,659 22 $88,544 APPLICATIONS WITHDRAWN 8 $88,732 28 $126,218 63 $72,993 5 $13,624 12 $129,123 FILES CLOSED FOR INCOMPLETENESS 2 $84,590 16 $89,794 12 $83,032 2 $31,860 6 $84,678
Aggregated Statistics For Year 2001(Based on 1 full and 2 partial tracts) A) FHA, FSA/RHS & VA B) Conventional C) Refinancings D) Home Improvement Loans E) Loans on Dwellings For 5+ Families F) Non-occupant Loans on Number Average Value Number Average Value Number Average Value Number Average Value Number Average Value Number Average Value
LOANS ORIGINATED 79 $88,515 180 $75,938 156 $84,046 40 $19,607 1 $1,525,000 43 $59,405 APPLICATIONS APPROVED, NOT ACCEPTED 8 $104,626 26 $61,008 16 $56,351 5 $27,096 0 $0 6 $58,440 APPLICATIONS DENIED 7 $75,750 70 $66,907 67 $71,915 19 $21,269 1 $126,500 14 $81,659 APPLICATIONS WITHDRAWN 6 $87,123 16 $92,849 54 $83,438 6 $44,395 0 $0 3 $57,183 FILES CLOSED FOR INCOMPLETENESS 1 $126,420 11 $56,183 10 $75,331 0 $0 0 $0 0 $0
Aggregated Statistics For Year 2000(Based on 1 full and 2 partial tracts) A) FHA, FSA/RHS & VA B) Conventional C) Refinancings D) Home Improvement Loans E) Loans on Dwellings For 5+ Families F) Non-occupant Loans on Number Average Value Number Average Value Number Average Value Number Average Value Number Average Value Number Average Value
LOANS ORIGINATED 60 $80,990 166 $78,683 58 $65,237 44 $18,683 1 $92,000 46 $49,303 APPLICATIONS APPROVED, NOT ACCEPTED 5 $82,826 43 $52,090 15 $80,025 8 $14,972 0 $0 2 $65,385 APPLICATIONS DENIED 8 $73,565 107 $51,537 39 $55,711 27 $11,577 0 $0 8 $58,819 APPLICATIONS WITHDRAWN 11 $77,637 23 $76,577 21 $59,389 3 $52,533 0 $0 3 $43,507 FILES CLOSED FOR INCOMPLETENESS 1 $61,000 7 $71,514 11 $79,068 0 $0 0 $0 2 $46,290
Aggregated Statistics For Year 1999(Based on 1 full and 2 partial tracts) A) FHA, FSA/RHS & VA B) Conventional C) Refinancings D) Home Improvement Loans E) Loans on Dwellings For 5+ Families F) Non-occupant Loans on Number Average Value Number Average Value Number Average Value Number Average Value Number Average Value Number Average Value
LOANS ORIGINATED 64 $76,503 179 $71,652 95 $67,499 33 $21,837 1 $330,160 56 $64,340 APPLICATIONS APPROVED, NOT ACCEPTED 1 $104,760 49 $57,525 25 $77,016 9 $14,883 0 $0 4 $18,092 APPLICATIONS DENIED 6 $83,325 199 $72,251 40 $96,822 36 $12,583 0 $0 21 $99,041 APPLICATIONS WITHDRAWN 4 $85,418 27 $92,912 37 $74,450 2 $23,135 0 $0 5 $76,206 FILES CLOSED FOR INCOMPLETENESS 0 $0 7 $69,044 13 $73,950 1 $38,880 0 $0 4 $74,562
Detailed HMDA statistics for the following Tracts:
1401.00
, 1402.00 , 1403.00
Private Mortgage Insurance Companies Aggregated Statistics For Year 2009(Based on 1 full and 2 partial tracts) A) Conventional B) Refinancings C) Non-occupant Loans on Number Average Value Number Average Value Number Average Value
LOANS ORIGINATED 8 $103,524 4 $151,305 0 $0 APPLICATIONS APPROVED, NOT ACCEPTED 3 $100,023 1 $153,550 0 $0 APPLICATIONS DENIED 1 $149,460 1 $90,130 0 $0 APPLICATIONS WITHDRAWN 0 $0 0 $0 0 $0 FILES CLOSED FOR INCOMPLETENESS 0 $0 1 $57,000 1 $57,000
Aggregated Statistics For Year 2008(Based on 1 full and 2 partial tracts) A) Conventional B) Refinancings C) Non-occupant Loans on Number Average Value Number Average Value Number Average Value
LOANS ORIGINATED 36 $121,708 10 $132,092 8 $99,015 APPLICATIONS APPROVED, NOT ACCEPTED 9 $124,276 9 $128,880 2 $94,200 APPLICATIONS DENIED 1 $94,000 1 $146,240 0 $0 APPLICATIONS WITHDRAWN 4 $95,055 0 $0 0 $0 FILES CLOSED FOR INCOMPLETENESS 1 $59,290 0 $0 1 $107,630
Aggregated Statistics For Year 2007(Based on 1 full and 2 partial tracts) A) Conventional B) Refinancings C) Non-occupant Loans on Number Average Value Number Average Value Number Average Value
LOANS ORIGINATED 90 $116,542 7 $101,619 17 $87,400 APPLICATIONS APPROVED, NOT ACCEPTED 10 $108,385 0 $0 2 $56,035 APPLICATIONS DENIED 0 $0 0 $0 0 $0 APPLICATIONS WITHDRAWN 5 $133,838 0 $0 0 $0 FILES CLOSED FOR INCOMPLETENESS 2 $76,295 0 $0 0 $0
Aggregated Statistics For Year 2006(Based on 1 full and 2 partial tracts) A) Conventional B) Refinancings C) Non-occupant Loans on Number Average Value Number Average Value Number Average Value
LOANS ORIGINATED 66 $110,062 7 $123,413 14 $91,554 APPLICATIONS APPROVED, NOT ACCEPTED 4 $120,878 3 $115,600 0 $0 APPLICATIONS DENIED 0 $0 1 $58,500 1 $58,500 APPLICATIONS WITHDRAWN 2 $99,100 1 $73,530 1 $55,340 FILES CLOSED FOR INCOMPLETENESS 0 $0 0 $0 0 $0
Aggregated Statistics For Year 2005(Based on 1 full and 2 partial tracts) A) Conventional B) Refinancings C) Non-occupant Loans on Number Average Value Number Average Value Number Average Value
LOANS ORIGINATED 53 $96,060 10 $122,803 8 $73,694 APPLICATIONS APPROVED, NOT ACCEPTED 7 $103,781 0 $0 0 $0 APPLICATIONS DENIED 0 $0 0 $0 0 $0 APPLICATIONS WITHDRAWN 2 $76,845 0 $0 0 $0 FILES CLOSED FOR INCOMPLETENESS 0 $0 0 $0 0 $0
Aggregated Statistics For Year 2004(Based on 1 full and 2 partial tracts) A) Conventional B) Refinancings C) Non-occupant Loans on Number Average Value Number Average Value Number Average Value
LOANS ORIGINATED 56 $87,112 19 $100,582 13 $78,772 APPLICATIONS APPROVED, NOT ACCEPTED 14 $79,773 9 $101,789 3 $53,803 APPLICATIONS DENIED 0 $0 0 $0 0 $0 APPLICATIONS WITHDRAWN 3 $155,103 3 $111,153 4 $136,358 FILES CLOSED FOR INCOMPLETENESS 0 $0 0 $0 0 $0
Aggregated Statistics For Year 2003(Based on 1 full and 2 partial tracts) A) Conventional B) Refinancings C) Non-occupant Loans on Number Average Value Number Average Value Number Average Value
LOANS ORIGINATED 80 $88,998 34 $119,311 18 $69,153 APPLICATIONS APPROVED, NOT ACCEPTED 12 $87,591 7 $114,287 7 $80,270 APPLICATIONS DENIED 2 $82,845 1 $230,000 2 $82,845 APPLICATIONS WITHDRAWN 4 $40,998 1 $90,850 3 $38,580 FILES CLOSED FOR INCOMPLETENESS 0 $0 0 $0 0 $0
Aggregated Statistics For Year 2002(Based on 1 full and 2 partial tracts) A) Conventional B) Refinancings C) Non-occupant Loans on Number Average Value Number Average Value Number Average Value
LOANS ORIGINATED 79 $89,686 21 $111,420 9 $81,139 APPLICATIONS APPROVED, NOT ACCEPTED 14 $130,073 2 $42,290 5 $155,000 APPLICATIONS DENIED 4 $100,240 1 $192,120 3 $136,000 APPLICATIONS WITHDRAWN 3 $84,343 2 $92,000 1 $83,010 FILES CLOSED FOR INCOMPLETENESS 1 $67,590 0 $0 0 $0
Aggregated Statistics For Year 2001(Based on 1 full and 2 partial tracts) A) Conventional B) Refinancings C) Non-occupant Loans on Number Average Value Number Average Value Number Average Value
LOANS ORIGINATED 57 $87,086 15 $113,433 8 $70,531 APPLICATIONS APPROVED, NOT ACCEPTED 4 $93,155 5 $92,138 0 $0 APPLICATIONS DENIED 2 $91,985 0 $0 0 $0 APPLICATIONS WITHDRAWN 0 $0 1 $78,270 0 $0 FILES CLOSED FOR INCOMPLETENESS 1 $130,580 1 $92,500 0 $0
Aggregated Statistics For Year 2000(Based on 1 full and 2 partial tracts) A) Conventional B) Refinancings C) Non-occupant Loans on Number Average Value Number Average Value Number Average Value
LOANS ORIGINATED 53 $89,754 3 $100,427 4 $65,895 APPLICATIONS APPROVED, NOT ACCEPTED 5 $87,488 1 $105,370 1 $68,000 APPLICATIONS DENIED 3 $93,700 0 $0 0 $0 APPLICATIONS WITHDRAWN 2 $91,520 0 $0 0 $0 FILES CLOSED FOR INCOMPLETENESS 3 $57,620 0 $0 0 $0
Aggregated Statistics For Year 1999(Based on 1 full and 2 partial tracts) A) Conventional B) Refinancings C) Non-occupant Loans on Number Average Value Number Average Value Number Average Value
LOANS ORIGINATED 41 $91,481 16 $100,304 5 $56,602 APPLICATIONS APPROVED, NOT ACCEPTED 6 $103,248 0 $0 0 $0 APPLICATIONS DENIED 3 $66,903 0 $0 1 $94,080 APPLICATIONS WITHDRAWN 2 $54,015 0 $0 0 $0 FILES CLOSED FOR INCOMPLETENESS 2 $122,700 0 $0 0 $0
Detailed PMIC statistics for the following Tracts:
1401.00
, 1402.00 , 1403.00 Fire-safe hotels and motels in Weatherford, Texas:
Quality Inn & Suites, 2500 S Main St, Weatherford, Texas 76087 Phone: (817) 599-3700, Fax: (817) 599-7131
Best Western Plus Cutting Horse & Suites, 210 Alford Dr, Weatherford, Texas 76086 Phone: (817) 599-3300, Fax: (817) 599-5342
Fairfield Inn & Suites, 175 Alford Dr, Weatherford, Texas 76086 Phone: (817) 599-4040, Fax: (817) 599-4097
Holiday Inn Express & Suites Weatherford, 850 Interstate 20 E, Weatherford, Texas 76087 Phone: (817) 599-3700, Fax: (817) 599-7131
Sleep Inn Suites, 1911 Wall St, Weatherford, Texas 76086 Phone: (817) 594-9699, Fax: (817) 594-9098
Candlewood Suites, 215 Alford Dr, Weatherford, Texas 76087 Phone: (817) 599-9999, Fax: (817) 599-9998
Motel 6 Weatherford, 150 Alford Dr, Weatherford, Texas 76087 Phone: (817) 594-1740, Fax: (817) 594-1771
Quality Inn and Suites, 5080 E Interstate 20 Service Rd S, Weatherford, Texas 76087 Phone: (817) 441-5443, Fax: (817) 441-5041
All 8 fire-safe hotels and motels in Weatherford, Texas
Most common first names in Weatherford, TX among deceased individuals Name Count Lived (average)
James 284 74.8 years Mary 250 79.0 years John 247 76.5 years William 229 76.5 years Robert 151 72.6 years Charles 142 73.0 years George 108 78.4 years Ruby 75 81.9 years Ruth 72 82.2 years Dorothy 69 78.2 years
Most common last names in Weatherford, TX among deceased individuals Last name Count Lived (average)
Smith 123 77.2 years Jones 122 75.2 years Williams 80 76.0 years Davis 78 75.7 years Johnson 69 76.5 years Young 60 79.2 years Brown 59 75.7 years Moore 58 77.3 years Walker 55 79.1 years Martin 54 75.8 years
Weatherford compared to Texas state average:
Unemployed percentage below state average. Black race population percentage significantly below state average. Median age above state average. Foreign-born population percentage below state average. Length of stay since moving in significantly above state average. Institutionalized population percentage above state average.
Top Patent Applicants
John T. Stites (136)
John Thomas Stites (48)
David P. Bingaman (30)
John R. Mccullough (15)
Eugene Edward Miller (14)
John Richard Mccullough (13)
John T. Hardesty (13)
Brian C. Witkowski (9)
Jess V. Ford (9)
Daniel M. Cloud (9)
Total of 485 patent applications in 2008-2024.
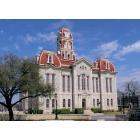
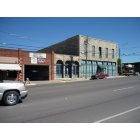
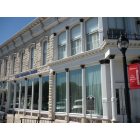
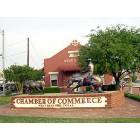
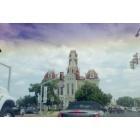
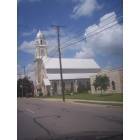
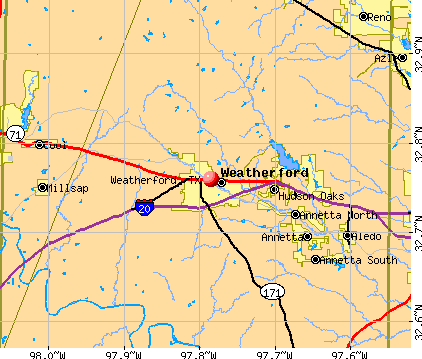


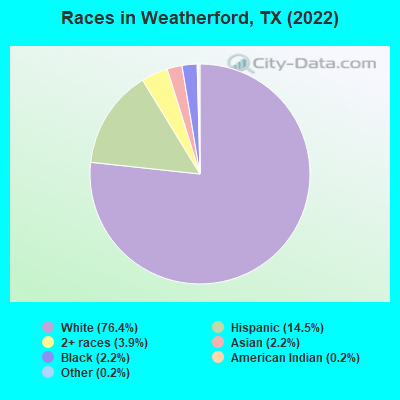
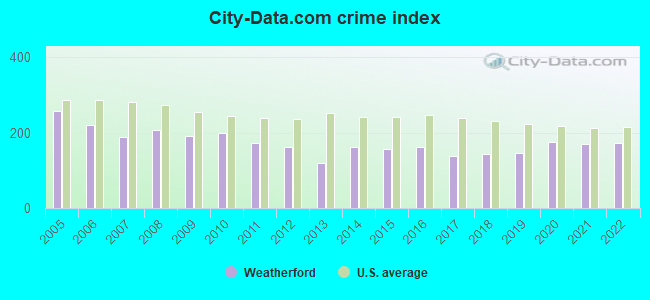
 Recent articles from our blog. Our writers, many of them Ph.D. graduates or candidates, create easy-to-read articles on a wide variety of topics.

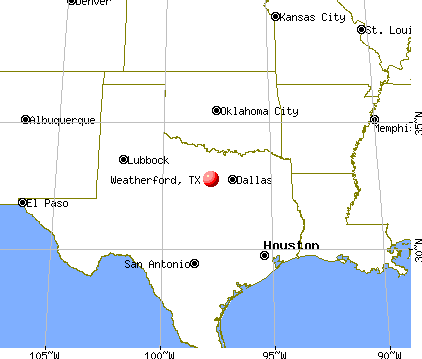
 (26.3 miles
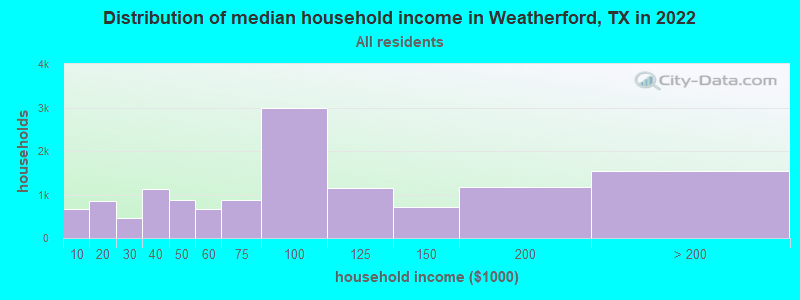
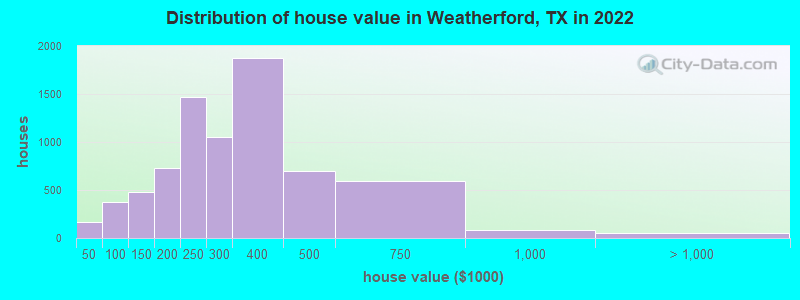

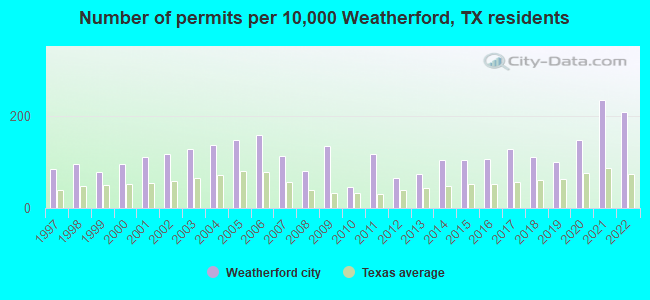
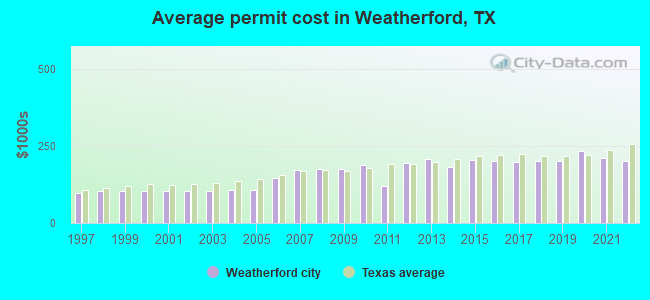
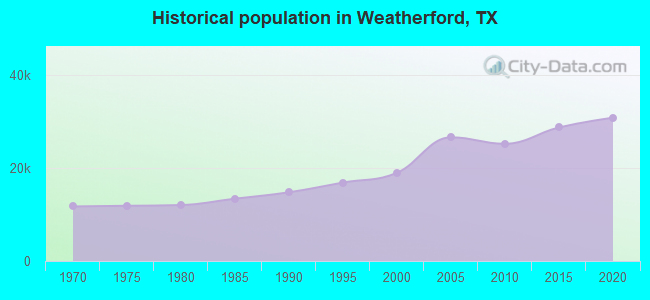
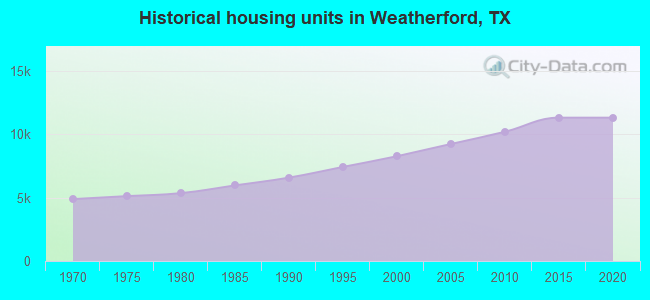
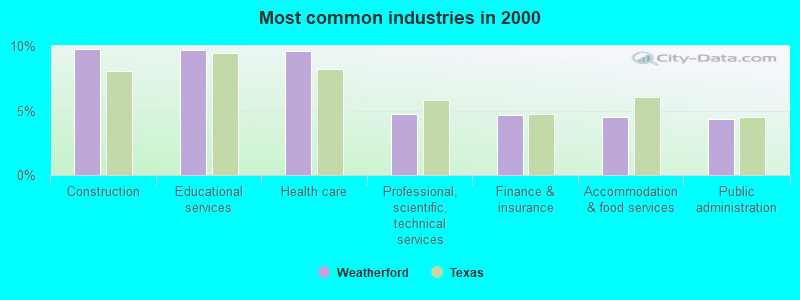
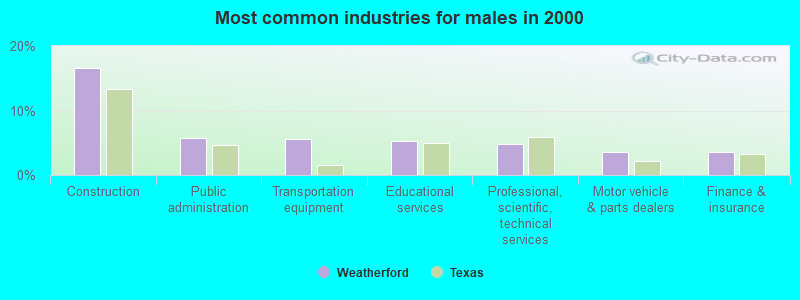
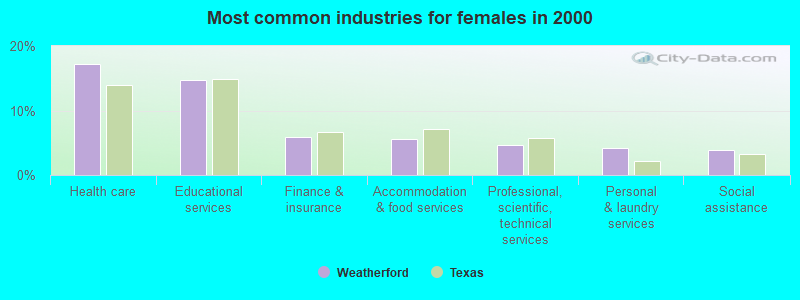
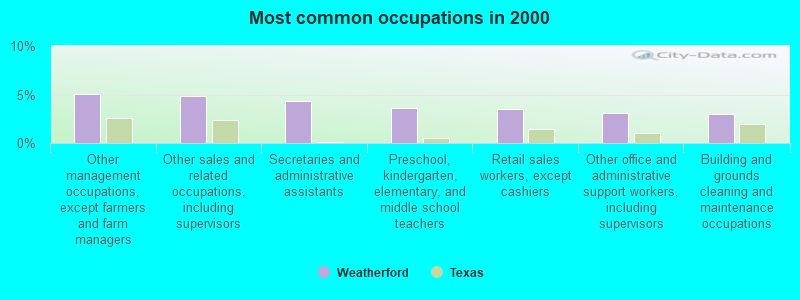
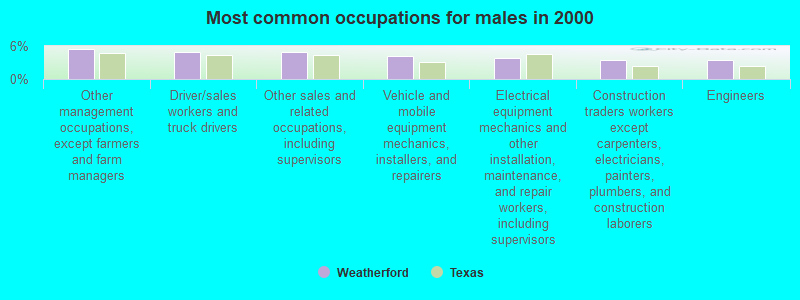
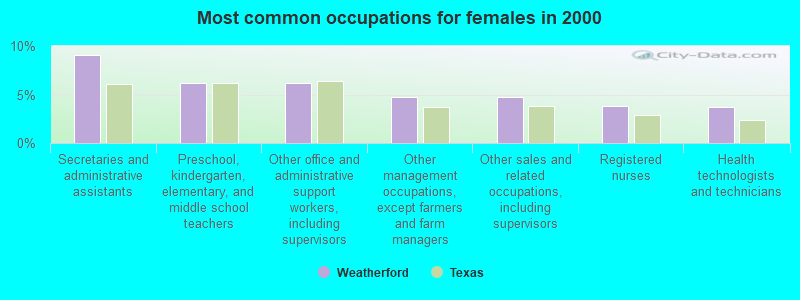
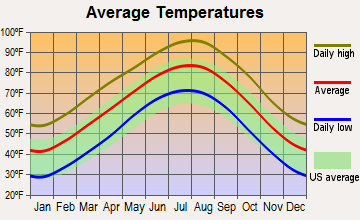
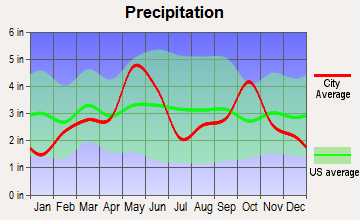
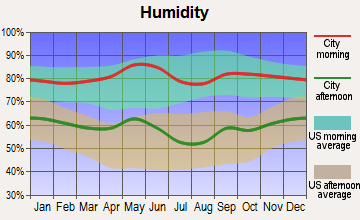
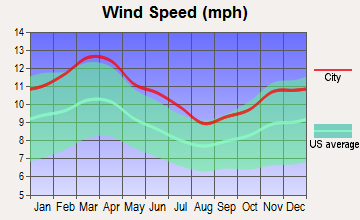
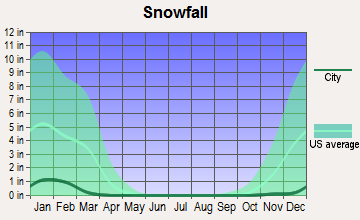
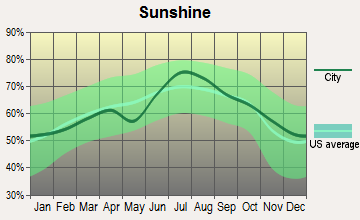
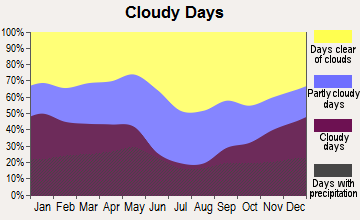


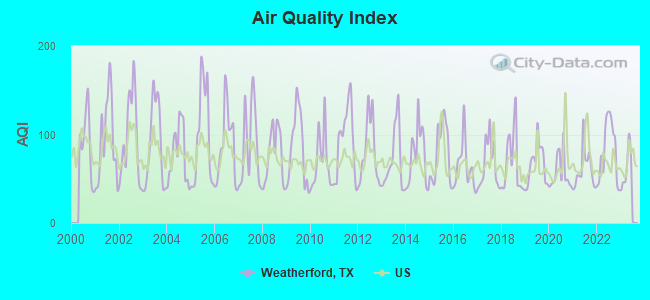
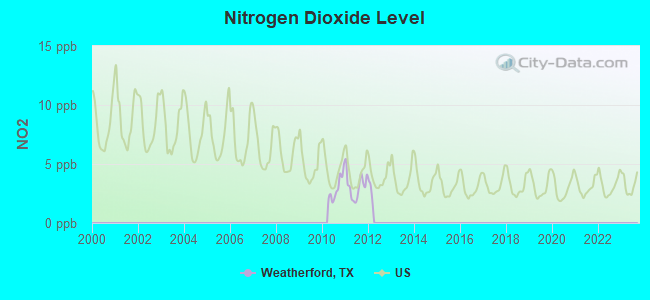
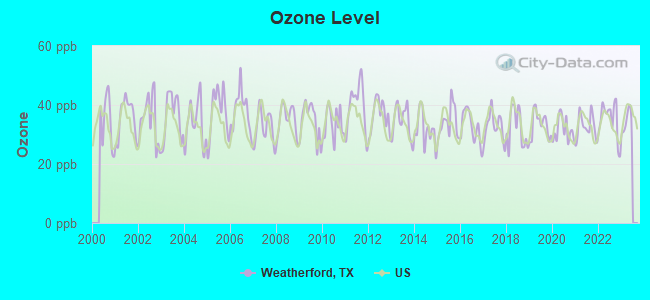
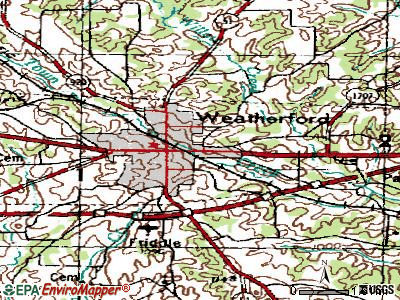
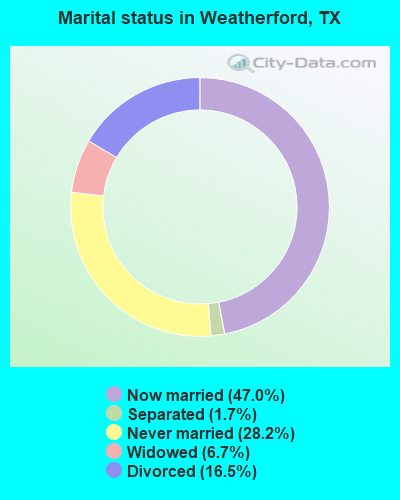
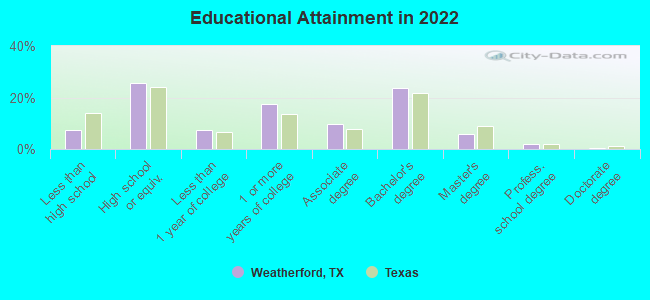
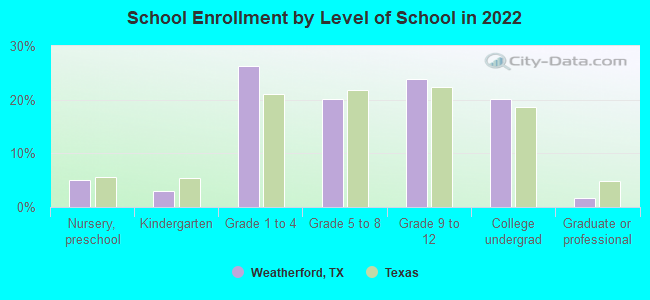
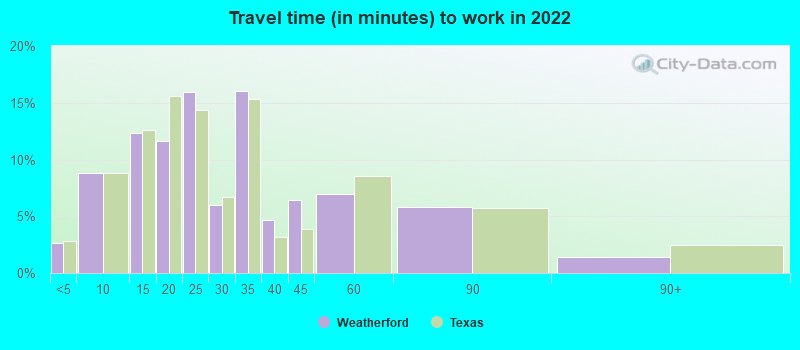
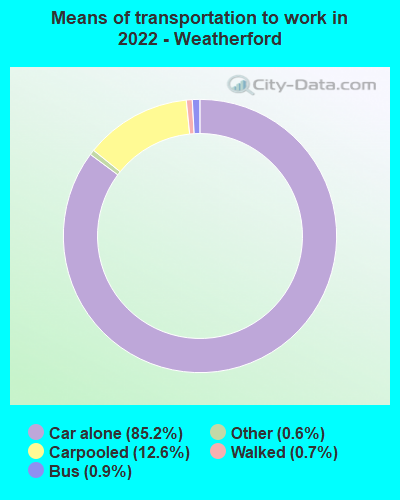
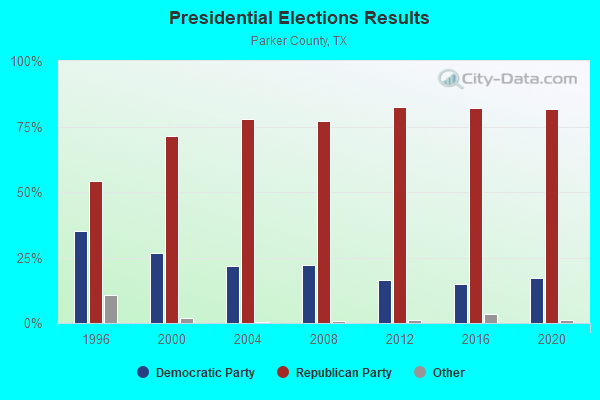
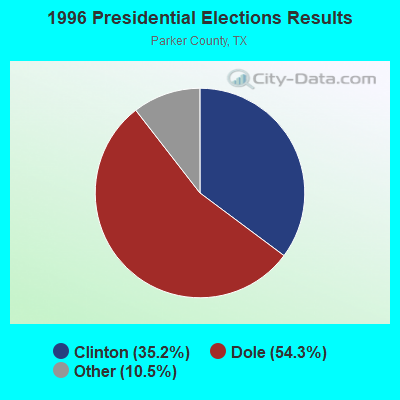
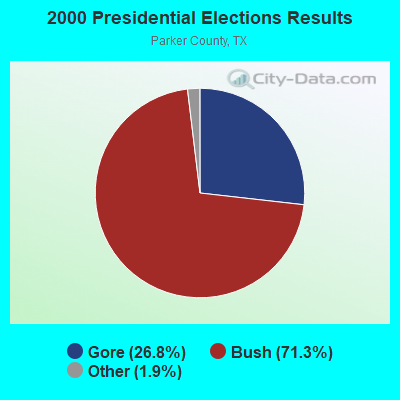
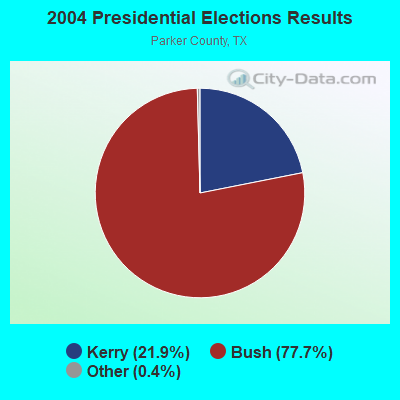
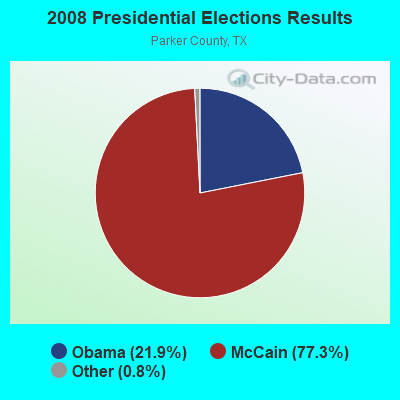
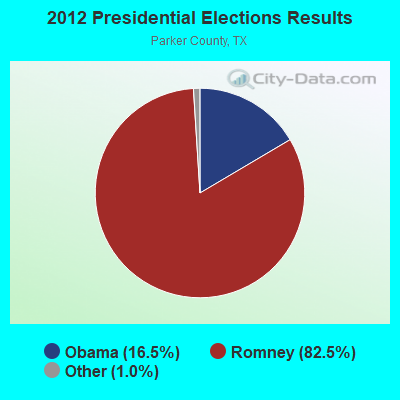
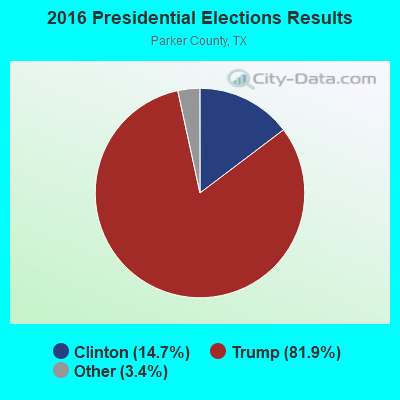
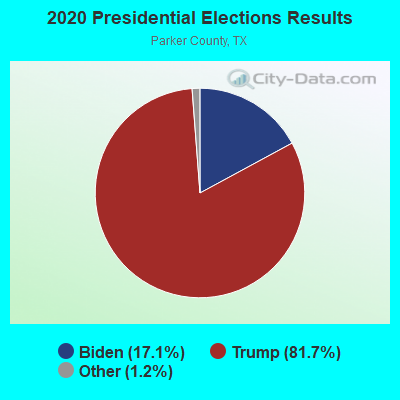
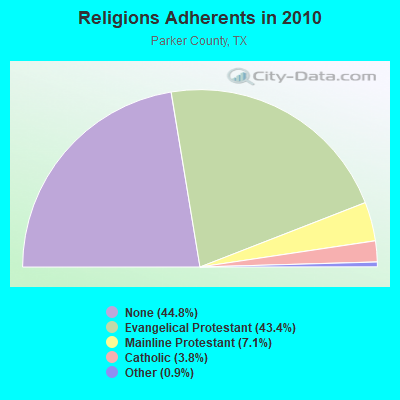
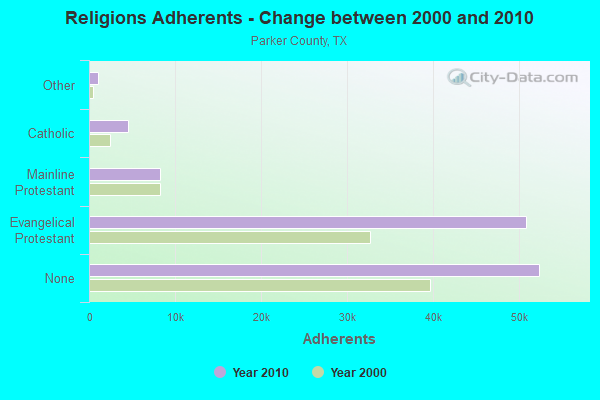
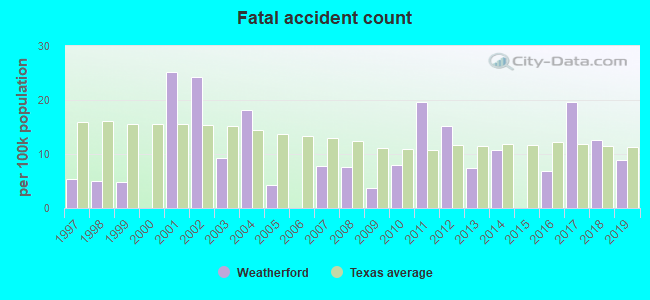
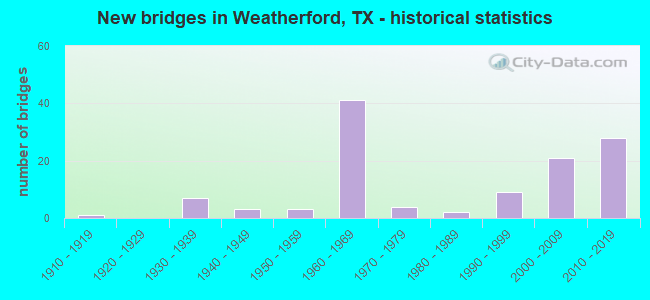
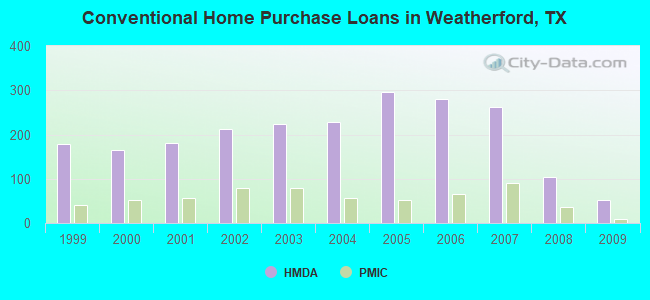
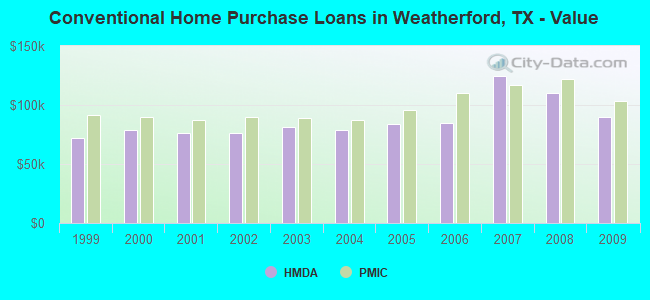
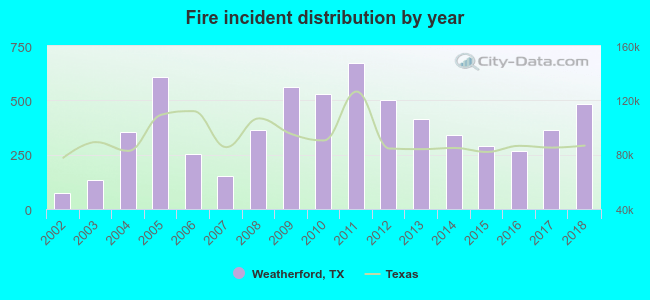 Based on the data from the years 2002 - 2018 the average number of fires per year is 374. The highest number of fires - 673 took place in 2011, and the least - 75 in 2002. The data has an increasing trend.
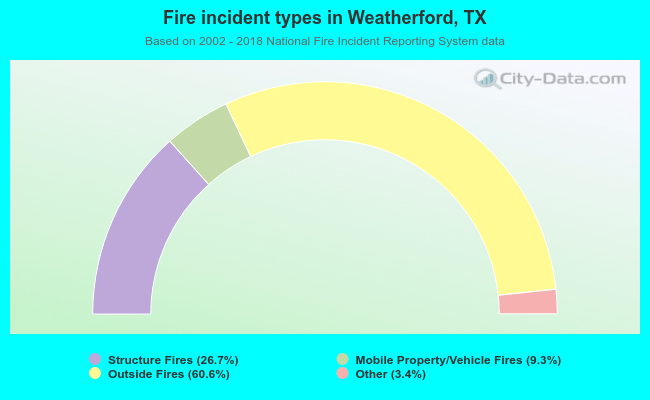 When looking into fire subcategories, the most reports belonged to: Outside Fires (60.6%), and Structure Fires (26.7%).