Weatherford: Fire Incidents, Texas (TX)
Where are fire incidents reported in Weatherford, TX
Something went wrong! Please refresh the page.
| Fire incidents reported | |
|---|---|
| Sreet name | Count |
| MINERAL WELLS HWY | 390 |
| MAIN ST | 212 |
| RANGER HWY | 178 |
| INTERSTATE 20 | 170 |
| ZION HILL RD | 170 |
| FORT WORTH HWY | 146 |
| FM 920 | 144 |
| TIN TOP RD | 126 |
| BETHEL RD | 96 |
| I - 20 HWY | 96 |
| GREENWOOD RD | 92 |
| OLD AGNES RD | 92 |
| LAKE DR | 82 |
| OLD BROCK RD | 82 |
| OLD DENNIS RD | 78 |
| OLD GARNER RD | 78 |
| SANTA FE DR | 72 |
| I 20 | 60 |
| BANKHEAD DR | 56 |
| LAMBERT RD | 56 |
| FM 51 | 54 |
| FM 51 HWY | 54 |
| HARMONY CIR | 54 |
| CLARK LAKE RD | 52 |
| UPPER DENTON RD | 52 |
| WEILAND RD | 52 |
| WHITE SETTLEMENT RD | 50 |
| ATWOOD CT | 46 |
| DILL RD | 44 |
| FM 1885 | 44 |
| Other | 3,375 |
2002 - 2018 National Fire Incident Reporting System (NFIRS) incidents
- Incident types reported to NFIRS in Weatherford, TX
- 11,71335.5%Rescue & EMS
- 6,35319.2%Fire
- 6,01218.2%Hazardous Condition
- 3,98912.1%Service Call
- 3,32310.1%Good Intent Call
- 1,3644.1%False Alarm
- 1120.3%Severe Weather
- 850.3%Overpressure Rupture
- 590.2%Special Incident
- Fire incident types reported to NFIRS in Weatherford, TX
- 3,85160.6%Outside Fires
- 1,69826.7%Structure Fires
- 5889.3%Mobile Property/Vehicle Fires
- 2163.4%Other
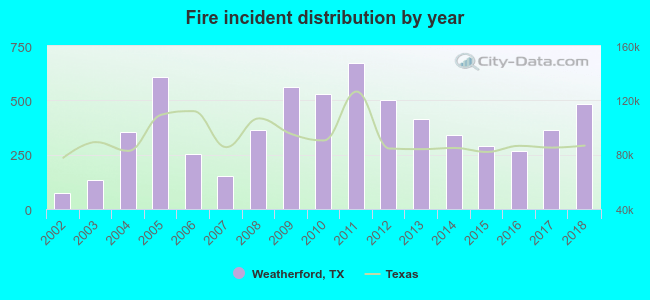 According to the data from the years 2002 - 2018 the average number of fires per year is 374. The highest number of reported fires - 673 took place in 2011, and the least - 75 in 2002. The data has a rising trend.
The average number of yearly fire incidents per 10k residents in Weatherford, TX compared to nearest cities:
(Note: Based on data for the last 3 years, including only cities with population 5,000 and above)
| Weatherford: | 133.4 |
| Azle: | 122.9 |
| Mineral Wells: | 101.5 |
| White Settlement: | 45.4 |
| Benbrook: | 45.2 |
| Briar: | 20.6 |
| Eagle Mountain: | 3.4 |
| Granbury: | 357.9 |
| River Oaks: | 21.3 |
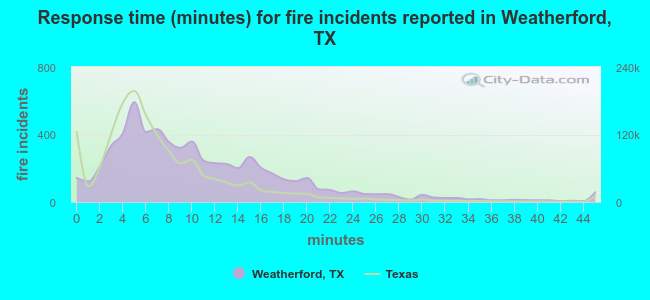 The median response time based on all reported fire incidents is 9 minutes. This is higher compared to the state median value.
The median response time in Weatherford, TX compared to nearest cities:
(Note: Based on data for all years, including only cities with at least 500 fire incidents)
| Weatherford: | 9 minutes |
| Willow Park: | 5 minutes |
| Aledo: | 9 minutes |
| Millsap: | 12 minutes |
| Springtown: | 9 minutes |
| Azle: | 9 minutes |
| Mineral Wells: | 7 minutes |
| White Settlement: | 5 minutes |
| Benbrook: | 7 minutes |
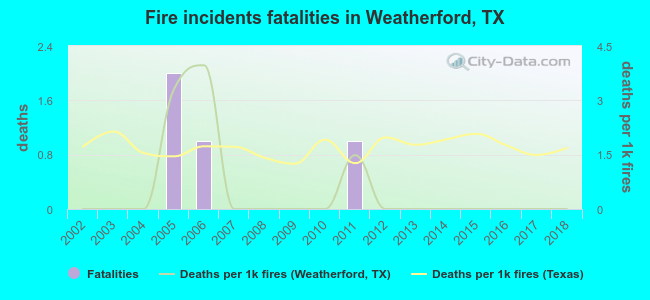 According to the reports from the years 2002 - 2018 the average number of fire-related yearly deaths is 0. The highest number of reported deaths - 2 took place in 2005, and the lowest - 0 in 2002. The data has a constant trend.
The average number of fatalities per 1,000 fires is 1. This indicator was the highest - 4 in 2006, and the lowest 0 in 2002. The trend for deaths per 1,000 fire incidents is constant. Compared to the state value the number of deaths per 1,000 fires is much lower.
According to the reports from the years 2002 - 2018 the average number of fire-related yearly deaths is 0. The highest number of reported deaths - 2 took place in 2005, and the lowest - 0 in 2002. The data has a constant trend.
The average number of fatalities per 1,000 fires is 1. This indicator was the highest - 4 in 2006, and the lowest 0 in 2002. The trend for deaths per 1,000 fire incidents is constant. Compared to the state value the number of deaths per 1,000 fires is much lower.Deaths per 1,000 incidents in Weatherford, TX compared to nearest cities:
(Note: Based on data for all years, including only cities with at least 2,500 fire incidents)
| Weatherford: | 0.6 |
| Springtown: | 0.3 |
| Azle: | 0.7 |
| Mineral Wells: | 1.1 |
| Granbury: | 0.0 |
| Fort Worth: | 1.9 |
| Haltom City: | 1.4 |
| Burleson: | 0.8 |
| Cleburne: | 2.1 |
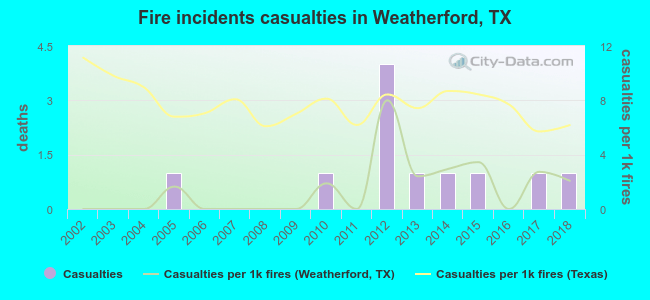 According to the reports from the years 2002 - 2018 the average number of fire-related yearly casualties is 1. The highest number of casualties - 4 took place in 2012, and the lowest - 0 in 2002. The data has a growing trend.
The average number of casualties per 1,000 fires is 1. This indicator was the highest - 8 in 2012, and the lowest 0 in 2002. The trend for casualties per 1,000 fires is growing. Compared to the Texas value the number of injuries per 1,000 fire incidents is much lower.
According to the reports from the years 2002 - 2018 the average number of fire-related yearly casualties is 1. The highest number of casualties - 4 took place in 2012, and the lowest - 0 in 2002. The data has a growing trend.
The average number of casualties per 1,000 fires is 1. This indicator was the highest - 8 in 2012, and the lowest 0 in 2002. The trend for casualties per 1,000 fires is growing. Compared to the Texas value the number of injuries per 1,000 fire incidents is much lower.Casualties per 1,000 incidents in Weatherford, TX compared to nearest cities:
(Note: Based on data for all years, including only cities with at least 500 fire incidents)
| Weatherford: | 1.7 |
| Willow Park: | 1.3 |
| Aledo: | 0.0 |
| Millsap: | 0.0 |
| Springtown: | 0.3 |
| Azle: | 2.7 |
| Mineral Wells: | 27.8 |
| White Settlement: | 3.4 |
| Benbrook: | 3.4 |
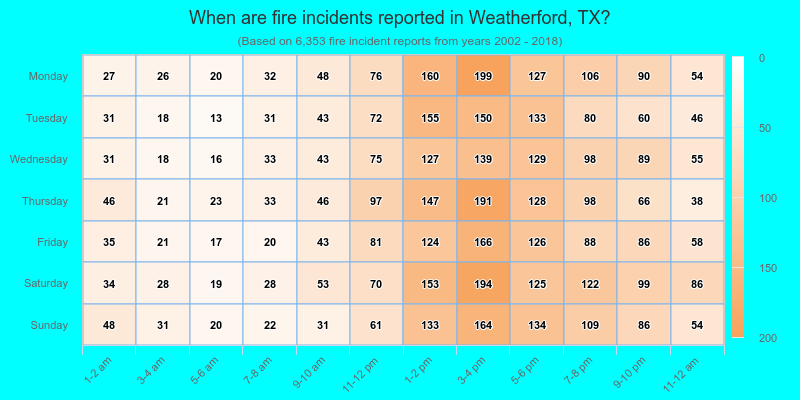
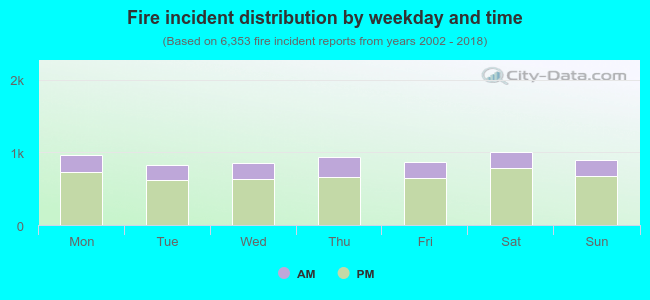 24.9% incidents where reported in the morning and 75.1% in the evening. The most fires (15.9%) took place on Saturday, and the least (13.1%) on Tuesday.
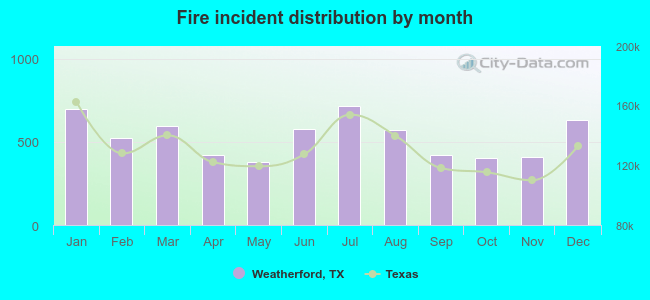 Based on the 6,353 reports from years 2002 - 2018 most fires (11.3%) took place during July, and the least (6.0%) in May.
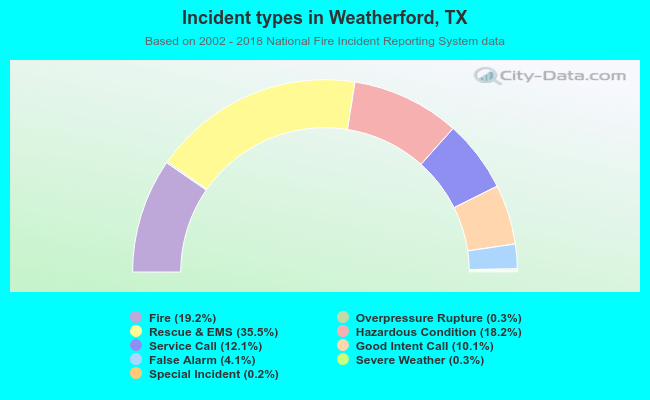 Out of all 33,010 cases reported during the years 2002 - 2018, the most belonged to the categories: Rescue & EMS (35.5%), Fire (19.2%), and Hazardous Condition (18.2%).
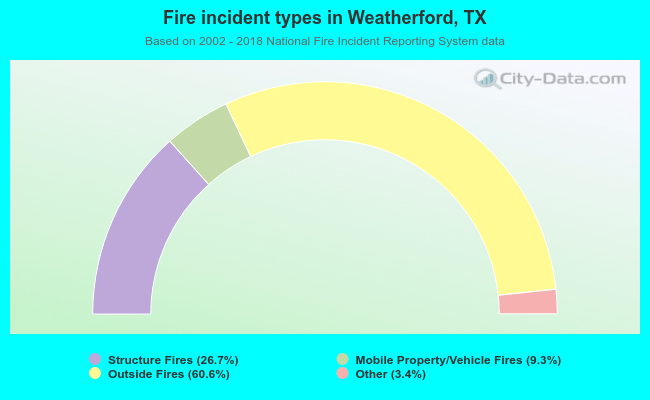 When looking into fire subcategories, the most incidents belonged to: Outside Fires (60.6%), and Structure Fires (26.7%).