Estimated zip code population in 2022: 19,422
Zip code population in 2010: 17,446
Zip code population in 2000: 17,511
Houses and condos: 9,367
Renter-occupied apartments: 4,728
% of renters here:
61%State:
38%
March 2022 cost of living index in zip code 76104: 94.5
(less than average, U.S. average is 100)
Land area: 5.9
sq. mi.
Water area: 0.0
sq. mi.
Population density: 3,315 people per square mile (average).
OSM Map
General Map
Google Map
MSN Map
OSM Map
General Map
Google Map
MSN Map
OSM Map
General Map
Google Map
MSN Map
OSM Map
General Map
Google Map
MSN Map
Please wait while loading the map...
Real estate property taxes paid for housing units in 2022:
This zip code:
1.1% ($1,633)Texas:
1.5% ($4,050)
Median real estate property taxes paid for housing units with mortgages in 2022: $2,555 (1.3%)
Median real estate property taxes paid for housing units with no mortgage in 2022: $1,230 (1.0%)
Profiles of local businesses
Business Search - 14 Million verified businesses
Males: 8,785 Females: 10,636
For population 25 years and over in 76104:
High school or higher: 71.8%Bachelor's degree or higher: 20.8%Graduate or professional degree: 8.0%Unemployed: 5.1%Mean travel time to work (commute): 24.2 minutes
For population 15 years and over in 76104:
Never married: 44.0%Now married: 33.7%Separated: 1.7%Widowed: 8.5%Divorced: 12.0%
Zip code 76104 compared to state average:
Median household income below state average. Median house value below state average. Black race population percentage above state average. Renting percentage above state average. Length of stay since moving in above state average. Number of rooms per house below state average. House age above state average. Percentage of population with a bachelor's degree or higher below state average. 8,927 46.0% Hispanic or Latino 5,462 28.1% Black 4,168 21.5% White 494 2.5% Asian 217 1.1% Two or more races 140 0.7% Some other race 11 0.06% American Indian
Data:
Median household income ($)
Median household income (% change since 2000)
Household income diversity
Ratio of average income to average house value (%)
Ratio of average income to average rent
Median household income ($) - White
Median household income ($) - Black or African American
Median household income ($) - Asian
Median household income ($) - Hispanic or Latino
Median household income ($) - American Indian and Alaska Native
Median household income ($) - Multirace
Median household income ($) - Other Race
Median household income for houses/condos with a mortgage ($)
Median household income for apartments without a mortgage ($)
Races - White alone (%)
Races - White alone (% change since 2000)
Races - Black alone (%)
Races - Black alone (% change since 2000)
Races - American Indian alone (%)
Races - American Indian alone (% change since 2000)
Races - Asian alone (%)
Races - Asian alone (% change since 2000)
Races - Hispanic (%)
Races - Hispanic (% change since 2000)
Races - Native Hawaiian and Other Pacific Islander alone (%)
Races - Native Hawaiian and Other Pacific Islander alone (% change since 2000)
Races - Two or more races (%)
Races - Two or more races (% change since 2000)
Races - Other race alone (%)
Races - Other race alone (% change since 2000)
Racial diversity
Unemployment (%)
Unemployment (% change since 2000)
Unemployment (%) - White
Unemployment (%) - Black or African American
Unemployment (%) - Asian
Unemployment (%) - Hispanic or Latino
Unemployment (%) - American Indian and Alaska Native
Unemployment (%) - Multirace
Unemployment (%) - Other Race
Population density (people per square mile)
Population - Males (%)
Population - Females (%)
Population - Males (%) - White
Population - Males (%) - Black or African American
Population - Males (%) - Asian
Population - Males (%) - Hispanic or Latino
Population - Males (%) - American Indian and Alaska Native
Population - Males (%) - Multirace
Population - Males (%) - Other Race
Population - Females (%) - White
Population - Females (%) - Black or African American
Population - Females (%) - Asian
Population - Females (%) - Hispanic or Latino
Population - Females (%) - American Indian and Alaska Native
Population - Females (%) - Multirace
Population - Females (%) - Other Race
Coronavirus confirmed cases (Apr 27, 2024)
Deaths caused by coronavirus (Apr 27, 2024)
Coronavirus confirmed cases (per 100k population) (Apr 27, 2024)
Deaths caused by coronavirus (per 100k population) (Apr 27, 2024)
Daily increase in number of cases (Apr 27, 2024)
Weekly increase in number of cases (Apr 27, 2024)
Cases doubled (in days) (Apr 27, 2024)
Hospitalized patients (Apr 18, 2022)
Negative test results (Apr 18, 2022)
Total test results (Apr 18, 2022)
COVID Vaccine doses distributed (per 100k population) (Sep 19, 2023)
COVID Vaccine doses administered (per 100k population) (Sep 19, 2023)
COVID Vaccine doses distributed (Sep 19, 2023)
COVID Vaccine doses administered (Sep 19, 2023)
Likely homosexual households (%)
Likely homosexual households (% change since 2000)
Likely homosexual households - Lesbian couples (%)
Likely homosexual households - Lesbian couples (% change since 2000)
Likely homosexual households - Gay men (%)
Likely homosexual households - Gay men (% change since 2000)
Cost of living index
Median gross rent ($)
Median contract rent ($)
Median monthly housing costs ($)
Median house or condo value ($)
Median house or condo value ($ change since 2000)
Mean house or condo value by units in structure - 1, detached ($)
Mean house or condo value by units in structure - 1, attached ($)
Mean house or condo value by units in structure - 2 ($)
Mean house or condo value by units in structure by units in structure - 3 or 4 ($)
Mean house or condo value by units in structure - 5 or more ($)
Mean house or condo value by units in structure - Boat, RV, van, etc. ($)
Mean house or condo value by units in structure - Mobile home ($)
Median house or condo value ($) - White
Median house or condo value ($) - Black or African American
Median house or condo value ($) - Asian
Median house or condo value ($) - Hispanic or Latino
Median house or condo value ($) - American Indian and Alaska Native
Median house or condo value ($) - Multirace
Median house or condo value ($) - Other Race
Median resident age
Resident age diversity
Median resident age - Males
Median resident age - Females
Median resident age - White
Median resident age - Black or African American
Median resident age - Asian
Median resident age - Hispanic or Latino
Median resident age - American Indian and Alaska Native
Median resident age - Multirace
Median resident age - Other Race
Median resident age - Males - White
Median resident age - Males - Black or African American
Median resident age - Males - Asian
Median resident age - Males - Hispanic or Latino
Median resident age - Males - American Indian and Alaska Native
Median resident age - Males - Multirace
Median resident age - Males - Other Race
Median resident age - Females - White
Median resident age - Females - Black or African American
Median resident age - Females - Asian
Median resident age - Females - Hispanic or Latino
Median resident age - Females - American Indian and Alaska Native
Median resident age - Females - Multirace
Median resident age - Females - Other Race
Commute - mean travel time to work (minutes)
Travel time to work - Less than 5 minutes (%)
Travel time to work - Less than 5 minutes (% change since 2000)
Travel time to work - 5 to 9 minutes (%)
Travel time to work - 5 to 9 minutes (% change since 2000)
Travel time to work - 10 to 19 minutes (%)
Travel time to work - 10 to 19 minutes (% change since 2000)
Travel time to work - 20 to 29 minutes (%)
Travel time to work - 20 to 29 minutes (% change since 2000)
Travel time to work - 30 to 39 minutes (%)
Travel time to work - 30 to 39 minutes (% change since 2000)
Travel time to work - 40 to 59 minutes (%)
Travel time to work - 40 to 59 minutes (% change since 2000)
Travel time to work - 60 to 89 minutes (%)
Travel time to work - 60 to 89 minutes (% change since 2000)
Travel time to work - 90 or more minutes (%)
Travel time to work - 90 or more minutes (% change since 2000)
Marital status - Never married (%)
Marital status - Now married (%)
Marital status - Separated (%)
Marital status - Widowed (%)
Marital status - Divorced (%)
Median family income ($)
Median family income (% change since 2000)
Median non-family income ($)
Median non-family income (% change since 2000)
Median per capita income ($)
Median per capita income (% change since 2000)
Median family income ($) - White
Median family income ($) - Black or African American
Median family income ($) - Asian
Median family income ($) - Hispanic or Latino
Median family income ($) - American Indian and Alaska Native
Median family income ($) - Multirace
Median family income ($) - Other Race
Median year house/condo built
Median year apartment built
Year house built - Built 2005 or later (%)
Year house built - Built 2000 to 2004 (%)
Year house built - Built 1990 to 1999 (%)
Year house built - Built 1980 to 1989 (%)
Year house built - Built 1970 to 1979 (%)
Year house built - Built 1960 to 1969 (%)
Year house built - Built 1950 to 1959 (%)
Year house built - Built 1940 to 1949 (%)
Year house built - Built 1939 or earlier (%)
Average household size
Household density (households per square mile)
Average household size - White
Average household size - Black or African American
Average household size - Asian
Average household size - Hispanic or Latino
Average household size - American Indian and Alaska Native
Average household size - Multirace
Average household size - Other Race
Occupied housing units (%)
Vacant housing units (%)
Owner occupied housing units (%)
Renter occupied housing units (%)
Vacancy status - For rent (%)
Vacancy status - For sale only (%)
Vacancy status - Rented or sold, not occupied (%)
Vacancy status - For seasonal, recreational, or occasional use (%)
Vacancy status - For migrant workers (%)
Vacancy status - Other vacant (%)
Residents with income below the poverty level (%)
Residents with income below 50% of the poverty level (%)
Children below poverty level (%)
Poor families by family type - Married-couple family (%)
Poor families by family type - Male, no wife present (%)
Poor families by family type - Female, no husband present (%)
Poverty status for native-born residents (%)
Poverty status for foreign-born residents (%)
Poverty among high school graduates not in families (%)
Poverty among people who did not graduate high school not in families (%)
Residents with income below the poverty level (%) - White
Residents with income below the poverty level (%) - Black or African American
Residents with income below the poverty level (%) - Asian
Residents with income below the poverty level (%) - Hispanic or Latino
Residents with income below the poverty level (%) - American Indian and Alaska Native
Residents with income below the poverty level (%) - Multirace
Residents with income below the poverty level (%) - Other Race
Air pollution - Air Quality Index (AQI)
Air pollution - CO
Air pollution - NO2
Air pollution - SO2
Air pollution - Ozone
Air pollution - PM10
Air pollution - PM25
Air pollution - Pb
Crime - Murders per 100,000 population
Crime - Rapes per 100,000 population
Crime - Robberies per 100,000 population
Crime - Assaults per 100,000 population
Crime - Burglaries per 100,000 population
Crime - Thefts per 100,000 population
Crime - Auto thefts per 100,000 population
Crime - Arson per 100,000 population
Crime - City-data.com crime index
Crime - Violent crime index
Crime - Property crime index
Crime - Murders per 100,000 population (5 year average)
Crime - Rapes per 100,000 population (5 year average)
Crime - Robberies per 100,000 population (5 year average)
Crime - Assaults per 100,000 population (5 year average)
Crime - Burglaries per 100,000 population (5 year average)
Crime - Thefts per 100,000 population (5 year average)
Crime - Auto thefts per 100,000 population (5 year average)
Crime - Arson per 100,000 population (5 year average)
Crime - City-data.com crime index (5 year average)
Crime - Violent crime index (5 year average)
Crime - Property crime index (5 year average)
1996 Presidential Elections Results (%) - Democratic Party (Clinton)
1996 Presidential Elections Results (%) - Republican Party (Dole)
1996 Presidential Elections Results (%) - Other
2000 Presidential Elections Results (%) - Democratic Party (Gore)
2000 Presidential Elections Results (%) - Republican Party (Bush)
2000 Presidential Elections Results (%) - Other
2004 Presidential Elections Results (%) - Democratic Party (Kerry)
2004 Presidential Elections Results (%) - Republican Party (Bush)
2004 Presidential Elections Results (%) - Other
2008 Presidential Elections Results (%) - Democratic Party (Obama)
2008 Presidential Elections Results (%) - Republican Party (McCain)
2008 Presidential Elections Results (%) - Other
2012 Presidential Elections Results (%) - Democratic Party (Obama)
2012 Presidential Elections Results (%) - Republican Party (Romney)
2012 Presidential Elections Results (%) - Other
2016 Presidential Elections Results (%) - Democratic Party (Clinton)
2016 Presidential Elections Results (%) - Republican Party (Trump)
2016 Presidential Elections Results (%) - Other
2020 Presidential Elections Results (%) - Democratic Party (Biden)
2020 Presidential Elections Results (%) - Republican Party (Trump)
2020 Presidential Elections Results (%) - Other
Ancestries Reported - Arab (%)
Ancestries Reported - Czech (%)
Ancestries Reported - Danish (%)
Ancestries Reported - Dutch (%)
Ancestries Reported - English (%)
Ancestries Reported - French (%)
Ancestries Reported - French Canadian (%)
Ancestries Reported - German (%)
Ancestries Reported - Greek (%)
Ancestries Reported - Hungarian (%)
Ancestries Reported - Irish (%)
Ancestries Reported - Italian (%)
Ancestries Reported - Lithuanian (%)
Ancestries Reported - Norwegian (%)
Ancestries Reported - Polish (%)
Ancestries Reported - Portuguese (%)
Ancestries Reported - Russian (%)
Ancestries Reported - Scotch-Irish (%)
Ancestries Reported - Scottish (%)
Ancestries Reported - Slovak (%)
Ancestries Reported - Subsaharan African (%)
Ancestries Reported - Swedish (%)
Ancestries Reported - Swiss (%)
Ancestries Reported - Ukrainian (%)
Ancestries Reported - United States (%)
Ancestries Reported - Welsh (%)
Ancestries Reported - West Indian (%)
Ancestries Reported - Other (%)
Educational Attainment - No schooling completed (%)
Educational Attainment - Less than high school (%)
Educational Attainment - High school or equivalent (%)
Educational Attainment - Less than 1 year of college (%)
Educational Attainment - 1 or more years of college (%)
Educational Attainment - Associate degree (%)
Educational Attainment - Bachelor's degree (%)
Educational Attainment - Master's degree (%)
Educational Attainment - Professional school degree (%)
Educational Attainment - Doctorate degree (%)
School Enrollment - Nursery, preschool (%)
School Enrollment - Kindergarten (%)
School Enrollment - Grade 1 to 4 (%)
School Enrollment - Grade 5 to 8 (%)
School Enrollment - Grade 9 to 12 (%)
School Enrollment - College undergrad (%)
School Enrollment - Graduate or professional (%)
School Enrollment - Not enrolled in school (%)
School enrollment - Public schools (%)
School enrollment - Private schools (%)
School enrollment - Not enrolled (%)
Median number of rooms in houses and condos
Median number of rooms in apartments
Housing units lacking complete plumbing facilities (%)
Housing units lacking complete kitchen facilities (%)
Density of houses
Urban houses (%)
Rural houses (%)
Households with people 60 years and over (%)
Households with people 65 years and over (%)
Households with people 75 years and over (%)
Households with one or more nonrelatives (%)
Households with no nonrelatives (%)
Population in households (%)
Family households (%)
Nonfamily households (%)
Population in families (%)
Family households with own children (%)
Median number of bedrooms in owner occupied houses
Mean number of bedrooms in owner occupied houses
Median number of bedrooms in renter occupied houses
Mean number of bedrooms in renter occupied houses
Median number of vehichles in owner occupied houses
Mean number of vehichles in owner occupied houses
Median number of vehichles in renter occupied houses
Mean number of vehichles in renter occupied houses
Mortgage status - with mortgage (%)
Mortgage status - with second mortgage (%)
Mortgage status - with home equity loan (%)
Mortgage status - with both second mortgage and home equity loan (%)
Mortgage status - without a mortgage (%)
Average family size
Average family size - White
Average family size - Black or African American
Average family size - Asian
Average family size - Hispanic or Latino
Average family size - American Indian and Alaska Native
Average family size - Multirace
Average family size - Other Race
Geographical mobility - Same house 1 year ago (%)
Geographical mobility - Moved within same county (%)
Geographical mobility - Moved from different county within same state (%)
Geographical mobility - Moved from different state (%)
Geographical mobility - Moved from abroad (%)
Place of birth - Born in state of residence (%)
Place of birth - Born in other state (%)
Place of birth - Native, outside of US (%)
Place of birth - Foreign born (%)
Housing units in structures - 1, detached (%)
Housing units in structures - 1, attached (%)
Housing units in structures - 2 (%)
Housing units in structures - 3 or 4 (%)
Housing units in structures - 5 to 9 (%)
Housing units in structures - 10 to 19 (%)
Housing units in structures - 20 to 49 (%)
Housing units in structures - 50 or more (%)
Housing units in structures - Mobile home (%)
Housing units in structures - Boat, RV, van, etc. (%)
House/condo owner moved in on average (years ago)
Renter moved in on average (years ago)
Year householder moved into unit - Moved in 1999 to March 2000 (%)
Year householder moved into unit - Moved in 1995 to 1998 (%)
Year householder moved into unit - Moved in 1990 to 1994 (%)
Year householder moved into unit - Moved in 1980 to 1989 (%)
Year householder moved into unit - Moved in 1970 to 1979 (%)
Year householder moved into unit - Moved in 1969 or earlier (%)
Means of transportation to work - Drove car alone (%)
Means of transportation to work - Carpooled (%)
Means of transportation to work - Public transportation (%)
Means of transportation to work - Bus or trolley bus (%)
Means of transportation to work - Streetcar or trolley car (%)
Means of transportation to work - Subway or elevated (%)
Means of transportation to work - Railroad (%)
Means of transportation to work - Ferryboat (%)
Means of transportation to work - Taxicab (%)
Means of transportation to work - Motorcycle (%)
Means of transportation to work - Bicycle (%)
Means of transportation to work - Walked (%)
Means of transportation to work - Other means (%)
Working at home (%)
Industry diversity
Most Common Industries - Agriculture, forestry, fishing and hunting, and mining (%)
Most Common Industries - Agriculture, forestry, fishing and hunting (%)
Most Common Industries - Mining, quarrying, and oil and gas extraction (%)
Most Common Industries - Construction (%)
Most Common Industries - Manufacturing (%)
Most Common Industries - Wholesale trade (%)
Most Common Industries - Retail trade (%)
Most Common Industries - Transportation and warehousing, and utilities (%)
Most Common Industries - Transportation and warehousing (%)
Most Common Industries - Utilities (%)
Most Common Industries - Information (%)
Most Common Industries - Finance and insurance, and real estate and rental and leasing (%)
Most Common Industries - Finance and insurance (%)
Most Common Industries - Real estate and rental and leasing (%)
Most Common Industries - Professional, scientific, and management, and administrative and waste management services (%)
Most Common Industries - Professional, scientific, and technical services (%)
Most Common Industries - Management of companies and enterprises (%)
Most Common Industries - Administrative and support and waste management services (%)
Most Common Industries - Educational services, and health care and social assistance (%)
Most Common Industries - Educational services (%)
Most Common Industries - Health care and social assistance (%)
Most Common Industries - Arts, entertainment, and recreation, and accommodation and food services (%)
Most Common Industries - Arts, entertainment, and recreation (%)
Most Common Industries - Accommodation and food services (%)
Most Common Industries - Other services, except public administration (%)
Most Common Industries - Public administration (%)
Occupation diversity
Most Common Occupations - Management, business, science, and arts occupations (%)
Most Common Occupations - Management, business, and financial occupations (%)
Most Common Occupations - Management occupations (%)
Most Common Occupations - Business and financial operations occupations (%)
Most Common Occupations - Computer, engineering, and science occupations (%)
Most Common Occupations - Computer and mathematical occupations (%)
Most Common Occupations - Architecture and engineering occupations (%)
Most Common Occupations - Life, physical, and social science occupations (%)
Most Common Occupations - Education, legal, community service, arts, and media occupations (%)
Most Common Occupations - Community and social service occupations (%)
Most Common Occupations - Legal occupations (%)
Most Common Occupations - Education, training, and library occupations (%)
Most Common Occupations - Arts, design, entertainment, sports, and media occupations (%)
Most Common Occupations - Healthcare practitioners and technical occupations (%)
Most Common Occupations - Health diagnosing and treating practitioners and other technical occupations (%)
Most Common Occupations - Health technologists and technicians (%)
Most Common Occupations - Service occupations (%)
Most Common Occupations - Healthcare support occupations (%)
Most Common Occupations - Protective service occupations (%)
Most Common Occupations - Fire fighting and prevention, and other protective service workers including supervisors (%)
Most Common Occupations - Law enforcement workers including supervisors (%)
Most Common Occupations - Food preparation and serving related occupations (%)
Most Common Occupations - Building and grounds cleaning and maintenance occupations (%)
Most Common Occupations - Personal care and service occupations (%)
Most Common Occupations - Sales and office occupations (%)
Most Common Occupations - Sales and related occupations (%)
Most Common Occupations - Office and administrative support occupations (%)
Most Common Occupations - Natural resources, construction, and maintenance occupations (%)
Most Common Occupations - Farming, fishing, and forestry occupations (%)
Most Common Occupations - Construction and extraction occupations (%)
Most Common Occupations - Installation, maintenance, and repair occupations (%)
Most Common Occupations - Production, transportation, and material moving occupations (%)
Most Common Occupations - Production occupations (%)
Most Common Occupations - Transportation occupations (%)
Most Common Occupations - Material moving occupations (%)
People in Group quarters - Institutionalized population (%)
People in Group quarters - Correctional institutions (%)
People in Group quarters - Federal prisons and detention centers (%)
People in Group quarters - Halfway houses (%)
People in Group quarters - Local jails and other confinement facilities (including police lockups) (%)
People in Group quarters - Military disciplinary barracks (%)
People in Group quarters - State prisons (%)
People in Group quarters - Other types of correctional institutions (%)
People in Group quarters - Nursing homes (%)
People in Group quarters - Hospitals/wards, hospices, and schools for the handicapped (%)
People in Group quarters - Hospitals/wards and hospices for chronically ill (%)
People in Group quarters - Hospices or homes for chronically ill (%)
People in Group quarters - Military hospitals or wards for chronically ill (%)
People in Group quarters - Other hospitals or wards for chronically ill (%)
People in Group quarters - Hospitals or wards for drug/alcohol abuse (%)
People in Group quarters - Mental (Psychiatric) hospitals or wards (%)
People in Group quarters - Schools, hospitals, or wards for the mentally retarded (%)
People in Group quarters - Schools, hospitals, or wards for the physically handicapped (%)
People in Group quarters - Institutions for the deaf (%)
People in Group quarters - Institutions for the blind (%)
People in Group quarters - Orthopedic wards and institutions for the physically handicapped (%)
People in Group quarters - Wards in general hospitals for patients who have no usual home elsewhere (%)
People in Group quarters - Wards in military hospitals for patients who have no usual home elsewhere (%)
People in Group quarters - Juvenile institutions (%)
People in Group quarters - Long-term care (%)
People in Group quarters - Homes for abused, dependent, and neglected children (%)
People in Group quarters - Residential treatment centers for emotionally disturbed children (%)
People in Group quarters - Training schools for juvenile delinquents (%)
People in Group quarters - Short-term care, detention or diagnostic centers for delinquent children (%)
People in Group quarters - Type of juvenile institution unknown (%)
People in Group quarters - Noninstitutionalized population (%)
People in Group quarters - College dormitories (includes college quarters off campus) (%)
People in Group quarters - Military quarters (%)
People in Group quarters - On base (%)
People in Group quarters - Barracks, unaccompanied personnel housing (UPH), (Enlisted/Officer), ;and similar group living quarters for military personnel (%)
People in Group quarters - Transient quarters for temporary residents (%)
People in Group quarters - Military ships (%)
People in Group quarters - Group homes (%)
People in Group quarters - Homes or halfway houses for drug/alcohol abuse (%)
People in Group quarters - Homes for the mentally ill (%)
People in Group quarters - Homes for the mentally retarded (%)
People in Group quarters - Homes for the physically handicapped (%)
People in Group quarters - Other group homes (%)
People in Group quarters - Religious group quarters (%)
People in Group quarters - Dormitories (%)
People in Group quarters - Agriculture workers' dormitories on farms (%)
People in Group quarters - Job Corps and vocational training facilities (%)
People in Group quarters - Other workers' dormitories (%)
People in Group quarters - Crews of maritime vessels (%)
People in Group quarters - Other nonhousehold living situations (%)
People in Group quarters - Other noninstitutional group quarters (%)
Residents speaking English at home (%)
Residents speaking English at home - Born in the United States (%)
Residents speaking English at home - Native, born elsewhere (%)
Residents speaking English at home - Foreign born (%)
Residents speaking Spanish at home (%)
Residents speaking Spanish at home - Born in the United States (%)
Residents speaking Spanish at home - Native, born elsewhere (%)
Residents speaking Spanish at home - Foreign born (%)
Residents speaking other language at home (%)
Residents speaking other language at home - Born in the United States (%)
Residents speaking other language at home - Native, born elsewhere (%)
Residents speaking other language at home - Foreign born (%)
Class of Workers - Employee of private company (%)
Class of Workers - Self-employed in own incorporated business (%)
Class of Workers - Private not-for-profit wage and salary workers (%)
Class of Workers - Local government workers (%)
Class of Workers - State government workers (%)
Class of Workers - Federal government workers (%)
Class of Workers - Self-employed workers in own not incorporated business and Unpaid family workers (%)
House heating fuel used in houses and condos - Utility gas (%)
House heating fuel used in houses and condos - Bottled, tank, or LP gas (%)
House heating fuel used in houses and condos - Electricity (%)
House heating fuel used in houses and condos - Fuel oil, kerosene, etc. (%)
House heating fuel used in houses and condos - Coal or coke (%)
House heating fuel used in houses and condos - Wood (%)
House heating fuel used in houses and condos - Solar energy (%)
House heating fuel used in houses and condos - Other fuel (%)
House heating fuel used in houses and condos - No fuel used (%)
House heating fuel used in apartments - Utility gas (%)
House heating fuel used in apartments - Bottled, tank, or LP gas (%)
House heating fuel used in apartments - Electricity (%)
House heating fuel used in apartments - Fuel oil, kerosene, etc. (%)
House heating fuel used in apartments - Coal or coke (%)
House heating fuel used in apartments - Wood (%)
House heating fuel used in apartments - Solar energy (%)
House heating fuel used in apartments - Other fuel (%)
House heating fuel used in apartments - No fuel used (%)
Armed forces status - In Armed Forces (%)
Armed forces status - Civilian (%)
Armed forces status - Civilian - Veteran (%)
Armed forces status - Civilian - Nonveteran (%)
Fatal accidents locations in years 2005-2021
Fatal accidents locations in 2005
Fatal accidents locations in 2006
Fatal accidents locations in 2007
Fatal accidents locations in 2008
Fatal accidents locations in 2009
Fatal accidents locations in 2010
Fatal accidents locations in 2011
Fatal accidents locations in 2012
Fatal accidents locations in 2013
Fatal accidents locations in 2014
Fatal accidents locations in 2015
Fatal accidents locations in 2016
Fatal accidents locations in 2017
Fatal accidents locations in 2018
Fatal accidents locations in 2019
Fatal accidents locations in 2020
Fatal accidents locations in 2021
Alcohol use - People drinking some alcohol every month (%)
Alcohol use - People not drinking at all (%)
Alcohol use - Average days/month drinking alcohol
Alcohol use - Average drinks/week
Alcohol use - Average days/year people drink much
Audiometry - Average condition of hearing (%)
Audiometry - People that can hear a whisper from across a quiet room (%)
Audiometry - People that can hear normal voice from across a quiet room (%)
Audiometry - Ears ringing, roaring, buzzing (%)
Audiometry - Had a job exposure to loud noise (%)
Audiometry - Had off-work exposure to loud noise (%)
Blood Pressure & Cholesterol - Has high blood pressure (%)
Blood Pressure & Cholesterol - Checking blood pressure at home (%)
Blood Pressure & Cholesterol - Frequently checking blood cholesterol (%)
Blood Pressure & Cholesterol - Has high cholesterol level (%)
Consumer Behavior - Money monthly spent on food at supermarket/grocery store
Consumer Behavior - Money monthly spent on food at other stores
Consumer Behavior - Money monthly spent on eating out
Consumer Behavior - Money monthly spent on carryout/delivered foods
Consumer Behavior - Income spent on food at supermarket/grocery store (%)
Consumer Behavior - Income spent on food at other stores (%)
Consumer Behavior - Income spent on eating out (%)
Consumer Behavior - Income spent on carryout/delivered foods (%)
Current Health Status - General health condition (%)
Current Health Status - Blood donors (%)
Current Health Status - Has blood ever tested for HIV virus (%)
Current Health Status - Left-handed people (%)
Dermatology - People using sunscreen (%)
Diabetes - Diabetics (%)
Diabetes - Had a blood test for high blood sugar (%)
Diabetes - People taking insulin (%)
Diet Behavior & Nutrition - Diet health (%)
Diet Behavior & Nutrition - Milk product consumption (# of products/month)
Diet Behavior & Nutrition - Meals not home prepared (#/week)
Diet Behavior & Nutrition - Meals from fast food or pizza place (#/week)
Diet Behavior & Nutrition - Ready-to-eat foods (#/month)
Diet Behavior & Nutrition - Frozen meals/pizza (#/month)
Drug Use - People that ever used marijuana or hashish (%)
Drug Use - Ever used hard drugs (%)
Drug Use - Ever used any form of cocaine (%)
Drug Use - Ever used heroin (%)
Drug Use - Ever used methamphetamine (%)
Health Insurance - People covered by health insurance (%)
Kidney Conditions-Urology - Avg. # of times urinating at night
Medical Conditions - People with asthma (%)
Medical Conditions - People with anemia (%)
Medical Conditions - People with psoriasis (%)
Medical Conditions - People with overweight (%)
Medical Conditions - Elderly people having difficulties in thinking or remembering (%)
Medical Conditions - People who ever received blood transfusion (%)
Medical Conditions - People having trouble seeing even with glass/contacts (%)
Medical Conditions - People with arthritis (%)
Medical Conditions - People with gout (%)
Medical Conditions - People with congestive heart failure (%)
Medical Conditions - People with coronary heart disease (%)
Medical Conditions - People with angina pectoris (%)
Medical Conditions - People who ever had heart attack (%)
Medical Conditions - People who ever had stroke (%)
Medical Conditions - People with emphysema (%)
Medical Conditions - People with thyroid problem (%)
Medical Conditions - People with chronic bronchitis (%)
Medical Conditions - People with any liver condition (%)
Medical Conditions - People who ever had cancer or malignancy (%)
Mental Health - People who have little interest in doing things (%)
Mental Health - People feeling down, depressed, or hopeless (%)
Mental Health - People who have trouble sleeping or sleeping too much (%)
Mental Health - People feeling tired or having little energy (%)
Mental Health - People with poor appetite or overeating (%)
Mental Health - People feeling bad about themself (%)
Mental Health - People who have trouble concentrating on things (%)
Mental Health - People moving or speaking slowly or too fast (%)
Mental Health - People having thoughts they would be better off dead (%)
Oral Health - Average years since last visit a dentist
Oral Health - People embarrassed because of mouth (%)
Oral Health - People with gum disease (%)
Oral Health - General health of teeth and gums (%)
Oral Health - Average days a week using dental floss/device
Oral Health - Average days a week using mouthwash for dental problem
Oral Health - Average number of teeth
Pesticide Use - Households using pesticides to control insects (%)
Pesticide Use - Households using pesticides to kill weeds (%)
Physical Activity - People doing vigorous-intensity work activities (%)
Physical Activity - People doing moderate-intensity work activities (%)
Physical Activity - People walking or bicycling (%)
Physical Activity - People doing vigorous-intensity recreational activities (%)
Physical Activity - People doing moderate-intensity recreational activities (%)
Physical Activity - Average hours a day doing sedentary activities
Physical Activity - Average hours a day watching TV or videos
Physical Activity - Average hours a day using computer
Physical Functioning - People having limitations keeping them from working (%)
Physical Functioning - People limited in amount of work they can do (%)
Physical Functioning - People that need special equipment to walk (%)
Physical Functioning - People experiencing confusion/memory problems (%)
Physical Functioning - People requiring special healthcare equipment (%)
Prescription Medications - Average number of prescription medicines taking
Preventive Aspirin Use - Adults 40+ taking low-dose aspirin (%)
Reproductive Health - Vaginal deliveries (%)
Reproductive Health - Cesarean deliveries (%)
Reproductive Health - Deliveries resulted in a live birth (%)
Reproductive Health - Pregnancies resulted in a delivery (%)
Reproductive Health - Women breastfeeding newborns (%)
Reproductive Health - Women that had a hysterectomy (%)
Reproductive Health - Women that had both ovaries removed (%)
Reproductive Health - Women that have ever taken birth control pills (%)
Reproductive Health - Women taking birth control pills (%)
Reproductive Health - Women that have ever used Depo-Provera or injectables (%)
Reproductive Health - Women that have ever used female hormones (%)
Sexual Behavior - People 18+ that ever had sex (vaginal, anal, or oral) (%)
Sexual Behavior - Males 18+ that ever had vaginal sex with a woman (%)
Sexual Behavior - Males 18+ that ever performed oral sex on a woman (%)
Sexual Behavior - Males 18+ that ever had anal sex with a woman (%)
Sexual Behavior - Males 18+ that ever had any sex with a man (%)
Sexual Behavior - Females 18+ that ever had vaginal sex with a man (%)
Sexual Behavior - Females 18+ that ever performed oral sex on a man (%)
Sexual Behavior - Females 18+ that ever had anal sex with a man (%)
Sexual Behavior - Females 18+ that ever had any kind of sex with a woman (%)
Sexual Behavior - Average age people first had sex
Sexual Behavior - Average number of female sex partners in lifetime (males 18+)
Sexual Behavior - Average number of female vaginal sex partners in lifetime (males 18+)
Sexual Behavior - Average age people first performed oral sex on a woman (18+)
Sexual Behavior - Average number of woman performed oral sex on in lifetime (18+)
Sexual Behavior - Average number of male sex partners in lifetime (males 18+)
Sexual Behavior - Average number of male anal sex partners in lifetime (males 18+)
Sexual Behavior - Average age people first performed oral sex on a man (18+)
Sexual Behavior - Average number of male oral sex partners in lifetime (18+)
Sexual Behavior - People using protection when performing oral sex (%)
Sexual Behavior - Average number of times people have vaginal or anal sex a year
Sexual Behavior - People having sex without condom (%)
Sexual Behavior - Average number of male sex partners in lifetime (females 18+)
Sexual Behavior - Average number of male vaginal sex partners in lifetime (females 18+)
Sexual Behavior - Average number of female sex partners in lifetime (females 18+)
Sexual Behavior - Circumcised males 18+ (%)
Sleep Disorders - Average hours sleeping at night
Sleep Disorders - People that has trouble sleeping (%)
Smoking-Cigarette Use - People smoking cigarettes (%)
Taste & Smell - People 40+ having problems with smell (%)
Taste & Smell - People 40+ having problems with taste (%)
Taste & Smell - People 40+ that ever had wisdom teeth removed (%)
Taste & Smell - People 40+ that ever had tonsils teeth removed (%)
Taste & Smell - People 40+ that ever had a loss of consciousness because of a head injury (%)
Taste & Smell - People 40+ that ever had a broken nose or other serious injury to face or skull (%)
Taste & Smell - People 40+ that ever had two or more sinus infections (%)
Weight - Average height (inches)
Weight - Average weight (pounds)
Weight - Average BMI
Weight - People that are obese (%)
Weight - People that ever were obese (%)
Weight - People trying to lose weight (%)
100%
urban population.
Estimated median house/condo value in 2022: $143,370
76104:
$143,370Texas:
$275,400
Median resident age: This zip code:
32.8 yearsTexas median age:
35.6 years
Average household size: This zip code:
2.4 peopleTexas:
2.6 people
Averages for the 2020 tax year for zip code 76104, filed in 2021:
Average Adjusted Gross Income (AGI) in 2020: $40,655 (Individual Income Tax Returns) Here:
$40,655State:
$77,054
Salary/wage: $38,853 (reported on 87.5% of returns )Here:
$38,853State:
$62,766
(% of AGI for various income ranges: 1246.1% for AGIs below $25k , 3746.8% for AGIs $25k-50k , 7064.8% for AGIs $50k-75k , 10477.8% for AGIs $75k-100k , 19409.6% for AGIs $100k-200k , 75380.0% for AGIs over 200k ) Taxable interest for individuals: $2,791 (reported on 9.0% of returns )This zip code:
$2,791Texas:
$2,665
(% of AGI for various income ranges: 1.2% for AGIs below $25k , 2.3% for AGIs $25k-50k , 8.8% for AGIs $50k-75k , 11.9% for AGIs $75k-100k , 30.4% for AGIs $100k-200k , 5235.0% for AGIs over 200k ) Ordinary dividends: $3,377 (reported on 6.0% of returns )(% of AGI for various income ranges: 1.0% for AGIs below $25k , 4.8% for AGIs $25k-50k , 13.4% for AGIs $50k-75k , 72.8% for AGIs $75k-100k , 107.2% for AGIs $100k-200k , 2765.0% for AGIs over 200k ) Net capital gain/loss in AGI: +$4,902 (reported on 6.5% of returns )Here:
+$4,902State:
+$39,590
(% of AGI for various income ranges: 1.5% for AGIs below $25k , 10.1% for AGIs $25k-50k , 11.1% for AGIs $50k-75k , 49.7% for AGIs $75k-100k , 329.2% for AGIs $100k-200k , 4045.0% for AGIs over 200k ) Profit/loss from business: +$6,223 (reported on 22.0% of returns )Here:
+$6,223State:
+$10,888
(% of AGI for various income ranges: 139.3% for AGIs below $25k , 66.1% for AGIs $25k-50k , 160.7% for AGIs $50k-75k , 153.6% for AGIs $75k-100k , 696.4% for AGIs $100k-200k , 6627.5% for AGIs over 200k ) Taxable individual retirement arrangement distribution: $12,986 (reported on 1.5% of returns )76104:
$12,986Texas:
$24,740
(% of AGI for various income ranges: 6.8% for AGIs below $25k , 21.7% for AGIs $25k-50k , 160.6% for AGIs $75k-100k , 180.8% for AGIs $100k-200k ) Total itemized deductions: $26,541 (reported on 3.0% of returns )Here:
$26,541State:
$40,428
(% of AGI for various income ranges: 18.2% for AGIs below $25k , 58.1% for AGIs $25k-50k , 104.6% for AGIs $50k-75k , 295.6% for AGIs $75k-100k , 594.0% for AGIs $100k-200k , 5037.5% for AGIs over 200k ) Charity contributions: $9,229 (reported on 2.2% of returns )(% of AGI for various income ranges: 14.9% for AGIs $25k-50k , 28.4% for AGIs $50k-75k , 81.1% for AGIs $75k-100k , 175.2% for AGIs $100k-200k , 1385.0% for AGIs over 200k ) Taxes paid: $6,441 (reported on 2.8% of returns )(% of AGI for various income ranges: 14.2% for AGIs $25k-50k , 24.0% for AGIs $50k-75k , 61.4% for AGIs $75k-100k , 184.4% for AGIs $100k-200k , 1155.0% for AGIs over 200k ) Earned income credit: $2,911 (reported on 31.2% of returns )(% of AGI for various income ranges: 176.3% for AGIs below $25k , 97.2% for AGIs $25k-50k , 1.4% for AGIs $50k-75k ) Percentage of individuals using paid preparers for their 2020 taxes: 93.0%(% for various income ranges: 91.3% for AGIs below $25k , 94.0% for AGIs $25k-50k , 95.2% for AGIs $50k-75k , 93.9% for AGIs $75k-100k , 92.9% for AGIs $100k-200k , 100.0% for AGIs over 200k )
Averages for the 2012 tax year for zip code 76104, filed in 2013:
Average Adjusted Gross Income (AGI) in 2012: $32,843 (Individual Income Tax Returns) Here:
$32,843State:
$65,384
Salary/wage: $26,420 (reported on 86.1% of returns )Here:
$26,420State:
$52,524
(% of AGI for various income ranges: 79.6% for AGIs below $25k , 92.9% for AGIs $25k-50k , 88.2% for AGIs $50k-75k , 82.8% for AGIs $75k-100k , 78.7% for AGIs $100k-200k , 18.9% for AGIs over 200k ) Taxable interest for individuals: $1,320 (reported on 6.8% of returns )This zip code:
$1,320Texas:
$2,372
(% of AGI for various income ranges: 0.1% for AGIs $25k-50k , 0.1% for AGIs $50k-75k , 1.0% for AGIs $100k-200k , 0.5% for AGIs over 200k ) Ordinary dividends: $9,458 (reported on 3.7% of returns )(% of AGI for various income ranges: 0.5% for AGIs below $25k , 0.4% for AGIs $25k-50k , 0.6% for AGIs $50k-75k , 2.4% for AGIs $100k-200k , 2.3% for AGIs over 200k ) Net capital gain/loss in AGI: +$28,487 (reported on 2.3% of returns )Here:
+$28,487State:
+$35,319
(% of AGI for various income ranges: 0.2% for AGIs $25k-50k , 1.7% for AGIs $100k-200k , 7.4% for AGIs over 200k ) Profit/loss from business: +$8,229 (reported on 23.3% of returns )Here:
+$8,229State:
+$13,732
(% of AGI for various income ranges: 13.7% for AGIs below $25k , 0.9% for AGIs $25k-50k , 2.8% for AGIs $50k-75k , 3.1% for AGIs $75k-100k , 19.1% for AGIs $100k-200k ) Taxable individual retirement arrangement distribution: $9,221 (reported on 2.1% of returns )76104:
$9,221Texas:
$19,511
(% of AGI for various income ranges: 0.4% for AGIs below $25k , 0.9% for AGIs $25k-50k , 5.4% for AGIs $75k-100k ) Total itemized deductions: $22,500 (15% of AGI, reported on 8.5% of returns )Here:
$22,500State:
$24,724
Here:
15.2% of AGIState:
15.9% of AGI
(% of AGI for various income ranges: 2.4% for AGIs below $25k , 5.8% for AGIs $25k-50k , 9.6% for AGIs $50k-75k , 9.4% for AGIs $75k-100k , 12.6% for AGIs $100k-200k , 4.9% for AGIs over 200k ) Charity contributions: $8,073 (reported on 6.2% of returns )(% of AGI for various income ranges: 0.4% for AGIs below $25k , 1.3% for AGIs $25k-50k , 1.9% for AGIs $50k-75k , 2.4% for AGIs $75k-100k , 2.4% for AGIs $100k-200k , 2.5% for AGIs over 200k ) Taxes paid: $4,858 (reported on 8.1% of returns )(% of AGI for various income ranges: 0.2% for AGIs below $25k , 0.8% for AGIs $25k-50k , 1.7% for AGIs $50k-75k , 2.3% for AGIs $75k-100k , 3.3% for AGIs $100k-200k , 1.4% for AGIs over 200k ) Earned income credit: $2,973 (reported on 45.4% of returns )(% of AGI for various income ranges: 14.0% for AGIs below $25k , 1.8% for AGIs $25k-50k ) Percentage of individuals using paid preparers for their 2012 taxes: 61.0%(% for various income ranges: 63.7% for AGIs below $25k , 57.8% for AGIs $25k-50k , 51.3% for AGIs $50k-75k , 46.2% for AGIs $75k-100k , 53.8% for AGIs $100k-200k , 75.0% for AGIs over 200k )
Averages for the 2004 tax year for zip code 76104, filed in 2005:
Average Adjusted Gross Income (AGI) in 2004: $23,867 (Individual Income Tax Returns) Here:
$23,867State:
$47,881
Salary/wage: $20,844 (reported on 90.8% of returns )Here:
$20,844State:
$41,947
(% of AGI for various income ranges: 88.8% for AGIs below $10k , 92.4% for AGIs $10k-25k , 92.5% for AGIs $25k-50k , 83.6% for AGIs $50k-75k , 73.7% for AGIs $75k-100k , 32.2% for AGIs over 100k ) Taxable interest for individuals: $2,202 (reported on 9.7% of returns )This zip code:
$2,202Texas:
$2,255
(% of AGI for various income ranges: 0.5% for AGIs below $10k , 0.2% for AGIs $10k-25k , 0.3% for AGIs $25k-50k , 0.9% for AGIs $50k-75k , 0.6% for AGIs $75k-100k , 3.1% for AGIs over 100k ) Taxable dividends: $4,029 (reported on 3.7% of returns )(% of AGI for various income ranges: 0.4% for AGIs below $10k , 0.0% for AGIs $10k-25k , 0.0% for AGIs $25k-50k , 0.5% for AGIs $50k-75k , 0.3% for AGIs $75k-100k , 2.7% for AGIs over 100k ) Net capital gain/loss: +$42,580 (reported on 2.7% of returns )Here:
+$42,580State:
+$16,110
(% of AGI for various income ranges: -0.1% for AGIs below $10k , -0.0% for AGIs $10k-25k , 0.1% for AGIs $25k-50k , -0.1% for AGIs $50k-75k , 25.5% for AGIs over 100k ) Profit/loss from business: +$4,523 (reported on 11.7% of returns )Here:
+$4,523State:
+$11,013
(% of AGI for various income ranges: 8.2% for AGIs below $10k , 2.0% for AGIs $10k-25k , 0.5% for AGIs $25k-50k , 1.6% for AGIs $50k-75k , 4.2% for AGIs over 100k ) IRA payment deduction: $1,741 (reported on 1.0% of returns )Total itemized deductions: $21,992 (24% of AGI, reported on 6.6% of returns )Here:
$21,992State:
$19,631
Here:
24.1% of AGIState:
18.9% of AGI
(% of AGI for various income ranges: 1.8% for AGIs $10k-25k , 5.6% for AGIs $25k-50k , 9.1% for AGIs $50k-75k , 8.7% for AGIs $75k-100k , 14.0% for AGIs over 100k ) Charity contributions deductions: $11,942 (12% of AGI, reported on 5.6% of returns )Here:
12.1% of AGIState:
4.2% of AGI
(% of AGI for various income ranges: 0.4% for AGIs $10k-25k , 1.5% for AGIs $25k-50k , 2.2% for AGIs $50k-75k , 2.1% for AGIs $75k-100k , 10.2% for AGIs over 100k ) Total tax: $4,158 (reported on 46.8% of returns )(% of AGI for various income ranges: 2.0% for AGIs below $10k , 2.5% for AGIs $10k-25k , 5.2% for AGIs $25k-50k , 10.4% for AGIs $50k-75k , 13.3% for AGIs $75k-100k , 22.1% for AGIs over 100k ) Earned income credit: $2,175 (reported on 49.5% of returns )Percentage of individuals using paid preparers for their 2004 taxes: 68.1%(% for various income ranges: 64.2% for AGIs below $10k , 74.3% for AGIs $10k-25k , 62.1% for AGIs $25k-50k , 57.3% for AGIs $50k-75k , 62.5% for AGIs $75k-100k , 81.7% for AGIs over 100k )
Estimated median household income in 2022: This zip code:
$45,624Texas:
$72,284
Nearest zip codes: 76110 ,
76102 ,
76105 ,
76103 ,
76129 ,
76115 .
Fort Worth Zip Code Map
Percentage of family households: This zip code:
40.3%Texas:
50.5%
Percentage of households with unmarried partners: This zip code:
7.8%Texas:
48.7%
Likely homosexual households (counted as self-reported same-sex unmarried-partner households)
Lesbian couples: 0.0% of all households Gay men: 0.2% of all households
Household received Food Stamps/SNAP in the past 12 months: 1,880Household did not receive Food Stamps/SNAP in the past 12 months: 5,970
Women who had a birth in the past 12 months: 195 (103 now married , 90 unmarried) Women who did not have a birth in the past 12 months: 5,215 (1,744 now married , 3,487 unmarried)
Housing units in zip code 76104 with a mortgage: 1,137 (8
second mortgage , 5
both second mortgage and home equity loan )
Houses without a mortgage: 61
Median monthly owner costs for units with a mortgage: $1,448
Median monthly owner costs for units without a mortgage: $381
Residents with income below the poverty level in 2022:
This zip code:
31.9%Whole state:
14.0%
Residents with income below 50% of the poverty level in 2022:
This zip code:
18.6%Whole state:
7.4%
Median number of rooms in houses and condos: Median number of rooms in apartments: Notable locations in this zip code not listed on our city pages
Click to draw/clear zip code borders Notable locations in zip code 76104: (A) , Fort Worth Fire Department Station 5 (B) , Fort Worth Fire Department Station 8 Headquarters (C) , Tarrant County Black Historical and Genealogical Museum (D) , Area Metropolitan Ambulance Authority - MedStar Emergency Medical Services (E) , CareFlite Ambulance Fort Worth (F) , Tarrant Youth Recovery Campus (G) , Wharton-Scott House (H) , South Side Masonic Lodge Number 1114 (I) . Display/hide their locations on the map
Churches in zip code 76104 include: (A) , Saint Andrews Church (B) , Evans Avenue Church (C) , Saint Mary of the Assumption Church (D) , Berean Church (E) , New Beginning Holiness Church (F) , Highland Park Church (G) , Berean Church (H) , New Jerusalem Baptist Church (I) . Display/hide their locations on the map
Cemetery: (1) . Display/hide its location on the map
Parks in zip code 76104 include: (1) , Van Zandt Guinn Park (2) , Hillside Park (3) . Display/hide their locations on the map
Tourist attraction (not listed on the city page) :
Year house built (houses)
147 2020 or later2,443 2010 to 20191,130 2000 to 2009647 1990 to 1999243 1980 to 1989582 1970 to 1979631 1960 to 19691,047 1950 to 1959671 1940 to 19491,750 1939 or earlier
Zip code 76104 household income distribution in 2022 615 Less than $10,000772 $10,000 to $14,999501 $15,000 to $19,999321 $20,000 to $24,999360 $25,000 to $29,999630 $30,000 to $34,999270 $35,000 to $39,999369 $40,000 to $44,999304 $45,000 to $49,999589 $50,000 to $59,9991,145 $60,000 to $74,999887 $75,000 to $99,999344 $100,000 to $124,999234 $125,000 to $149,999253 $150,000 to $199,999251 $200,000 or moreEstimate of home value of owner-occupied houses/condos in 2022 in zip code 76104 18 $10,000 to $14,99930 $20,000 to $24,99929 $25,000 to $29,99946 $35,000 to $39,99932 $40,000 to $49,999228 $50,000 to $59,999130 $60,000 to $69,99951 $70,000 to $79,999227 $80,000 to $89,99963 $90,000 to $99,999413 $100,000 to $124,999308 $125,000 to $149,999216 $150,000 to $174,99992 $175,000 to $199,999137 $200,000 to $249,999134 $250,000 to $299,99975 $300,000 to $399,999138 $400,000 to $499,999109 $500,000 to $749,99998 $750,000 to $999,9999 $1,000,000 to $1,499,99966 $2,000,000 or moreRent paid by renters in 2022 in zip code 76104 26 Less than $10031 $100 to $14988 $150 to $19920 $200 to $24952 $250 to $29958 $300 to $349136 $350 to $39929 $400 to $44933 $450 to $499130 $500 to $54944 $550 to $599149 $600 to $649127 $650 to $699118 $700 to $749219 $750 to $799352 $800 to $899356 $900 to $999780 $1,000 to $1,249652 $1,250 to $1,499901 $1,500 to $1,999251 $2,000 to $2,4993 $2,500 to $2,99997 $3,000 to $3,49981 No cash rent
Median gross rent in 2022: $1,292.
Median price asked for vacant for-sale houses and condos in 2022: $247,927.
Estimated median house (or condo) value in 2022 for: White Non-Hispanic householders: $248,360Black or African American householders: $135,870American Indian or Alaska Native householders: $2,389,647Asian householders: $419,081Some other race householders: $157,486Two or more races householders: $248,802Hispanic or Latino householders: $156,163Estimated median house or condo value in 2022: $143,370
76104:
$143,370Texas:
$275,400
Lower value quartile - upper value quartile: $97,197 - $205,303
Mean price in 2022: Detached houses: $308,615Here:
$308,615State:
$369,058
Townhouses or other attached units: $402,980Here:
$402,980State:
$327,631
In 2-unit structures: $1,059,671Here:
$1,059,671State:
$374,947
In 3-to-4-unit structures: $380,479Here:
$380,479State:
$209,652
In 5-or-more-unit structures: $247,584Here:
$247,584State:
$413,944
Mobile homes: $73,546Here:
$73,546State:
$124,413
Occupied boats, RVs, vans, etc.: $5,332
Housing units in structures:
One, detached: 4,861One, attached: 260Two: 4063 or 4: 3545 to 9: 40210 to 19: 38420 to 49: 52550 or more: 2,321Mobile homes: 57Boats, RVs, vans, etc.: 6Unemployment : 5.1%
Means of transportation to work in zip code 76104 66.2% 5,295 Drove a car alone15.0% 1,196 Carpooled1.1% 84 Bus or trolley bus0.1% 10 Subway or elevated0.9% 68 Bicycle4.5% 360 Walked0.6% 51 Other means11.0% 877 Worked at homeTravel time to work (commute) in zip code 76104 159 Less than 5 minutes781 5 to 9 minutes1,049 10 to 14 minutes1,288 15 to 19 minutes1,251 20 to 24 minutes268 25 to 29 minutes906 30 to 34 minutes217 35 to 39 minutes269 40 to 44 minutes333 45 to 59 minutes372 60 to 89 minutes145 90 or more minutes
Neighborhoods in zip code 76104: Percentage of zip code residents living and working in this county: 88.6%
Household type by relationship:
Households: 19,422
Male householders: 3,554 (1,401 living alone ), Female householders: 4,258 (1,694 living alone )2,285 spouses (2,257 opposite-sex spouses ), 654 unmarried partners , (595 opposite-sex unmarried partners ), 6,462 children (6,279 natural , 50 adopted , 131 stepchildren ), 537 grandchildren , 400 brothers or sisters , 143 parents , 0 foster children , 210 other relatives , 366 non-relatives In group quarters: 585 (-1 institutionalized population )
Size of family households: 1,649 2-persons , 729 3-persons , 718 4-persons , 584 5-persons , 339 6-persons , 111 7-or-more-persons
Size of nonfamily households: 3,094 1-person , 597 2-persons , 6 3-persons , 19 4-persons
2,816 married couples with children. single-parent households (766 men , 1,158 women ).
55.2% of residents of 76104 zip code speak English at home. of residents speak Spanish at home (57% very well, 19% well, 16% not well, 7% not at all ).of residents speak other Indo-European language at home (45% very well, 39% well, 13% not well, 2% not at all ).of residents speak Asian or Pacific Island language at home (66% very well, 9% well, 8% not well, 17% not at all ).of residents speak other language at home (69% very well, 19% well, 12% not well ).
Foreign born population: 4,096 (21.1%)
(23.3%
of them are naturalized citizens )
This zip code:
21.1%Whole state:
17.2%
68% Honduras 3% Georgia 3% Guatemala 3% United Kingdom, excluding England and Scotland 2% Thailand 2% Sweden 2% Uruguay 3% American 2% German 2% Sudanese 1% English 1% Iraqi 1% European 1% Somali
Year of entry for the foreign-born population
1,253 2010 or later 1,568 2000 to 2009 820 1990 to 1999 709 Before 1990
There are
298 Internal Medicine Specialists 198 Nurse Practitioners 162 Radiologists 147 Pediatrics 113 Nurse Anesthetists 90 Family Medicine Specialists 84 Physician Assistants 82 Emergency Medicine Specialists 878 Other Medical Specialists in Zip Code 76104.
Facilities with environmental interests located in this zip code:
ACCELERATED H S (1066 W MAGNOLIA in FORT WORTH, TX)
(National Center for Education Statistics) - STATE ID-220905230 Organizations: FORT WORTH ISD (SCHOOL DISTRICT)
AAA WASTE SYSTEMS INC (12300 SOUTH FREEWAY in FORT WORTH, TX)
(Resource Conservation and Recovery Act (tracking hazardous waste)) Alternative names: AAA WASTE DISPOSAL
ACE BATTERY CO (1408 BESSIE ST in FORT WORTH, TX)
(Resource Conservation and Recovery Act (tracking hazardous waste)) Alternative names: ACE BATTERY MFG CO TEXAS
ACTION AUTO PARTS (2212 S RIVERSIDE DR in FORT WORTH, TX)
National Pollutant Discharge Elimination System NON-MAJOR (Tracking pollutant discharge elimination systems) - permit
BACY'S DRY CLEANING (602 EAST BARRY in FORT WORTH, TX)
AIR MINOR (AIRS/AFS) Business SIC classification: DRYCLEANING PLANTS, EXCEPT RUG CLEANING
Housing units lacking complete plumbing facilities: 1.7%
Housing units lacking complete kitchen facilities: 2.6%
72.9% Electricity 25.7% Utility gas 0.9% No fuel used 0.5% Bottled, tank, or LP gas
Population in 1990: 20,012.
Place of birth for U.S.-born residents:
This state: 12,215Northeast: 207Midwest: 797South: 1,025West: 725
49% of the 76104 zip code residents lived in the same house 5 years ago.
Out of people who lived in different houses, 78% lived in this county.
Out of people who lived in different counties, 50% lived in Texas.
83% of the 76104 zip code residents lived in the same house 1 year ago.
Out of people who lived in different houses, 68% moved from this county.
Out of people who lived in different houses, 13% moved from different county within same state.
Out of people who lived in different houses, 7% moved from different state.
Out of people who lived in different houses, 7% moved from abroad.
Private vs. public school enrollment:
Students in private schools in grades 1 to 8 (elementary and middle school): 119
Students in private schools in grades 9 to 12 (high school): 6
Students in private undergraduate colleges: 70
Occupation by median earnings in the past 12 months ($)
76,065 Architecture and engineering occupations 74,603 Business and financial operations occupations 73,947 Life, physical, and social science occupations 71,064 Computer and mathematical occupations 69,461 Fire fighting and prevention, and other protective service workers including supervisors 66,898 Management occupations
Companies with federal contracts located in this zip code (FORT WORTH, TX):
ENVIRONMENTAL RESEARCH GROUP, (1312 5TH AVENUE; small business) in 38 contracts from 2002 to 2006
Contracts for Feasibility Studies (non-construction), Other Environmental Services, Studies, and Analytical Support, Environmental Studies and Assessments, Other Special Studies and Analyses, and more by Army, U.S. Army Corps of Engineers - civil program financing only, Federal Emergency Management AgencySigned by year: 2000: $0; 2001: $0; 2002: $27,508; 2003: $84,578; 2004: $299,132; 2005: $642,728; 2006: $2,333,389.
Biggest contracts: with Army for Feasibility Studies (non-construction). Taking place in LA. Signed on 2006-04-21. Completion date: 2006-10-23.
with Army for Other Environmental Services, Studies, and Analytical Support. Taking place in MD. Signed on 2005-03-09. Completion date: 2005-01-26.
with Army for Feasibility Studies (non-construction). Taking place in LA. Signed on 2006-04-10. Completion date: 2006-03-23.
with Army for Other Environmental Services, Studies, and Analytical Support. Taking place in MD. Signed on 2006-03-22. Completion date: 2006-01-25.
MW CROW INC (200 LUXTON ST; small business) in 15 contracts from 2005 to 2006
Contracts for Guns, over 150 mm through 200 mm, Guns, 75 mm through 125 mm, Guns, over 30 mm up to 75 mm, Hardware, Commercial, and more by Army, Air ForceSigned by year: 2000: $0; 2001: $0; 2002: $0; 2003: $0; 2004: $0; 2005: $414,070; 2006: $315,084.
Biggest contracts: with Army for Guns, over 150 mm through 200 mm. Signed on 2005-08-17. Completion date: 2006-06-21.
with Army for Guns, 75 mm through 125 mm. Signed on 2005-10-20. Completion date: 2007-01-15.
, same as above. Signed on 2006-05-30. Completion date: 2007-01-15.
with Army for Guns, over 150 mm through 200 mm. Signed on 2005-10-06. Completion date: 2006-06-21.
COMMUNICON LTD (101 SAINT LOUIS AVE; small business) in 2 contracts in 2005
$32,554 with Navy for Installation of Equipment -- Communication, Detection, and Coherent Radiation Equipment. Signed on 2005-09-29. Completion date: 2005-11-01.
with Navy for Video Recording and Reproducing Equipment. Signed on 2005-09-07. Completion date: 2005-09-30.
ICI INTERNATIONAL INC (712 E STELLA STREET) in 4 contracts in 2005
$5,000 with Army for Jewelry. Taking place in SC. Signed on 2005-01-04. Completion date: 2005-03-21.
with U.S. Army Corps of Engineers - civil program financing only for Jewelry. Taking place in SC. Signed on 2005-01-04. Completion date: 2005-03-21.
with Army for Jewelry. Taking place in SC. Signed on 2005-02-18. Completion date: 2005-03-21.
with U.S. Army Corps of Engineers - civil program financing only for Jewelry. Taking place in SC. Signed on 2005-02-18. Completion date: 2005-03-21.
D B S P INC (1227 W MAGNOLIA AVE; small business)
$9,990 with Army for ADP Software. Signed on 2002-05-14. Completion date: 2002-05-17.
DAVIES, J B (1412 W MAGNOLIA AVE; small business)
$3,941 with Army for Land Surveys, Cadastral Services (non-construction). Signed on 2003-10-27. Completion date: 2003-11-28.
builders equipment and supply (320 E BROADWAY; small business)
$2,526 with Bureau of Prisoners/Federal Prison System for Building Components, Prefabricated. Signed on 2005-03-08. Completion date: 2005-03-14.
Top industries in this zip code by the number of employees in 2005:
Health Care and Social Assistance: General Medical and Surgical Hospitals (over 1000 employees: 5 establishments)Health Care and Social Assistance: Offices of Physicians (except Mental Health Specialists) (100-249: 1, 50-99: 5, 20-49: 22, 10-19: 31, 5-9: 77, 1-4: 137)Management of Companies and Enterprises: Corporate, Subsidiary, and Regional Managing Offices (250-499: 2, 100-249: 1, 50-99: 3, 20-49: 2, 5-9: 2, 1-4: 1)Health Care and Social Assistance: Nursing Care Facilities (100-249: 2, 50-99: 4, 20-49: 1)Administrative and Support and Waste Management and Remediation Services: Temporary Help Services (250-499: 1, 50-99: 1, 20-49: 1)Construction: Plumbing, Heating, and Air-Conditioning Contractors (250-499: 1, 20-49: 1, 10-19: 2, 1-4: 3)Health Care and Social Assistance: Home Health Care Services (250-499: 1, 20-49: 1)Health Care and Social Assistance: Diagnostic Imaging Centers (100-249: 1, 50-99: 1, 20-49: 1, 10-19: 3, 5-9: 2, 1-4: 3)
People in group quarters in 2010:
409 people in nursing facilities/skilled-nursing facilities
87 people in group homes intended for adults
83 people in mental (psychiatric) hospitals and psychiatric units in other hospitals
63 people in other noninstitutional facilities
38 people in emergency and transitional shelters (with sleeping facilities) for people experiencing homelessness
12 people in residential treatment centers for adults
People in group quarters in 2000:
992 people in nursing homes
282 people in other noninstitutional group quarters
49 people in orthopedic wards and institutions for the physically handicapped
39 people in mental (psychiatric) hospitals or wards
28 people in other group homes
21 people in hospitals or wards for drug/alcohol abuse
21 people in unknown juvenile institutions
20 people in homes for the mentally ill
15 people in other nonhousehold living situations
9 people in homes for the mentally retarded
7 people in hospitals/wards and hospices for chronically ill
7 people in other hospitals or wards for chronically ill
2 people in religious group quarters
Fatal accident statistics in 2014:
Fatal accident count: 2Vehicles involved in fatal accidents: 3Fatal accidents caused by drunken drivers: 1Fatalities: 2Persons involved in fatal accidents: 4Pedestrians involved in fatal accidents: 1
Fatal accident statistics in 2013:
Fatal accident count: 4Vehicles involved in fatal accidents: 5Fatal accidents caused by drunken drivers: 2Fatalities: 4Persons involved in fatal accidents: 8Pedestrians involved in fatal accidents: 2
Home Mortgage Disclosure Act Aggregated Statistics For Year 2009(Based on 10 full and 12 partial tracts) A) FHA, FSA/RHS & VA B) Conventional C) Refinancings D) Home Improvement Loans E) Loans on Dwellings For 5+ Families F) Non-occupant Loans on Number Average Value Number Average Value Number Average Value Number Average Value Number Average Value Number Average Value
LOANS ORIGINATED 41 $135,845 55 $137,699 57 $164,635 15 $94,465 1 $2,053,350 10 $100,353 APPLICATIONS APPROVED, NOT ACCEPTED 4 $72,702 7 $79,036 13 $100,342 0 $0 0 $0 9 $92,219 APPLICATIONS DENIED 7 $105,799 23 $84,899 59 $90,077 45 $22,442 0 $0 18 $49,525 APPLICATIONS WITHDRAWN 13 $112,148 15 $106,289 24 $80,762 11 $48,326 0 $0 8 $61,635 FILES CLOSED FOR INCOMPLETENESS 1 $99,000 3 $115,227 10 $116,201 7 $34,937 0 $0 2 $45,075
Aggregated Statistics For Year 2008(Based on 10 full and 12 partial tracts) A) FHA, FSA/RHS & VA B) Conventional C) Refinancings D) Home Improvement Loans E) Loans on Dwellings For 5+ Families F) Non-occupant Loans on Number Average Value Number Average Value Number Average Value Number Average Value Number Average Value Number Average Value
LOANS ORIGINATED 32 $105,782 80 $109,776 53 $108,851 17 $44,534 3 $799,327 42 $89,375 APPLICATIONS APPROVED, NOT ACCEPTED 12 $83,389 12 $62,972 7 $72,714 6 $19,845 0 $0 3 $66,443 APPLICATIONS DENIED 18 $93,923 33 $86,778 93 $65,143 96 $31,308 4 $684,575 48 $68,853 APPLICATIONS WITHDRAWN 7 $96,516 11 $109,217 30 $87,332 11 $28,265 0 $0 13 $70,690 FILES CLOSED FOR INCOMPLETENESS 6 $88,227 8 $60,710 12 $56,218 7 $27,176 0 $0 9 $58,973
Aggregated Statistics For Year 2007(Based on 10 full and 12 partial tracts) A) FHA, FSA/RHS & VA B) Conventional C) Refinancings D) Home Improvement Loans E) Loans on Dwellings For 5+ Families F) Non-occupant Loans on G) Loans On Manufactured Number Average Value Number Average Value Number Average Value Number Average Value Number Average Value Number Average Value Number Average Value
LOANS ORIGINATED 23 $95,653 168 $102,669 88 $99,397 34 $49,344 4 $3,635,828 78 $84,900 1 $55,020 APPLICATIONS APPROVED, NOT ACCEPTED 3 $88,743 45 $88,850 29 $64,486 8 $32,409 0 $0 29 $64,118 2 $84,165 APPLICATIONS DENIED 8 $101,022 130 $74,357 187 $70,648 143 $26,982 3 $849,173 96 $70,419 5 $54,000 APPLICATIONS WITHDRAWN 5 $112,952 45 $95,436 57 $78,554 14 $34,795 3 $593,477 14 $73,927 0 $0 FILES CLOSED FOR INCOMPLETENESS 2 $94,575 10 $101,068 16 $83,596 7 $34,863 0 $0 7 $41,516 0 $0
Aggregated Statistics For Year 2006(Based on 10 full and 12 partial tracts) A) FHA, FSA/RHS & VA B) Conventional C) Refinancings D) Home Improvement Loans E) Loans on Dwellings For 5+ Families F) Non-occupant Loans on G) Loans On Manufactured Number Average Value Number Average Value Number Average Value Number Average Value Number Average Value Number Average Value Number Average Value
LOANS ORIGINATED 11 $78,235 318 $72,951 118 $74,520 32 $35,824 6 $330,783 187 $64,266 0 $0 APPLICATIONS APPROVED, NOT ACCEPTED 2 $37,500 49 $71,137 31 $53,175 6 $44,442 0 $0 27 $60,374 2 $31,465 APPLICATIONS DENIED 5 $56,588 138 $64,891 179 $67,357 135 $24,801 0 $0 142 $62,643 4 $37,508 APPLICATIONS WITHDRAWN 7 $109,646 85 $86,871 102 $74,842 15 $27,163 0 $0 50 $60,596 0 $0 FILES CLOSED FOR INCOMPLETENESS 0 $0 9 $50,392 20 $61,577 4 $25,118 0 $0 5 $51,024 0 $0
Aggregated Statistics For Year 2005(Based on 10 full and 12 partial tracts) A) FHA, FSA/RHS & VA B) Conventional C) Refinancings D) Home Improvement Loans E) Loans on Dwellings For 5+ Families F) Non-occupant Loans on G) Loans On Manufactured Number Average Value Number Average Value Number Average Value Number Average Value Number Average Value Number Average Value Number Average Value
LOANS ORIGINATED 25 $76,112 247 $77,475 141 $79,417 37 $68,445 7 $3,132,904 181 $68,224 0 $0 APPLICATIONS APPROVED, NOT ACCEPTED 1 $62,000 54 $73,485 24 $87,092 9 $41,170 0 $0 32 $55,259 1 $54,240 APPLICATIONS DENIED 5 $59,004 164 $70,837 226 $54,949 119 $26,547 0 $0 122 $61,086 7 $34,943 APPLICATIONS WITHDRAWN 4 $65,287 71 $76,150 145 $77,238 43 $122,772 0 $0 31 $83,973 2 $12,875 FILES CLOSED FOR INCOMPLETENESS 0 $0 10 $97,514 33 $85,797 0 $0 0 $0 1 $64,000 0 $0
Aggregated Statistics For Year 2004(Based on 10 full and 12 partial tracts) A) FHA, FSA/RHS & VA B) Conventional C) Refinancings D) Home Improvement Loans E) Loans on Dwellings For 5+ Families F) Non-occupant Loans on G) Loans On Manufactured Number Average Value Number Average Value Number Average Value Number Average Value Number Average Value Number Average Value Number Average Value
LOANS ORIGINATED 35 $69,563 160 $79,923 168 $74,002 33 $32,687 8 $812,970 115 $54,191 2 $21,930 APPLICATIONS APPROVED, NOT ACCEPTED 3 $113,803 61 $85,130 37 $62,314 8 $50,556 0 $0 33 $74,435 1 $30,140 APPLICATIONS DENIED 8 $64,147 77 $101,857 307 $55,611 93 $22,057 0 $0 78 $70,768 1 $50,470 APPLICATIONS WITHDRAWN 8 $67,741 52 $83,517 114 $62,461 13 $42,172 0 $0 31 $64,919 1 $97,000 FILES CLOSED FOR INCOMPLETENESS 1 $150,000 15 $138,126 25 $90,050 1 $7,000 0 $0 9 $149,362 0 $0
Aggregated Statistics For Year 2003(Based on 10 full and 12 partial tracts) A) FHA, FSA/RHS & VA B) Conventional C) Refinancings D) Home Improvement Loans E) Loans on Dwellings For 5+ Families F) Non-occupant Loans on Number Average Value Number Average Value Number Average Value Number Average Value Number Average Value Number Average Value
LOANS ORIGINATED 56 $76,743 139 $74,016 175 $79,955 26 $28,574 1 $1,048,920 75 $60,699 APPLICATIONS APPROVED, NOT ACCEPTED 1 $31,000 35 $66,192 39 $59,492 3 $15,360 0 $0 23 $65,542 APPLICATIONS DENIED 8 $59,466 75 $56,445 300 $45,990 79 $15,694 2 $682,975 82 $40,676 APPLICATIONS WITHDRAWN 8 $83,215 25 $72,408 108 $52,736 0 $0 2 $682,975 20 $47,284 FILES CLOSED FOR INCOMPLETENESS 3 $67,253 9 $60,701 7 $63,214 0 $0 0 $0 1 $80,820
Aggregated Statistics For Year 2002(Based on 10 full and 10 partial tracts) A) FHA, FSA/RHS & VA B) Conventional C) Refinancings D) Home Improvement Loans E) Loans on Dwellings For 5+ Families F) Non-occupant Loans on Number Average Value Number Average Value Number Average Value Number Average Value Number Average Value Number Average Value
LOANS ORIGINATED 45 $64,395 91 $85,145 124 $72,371 28 $21,883 1 $1,782,540 49 $45,572 APPLICATIONS APPROVED, NOT ACCEPTED 5 $43,530 24 $73,185 21 $115,188 10 $16,407 0 $0 4 $41,158 APPLICATIONS DENIED 5 $67,576 67 $45,259 143 $46,222 76 $12,222 0 $0 37 $43,821 APPLICATIONS WITHDRAWN 2 $64,000 12 $71,077 57 $67,740 6 $23,433 0 $0 4 $34,188 FILES CLOSED FOR INCOMPLETENESS 0 $0 11 $87,795 12 $69,562 0 $0 1 $2,318,800 0 $0
Aggregated Statistics For Year 2001(Based on 10 full and 10 partial tracts) A) FHA, FSA/RHS & VA B) Conventional C) Refinancings D) Home Improvement Loans E) Loans on Dwellings For 5+ Families F) Non-occupant Loans on Number Average Value Number Average Value Number Average Value Number Average Value Number Average Value Number Average Value
LOANS ORIGINATED 29 $65,120 102 $69,337 91 $76,060 36 $17,272 3 $652,407 22 $50,965 APPLICATIONS APPROVED, NOT ACCEPTED 2 $39,610 15 $39,427 25 $47,334 10 $17,237 0 $0 6 $50,160 APPLICATIONS DENIED 7 $45,971 77 $46,228 102 $37,525 70 $13,991 0 $0 29 $34,833 APPLICATIONS WITHDRAWN 9 $61,840 16 $86,694 50 $165,745 14 $17,666 0 $0 2 $44,000 FILES CLOSED FOR INCOMPLETENESS 0 $0 11 $57,522 11 $44,600 1 $42,600 0 $0 0 $0
Aggregated Statistics For Year 2000(Based on 10 full and 10 partial tracts) A) FHA, FSA/RHS & VA B) Conventional C) Refinancings D) Home Improvement Loans E) Loans on Dwellings For 5+ Families F) Non-occupant Loans on Number Average Value Number Average Value Number Average Value Number Average Value Number Average Value Number Average Value
LOANS ORIGINATED 30 $59,650 91 $63,908 44 $42,222 28 $22,626 3 $975,690 29 $40,223 APPLICATIONS APPROVED, NOT ACCEPTED 3 $79,790 19 $52,909 19 $82,008 20 $16,772 0 $0 9 $32,397 APPLICATIONS DENIED 6 $44,998 95 $42,564 54 $49,341 76 $13,740 0 $0 25 $31,806 APPLICATIONS WITHDRAWN 5 $62,450 20 $65,343 31 $39,935 2 $7,450 0 $0 7 $46,506 FILES CLOSED FOR INCOMPLETENESS 3 $59,583 9 $53,267 21 $39,946 0 $0 0 $0 11 $39,245
Aggregated Statistics For Year 1999(Based on 8 full and 6 partial tracts) A) FHA, FSA/RHS & VA B) Conventional C) Refinancings D) Home Improvement Loans E) Loans on Dwellings For 5+ Families F) Non-occupant Loans on Number Average Value Number Average Value Number Average Value Number Average Value Number Average Value Number Average Value
LOANS ORIGINATED 27 $50,576 66 $48,413 50 $43,090 22 $17,074 0 $0 29 $29,636 APPLICATIONS APPROVED, NOT ACCEPTED 0 $0 17 $36,322 19 $34,931 16 $15,749 0 $0 5 $29,938 APPLICATIONS DENIED 2 $37,115 113 $41,869 45 $32,679 53 $10,820 0 $0 14 $37,011 APPLICATIONS WITHDRAWN 2 $52,920 13 $36,634 26 $42,915 4 $25,508 1 $3,200,000 3 $28,877 FILES CLOSED FOR INCOMPLETENESS 0 $0 6 $81,732 16 $46,271 0 $0 0 $0 2 $34,645
Private Mortgage Insurance Companies Aggregated Statistics For Year 2009(Based on 7 full and 6 partial tracts) A) Conventional B) Refinancings C) Non-occupant Loans on Number Average Value Number Average Value Number Average Value
LOANS ORIGINATED 14 $204,529 5 $195,520 2 $40,870 APPLICATIONS APPROVED, NOT ACCEPTED 6 $136,045 2 $226,690 4 $121,055 APPLICATIONS DENIED 2 $266,000 0 $0 0 $0 APPLICATIONS WITHDRAWN 0 $0 0 $0 0 $0 FILES CLOSED FOR INCOMPLETENESS 1 $81,000 0 $0 1 $81,000
Aggregated Statistics For Year 2008(Based on 7 full and 10 partial tracts) A) Conventional B) Refinancings C) Non-occupant Loans on Number Average Value Number Average Value Number Average Value
LOANS ORIGINATED 25 $122,122 6 $115,000 11 $73,975 APPLICATIONS APPROVED, NOT ACCEPTED 17 $100,119 0 $0 5 $87,792 APPLICATIONS DENIED 2 $68,035 0 $0 0 $0 APPLICATIONS WITHDRAWN 1 $272,000 0 $0 0 $0 FILES CLOSED FOR INCOMPLETENESS 1 $90,170 0 $0 1 $90,170
Aggregated Statistics For Year 2007(Based on 7 full and 10 partial tracts) A) Conventional B) Refinancings C) Non-occupant Loans on Number Average Value Number Average Value Number Average Value
LOANS ORIGINATED 36 $88,108 3 $171,773 6 $61,527 APPLICATIONS APPROVED, NOT ACCEPTED 6 $114,407 0 $0 0 $0 APPLICATIONS DENIED 1 $98,690 0 $0 0 $0 APPLICATIONS WITHDRAWN 8 $96,635 0 $0 0 $0 FILES CLOSED FOR INCOMPLETENESS 0 $0 0 $0 0 $0
Aggregated Statistics For Year 2006(Based on 7 full and 12 partial tracts) A) Conventional B) Refinancings C) Non-occupant Loans on Number Average Value Number Average Value Number Average Value
LOANS ORIGINATED 26 $85,831 6 $60,737 12 $53,495 APPLICATIONS APPROVED, NOT ACCEPTED 4 $101,500 2 $61,895 0 $0 APPLICATIONS DENIED 0 $0 1 $184,670 1 $184,670 APPLICATIONS WITHDRAWN 3 $53,747 2 $85,835 4 $70,298 FILES CLOSED FOR INCOMPLETENESS 1 $577,080 0 $0 0 $0
Aggregated Statistics For Year 2005(Based on 7 full and 12 partial tracts) A) Conventional B) Refinancings C) Non-occupant Loans on Number Average Value Number Average Value Number Average Value
LOANS ORIGINATED 35 $83,302 4 $61,805 16 $46,668 APPLICATIONS APPROVED, NOT ACCEPTED 6 $109,418 1 $38,190 4 $29,985 APPLICATIONS DENIED 0 $0 0 $0 0 $0 APPLICATIONS WITHDRAWN 2 $150,385 1 $192,500 1 $155,000 FILES CLOSED FOR INCOMPLETENESS 0 $0 0 $0 0 $0
Aggregated Statistics For Year 2004(Based on 7 full and 12 partial tracts) A) Conventional B) Refinancings C) Non-occupant Loans on Number Average Value Number Average Value Number Average Value
LOANS ORIGINATED 35 $97,399 8 $106,446 16 $71,958 APPLICATIONS APPROVED, NOT ACCEPTED 18 $91,384 1 $39,560 6 $54,833 APPLICATIONS DENIED 4 $157,808 0 $0 2 $57,430 APPLICATIONS WITHDRAWN 2 $104,790 0 $0 0 $0 FILES CLOSED FOR INCOMPLETENESS 2 $128,315 2 $43,875 3 $79,917
Aggregated Statistics For Year 2003(Based on 10 full and 10 partial tracts) A) Conventional B) Refinancings C) Non-occupant Loans on Number Average Value Number Average Value Number Average Value
LOANS ORIGINATED 44 $85,682 5 $136,618 8 $46,644 APPLICATIONS APPROVED, NOT ACCEPTED 7 $76,137 0 $0 1 $90,510 APPLICATIONS DENIED 4 $53,888 0 $0 4 $53,888 APPLICATIONS WITHDRAWN 4 $72,005 0 $0 1 $36,000 FILES CLOSED FOR INCOMPLETENESS 0 $0 0 $0 0 $0
Aggregated Statistics For Year 2002(Based on 9 full and 10 partial tracts) A) Conventional B) Refinancings C) Non-occupant Loans on Number Average Value Number Average Value Number Average Value
LOANS ORIGINATED 31 $87,065 11 $70,683 6 $48,578 APPLICATIONS APPROVED, NOT ACCEPTED 10 $95,181 4 $84,625 1 $143,320 APPLICATIONS DENIED 4 $165,908 0 $0 4 $160,412 APPLICATIONS WITHDRAWN 1 $109,470 0 $0 0 $0 FILES CLOSED FOR INCOMPLETENESS 0 $0 0 $0 0 $0
Aggregated Statistics For Year 2001(Based on 9 full and 8 partial tracts) A) Conventional B) Refinancings C) Non-occupant Loans on Number Average Value Number Average Value Number Average Value
LOANS ORIGINATED 31 $87,541 4 $97,605 6 $52,877 APPLICATIONS APPROVED, NOT ACCEPTED 5 $88,564 2 $103,900 1 $105,000 APPLICATIONS DENIED 2 $92,955 0 $0 1 $86,000 APPLICATIONS WITHDRAWN 0 $0 0 $0 0 $0 FILES CLOSED FOR INCOMPLETENESS 0 $0 0 $0 0 $0
Aggregated Statistics For Year 2000(Based on 7 full and 6 partial tracts) A) Conventional B) Refinancings C) Non-occupant Loans on Number Average Value Number Average Value Number Average Value
LOANS ORIGINATED 27 $86,672 9 $43,307 8 $54,759 APPLICATIONS APPROVED, NOT ACCEPTED 2 $115,330 3 $178,660 0 $0 APPLICATIONS DENIED 3 $77,690 0 $0 0 $0 APPLICATIONS WITHDRAWN 2 $56,585 0 $0 0 $0 FILES CLOSED FOR INCOMPLETENESS 0 $0 0 $0 0 $0
Aggregated Statistics For Year 1999(Based on 2 full and 5 partial tracts) A) Conventional B) Refinancings C) Non-occupant Loans on Number Average Value Number Average Value Number Average Value
LOANS ORIGINATED 9 $90,732 1 $74,910 2 $43,095 APPLICATIONS APPROVED, NOT ACCEPTED 1 $108,440 0 $0 0 $0 APPLICATIONS DENIED 0 $0 0 $0 0 $0 APPLICATIONS WITHDRAWN 0 $0 0 $0 0 $0 FILES CLOSED FOR INCOMPLETENESS 1 $11,600 0 $0 0 $0
2002 - 2016 National Fire Incident Reporting System (NFIRS) incidents See full 2006 National Fire Incident Reporting System statistics for zip code 76104, Texas
Most common first names in zip code 76104 among deceased individuals Name Count Lived (average)
James 267 67.2 years John 238 71.2 years Mary 231 78.0 years Willie 208 73.4 years William 185 73.9 years Robert 174 66.5 years Charles 123 67.3 years George 117 72.2 years Annie 89 78.3 years Jessie 77 73.7 years
Most common last names in zip code 76104 among deceased individuals Last name Count Lived (average)
Williams 234 71.4 years Johnson 210 71.6 years Smith 188 70.4 years Jones 169 73.2 years Brown 123 71.1 years Jackson 117 74.2 years Davis 114 71.0 years Thomas 89 75.7 years Miller 74 69.5 years Harris 73 72.1 years
Businesses in zip code 76104
Name Count Name Count
7-Eleven 1 Starbucks 3 Church's Chicken 1 Subway 2 FedEx 2 U-Haul 2 Jones New York 1 UPS 1 McDonald's 1 Walgreens 1 New Balance 1
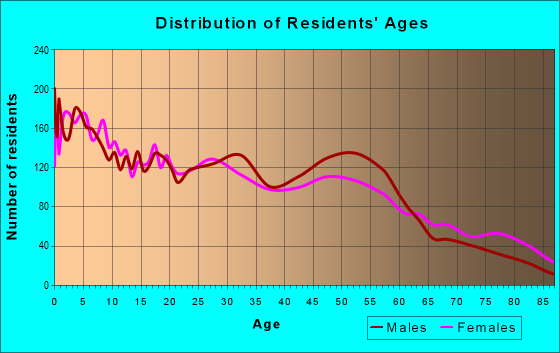
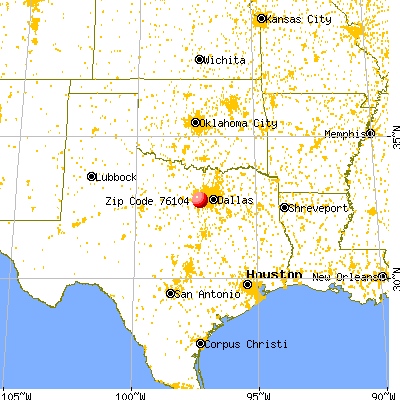


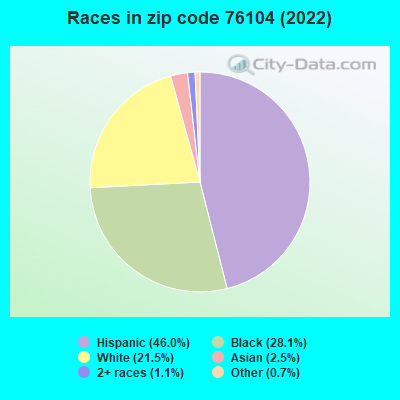


 Nearest zip codes: 76110, 76102, 76105, 76103, 76129, 76115.
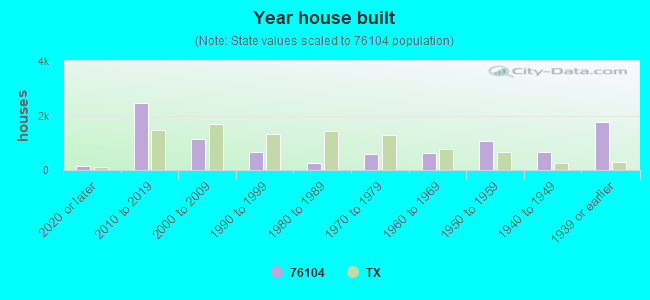
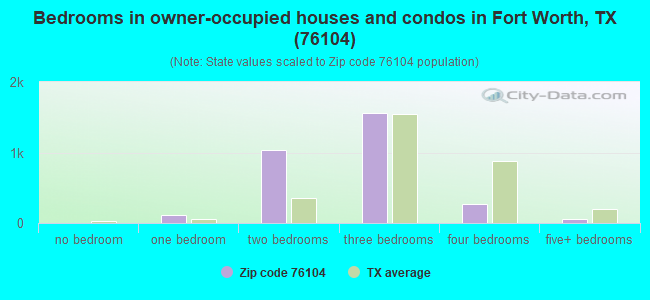
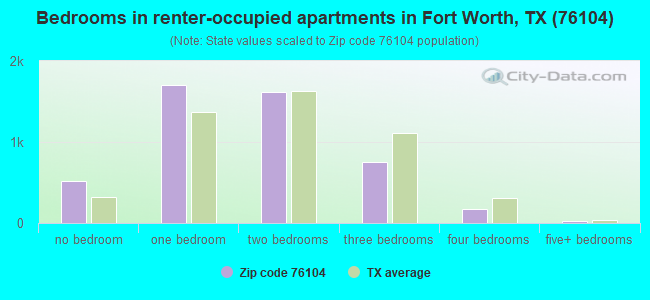
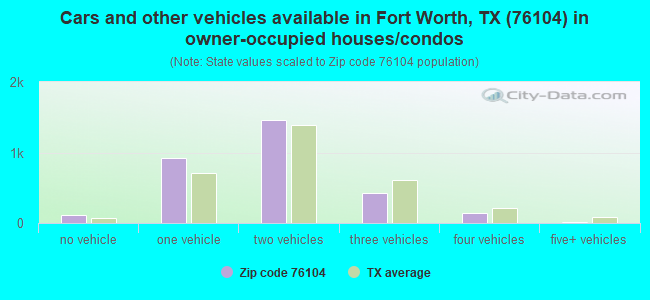
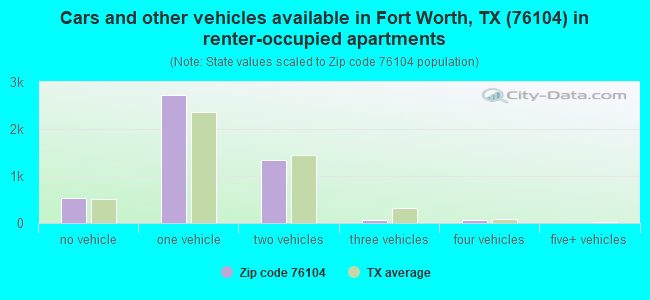


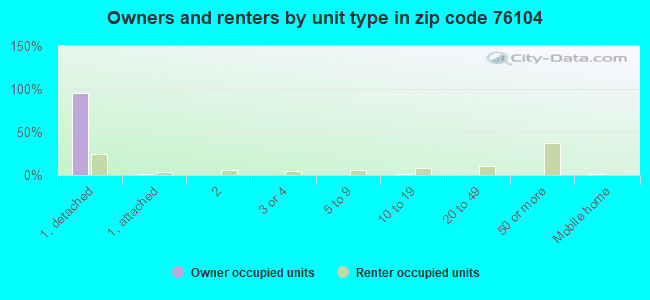
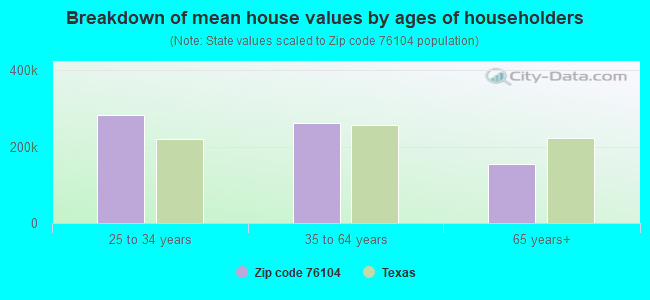


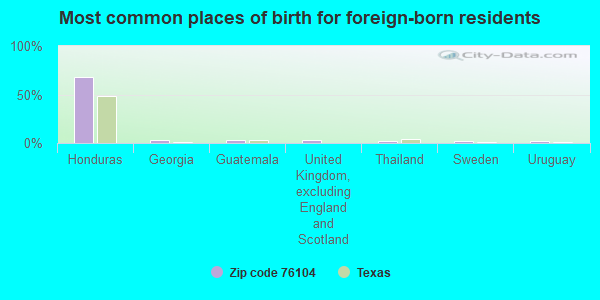
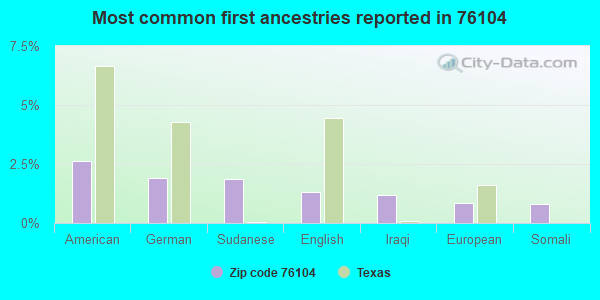
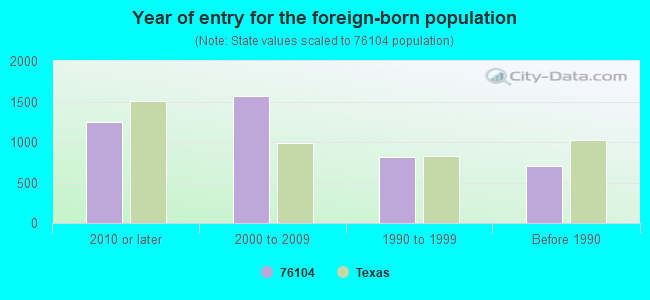


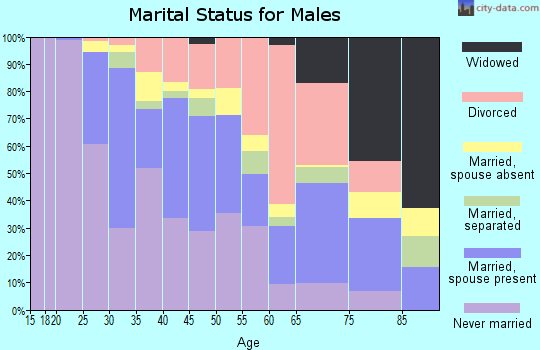

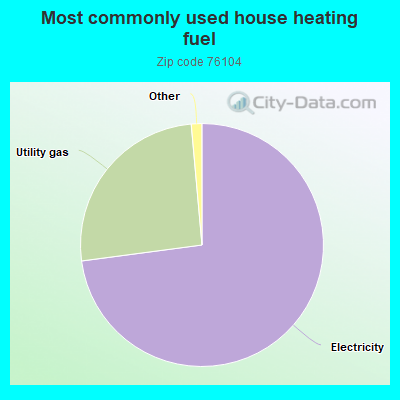
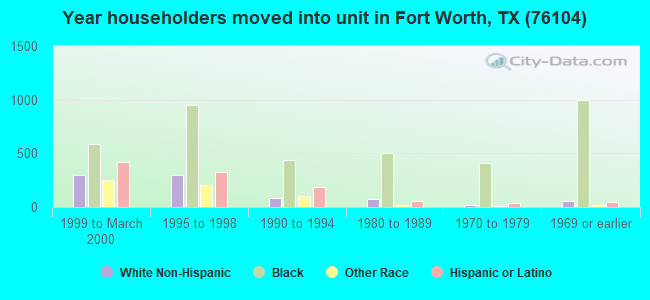
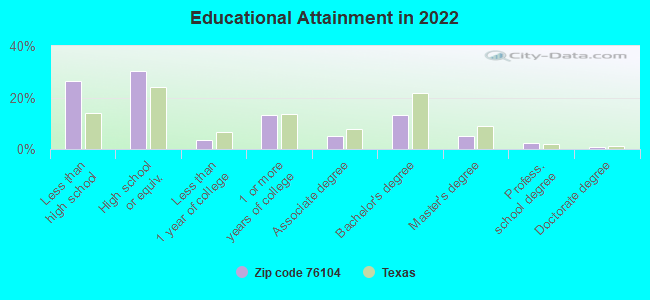
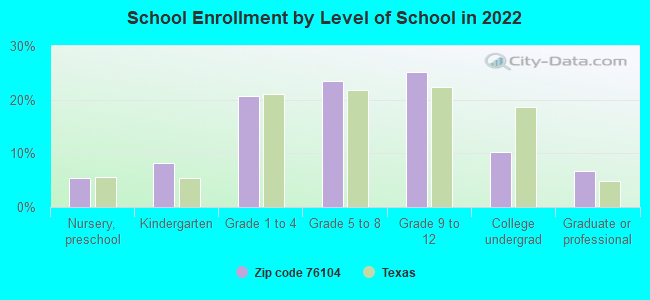
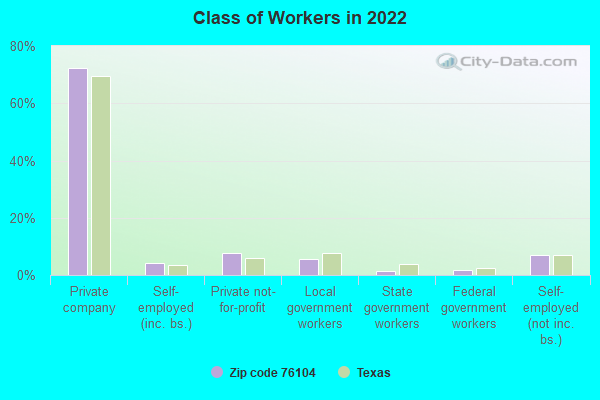
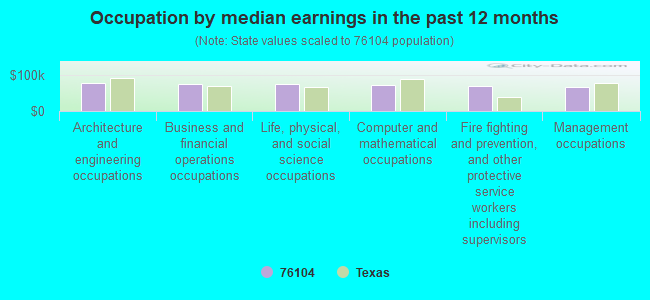
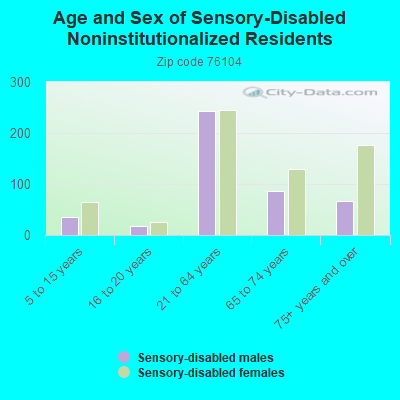
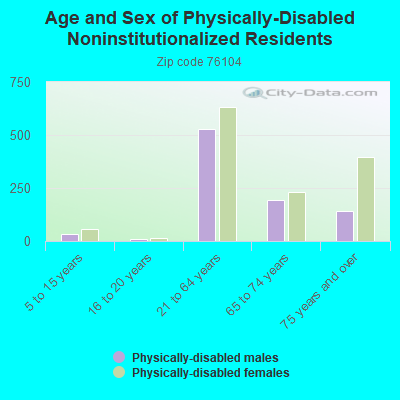
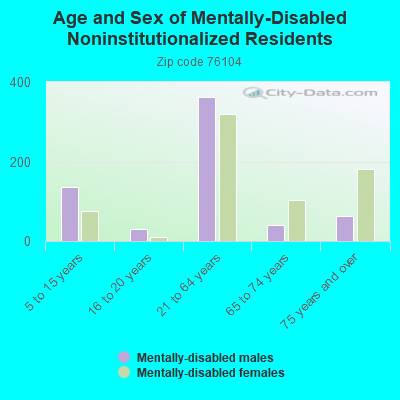
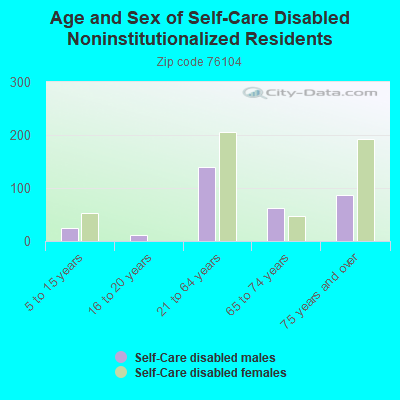
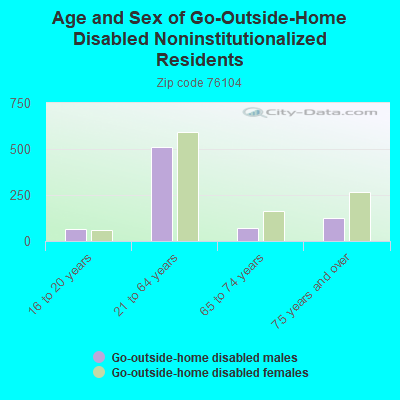
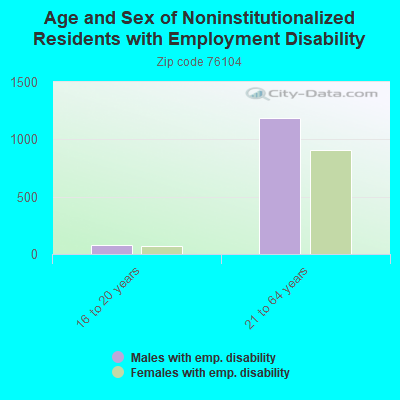
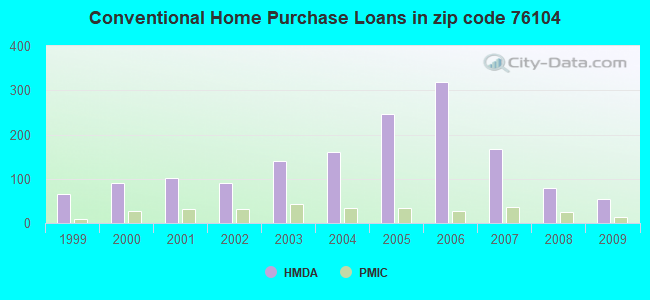
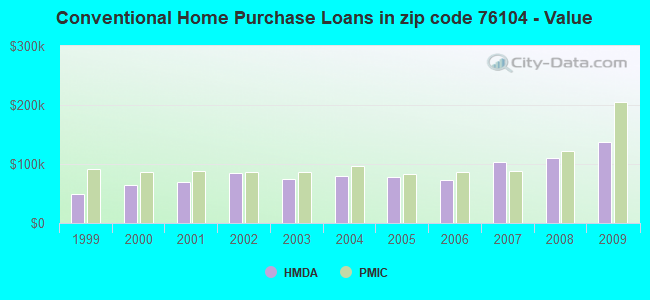
 According to the data from the years 2002 - 2016 the average number of fires per year is 181. The highest number of fires - 256 took place in 2005, and the least - 127 in 2016. The data has a decreasing trend.
 When looking into fire subcategories, the most incidents belonged to: Outside Fires (46.5%), and Structure Fires (29.5%).