Estimated zip code population in 2022: 34,544 Zip code population in 2010: 30,434 Zip code population in 2000: 32,742
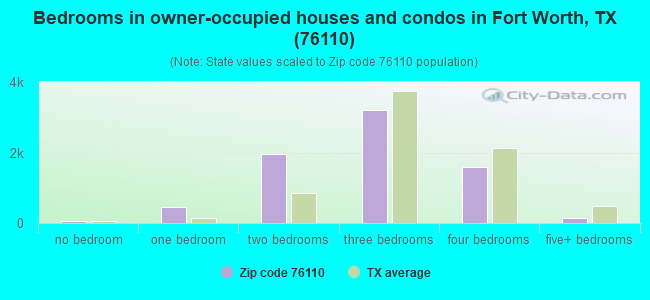
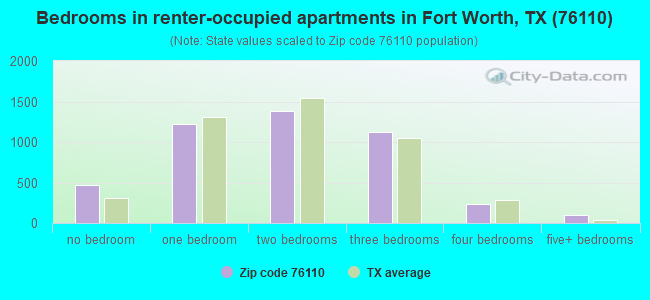
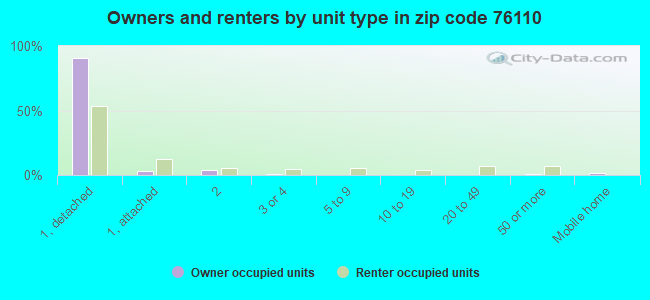
Houses and condos: 13,246 Renter-occupied apartments: 4,505
% of renters here:
38%
State:
38%
March 2022 cost of living index in zip code 76110: 95.6 (near average, U.S. average is 100)
Land area: 5.7 sq. mi. Water area: 0.0 sq. mi.
Population density: 6,023 people per square mile
(high).
OSM Map
General Map
Google Map
MSN Map
OSM Map
General Map
Google Map
MSN Map
OSM Map
General Map
Google Map
MSN Map
OSM Map
General Map
Google Map
MSN Map
Please wait while loading the map...
Real estate property taxes paid for housing units in 2022:
This zip code:
1.2% ($3,061)
Texas:
1.5% ($4,050)
Median real estate property taxes paid for housing units with mortgages in 2022: $6,513 (1.6%) Median real estate property taxes paid for housing units with no mortgage in 2022: $2,005 (1.3%)
Averages for the 2020 tax year for zip code 76110, filed in 2021:
Average Adjusted Gross Income (AGI) in 2020: $64,841 (Individual Income Tax Returns)
Here:
$64,841
State:
$77,054
Salary/wage: $55,374 (reported on 85.0% of returns)
Here:
$55,374
State:
$62,766
(% of AGI for various income ranges: 1286.1% for AGIs below $25k, 3797.8% for AGIs $25k-50k, 6841.8% for AGIs $50k-75k, 9765.4% for AGIs $75k-100k, 18459.5% for AGIs $100k-200k, 89512.7% for AGIs over 200k)
Taxable interest for individuals: $2,273 (reported on 17.6% of returns)
This zip code:
$2,273
Texas:
$2,665
(% of AGI for various income ranges: 4.2% for AGIs below $25k, 7.0% for AGIs $25k-50k, 18.9% for AGIs $50k-75k, 47.5% for AGIs $75k-100k, 145.0% for AGIs $100k-200k, 1623.2% for AGIs over 200k)
Ordinary dividends: $7,905 (reported on 11.7% of returns)
Here:
$7,905
State:
$10,044
(% of AGI for various income ranges: 11.0% for AGIs below $25k, 11.8% for AGIs $25k-50k, 45.7% for AGIs $50k-75k, 152.5% for AGIs $75k-100k, 440.3% for AGIs $100k-200k, 3393.6% for AGIs over 200k)
Net capital gain/loss in AGI: +$19,250 (reported on 11.3% of returns)
Here:
+$19,250
State:
+$39,590
(% of AGI for various income ranges: 6.3% for AGIs below $25k, 10.0% for AGIs $25k-50k, 56.3% for AGIs $50k-75k, 102.6% for AGIs $75k-100k, 582.8% for AGIs $100k-200k, 10747.7% for AGIs over 200k)
Profit/loss from business: +$12,670 (reported on 22.0% of returns)
Here:
+$12,670
State:
+$10,888
(% of AGI for various income ranges: 220.1% for AGIs below $25k, 176.4% for AGIs $25k-50k, 211.0% for AGIs $50k-75k, 321.6% for AGIs $75k-100k, 956.3% for AGIs $100k-200k, 5687.7% for AGIs over 200k)
Taxable individual retirement arrangement distribution: $22,275 (reported on 4.4% of returns)
76110:
$22,275
Texas:
$24,740
(% of AGI for various income ranges: 16.8% for AGIs below $25k, 30.1% for AGIs $25k-50k, 108.2% for AGIs $50k-75k, 338.8% for AGIs $75k-100k, 820.3% for AGIs $100k-200k, 1443.6% for AGIs over 200k)
Self-employed (Keogh) retirement plans: $25,214 (reported on 0.5% of returns)
76110:
$25,214
Texas:
$29,298
(% of AGI for various income ranges: 65.3% for AGIs $100k-200k, 624.1% for AGIs over 200k)
Total itemized deductions: $35,247 (reported on 6.5% of returns)
Here:
$35,247
State:
$40,428
(% of AGI for various income ranges: 19.4% for AGIs below $25k, 66.2% for AGIs $25k-50k, 155.3% for AGIs $50k-75k, 510.5% for AGIs $75k-100k, 1230.3% for AGIs $100k-200k, 6976.4% for AGIs over 200k)
Charity contributions: $14,546 (reported on 5.2% of returns)
Here:
$14,546
State:
$18,201
(% of AGI for various income ranges: 18.1% for AGIs $25k-50k, 36.2% for AGIs $50k-75k, 79.6% for AGIs $75k-100k, 287.7% for AGIs $100k-200k, 3144.5% for AGIs over 200k)
Taxes paid: $8,181 (reported on 6.3% of returns)
76110:
$8,181
State:
$7,821
(% of AGI for various income ranges: 4.3% for AGIs below $25k, 13.5% for AGIs $25k-50k, 38.3% for AGIs $50k-75k, 124.7% for AGIs $75k-100k, 345.3% for AGIs $100k-200k, 1382.7% for AGIs over 200k)
Earned income credit: $2,614 (reported on 23.3% of returns)
Here:
$2,614
State:
$2,584
(% of AGI for various income ranges: 139.2% for AGIs below $25k, 84.0% for AGIs $25k-50k, 1.3% for AGIs $50k-75k)
Percentage of individuals using paid preparers for their 2020 taxes: 91.4%
Here:
91%
State:
92%
(% for various income ranges: 89.8% for AGIs below $25k, 92.7% for AGIs $25k-50k, 91.7% for AGIs $50k-75k, 91.2% for AGIs $75k-100k, 92.4% for AGIs $100k-200k, 93.7% for AGIs over 200k)
Averages for the 2012 tax year for zip code 76110, filed in 2013:
Average Adjusted Gross Income (AGI) in 2012: $46,785 (Individual Income Tax Returns)
Here:
$46,785
State:
$65,384
Salary/wage: $41,374 (reported on 87.6% of returns)
Here:
$41,374
State:
$52,524
(% of AGI for various income ranges: 82.0% for AGIs below $25k, 90.3% for AGIs $25k-50k, 86.3% for AGIs $50k-75k, 81.9% for AGIs $75k-100k, 76.7% for AGIs $100k-200k, 60.1% for AGIs over 200k)
Taxable interest for individuals: $1,470 (reported on 16.7% of returns)
This zip code:
$1,470
Texas:
$2,372
(% of AGI for various income ranges: 0.3% for AGIs below $25k, 0.2% for AGIs $25k-50k, 0.3% for AGIs $50k-75k, 0.6% for AGIs $75k-100k, 0.6% for AGIs $100k-200k, 0.9% for AGIs over 200k)
Ordinary dividends: $6,247 (reported on 10.1% of returns)
Here:
$6,247
State:
$9,721
(% of AGI for various income ranges: 0.6% for AGIs below $25k, 0.3% for AGIs $25k-50k, 0.6% for AGIs $50k-75k, 1.2% for AGIs $75k-100k, 1.7% for AGIs $100k-200k, 2.7% for AGIs over 200k)
Net capital gain/loss in AGI: +$12,921 (reported on 8.4% of returns)
Here:
+$12,921
State:
+$35,319
(% of AGI for various income ranges: 0.1% for AGIs below $25k, 0.2% for AGIs $25k-50k, 0.4% for AGIs $50k-75k, 0.3% for AGIs $75k-100k, 1.4% for AGIs $100k-200k, 7.1% for AGIs over 200k)
Profit/loss from business: +$12,836 (reported on 19.9% of returns)
Here:
+$12,836
State:
+$13,732
(% of AGI for various income ranges: 12.6% for AGIs below $25k, 3.8% for AGIs $25k-50k, 3.4% for AGIs $50k-75k, 4.3% for AGIs $75k-100k, 5.0% for AGIs $100k-200k, 4.7% for AGIs over 200k)
Taxable individual retirement arrangement distribution: $16,854 (reported on 4.2% of returns)
76110:
$16,854
Texas:
$19,511
(% of AGI for various income ranges: 0.8% for AGIs below $25k, 0.9% for AGIs $25k-50k, 1.6% for AGIs $50k-75k, 1.6% for AGIs $75k-100k, 2.9% for AGIs $100k-200k, 1.5% for AGIs over 200k)
Self-employment retirement plans: $18,925 (reported on 0.6% of returns)
76110:
$18,925
Texas:
$23,938
(% of AGI for various income ranges: 0.2% for AGIs $25k-50k, 0.4% for AGIs $100k-200k, 0.6% for AGIs over 200k)
Total itemized deductions: $23,114 (16% of AGI, reported on 15.6% of returns)
Here:
$23,114
State:
$24,724
Here:
16.3% of AGI
State:
15.9% of AGI
(% of AGI for various income ranges: 3.4% for AGIs below $25k, 4.7% for AGIs $25k-50k, 8.1% for AGIs $50k-75k, 10.6% for AGIs $75k-100k, 12.6% for AGIs $100k-200k, 8.5% for AGIs over 200k)
Charity contributions: $5,777 (reported on 12.5% of returns)
Here:
$5,777
State:
$6,808
(% of AGI for various income ranges: 0.2% for AGIs below $25k, 0.5% for AGIs $25k-50k, 1.2% for AGIs $50k-75k, 1.7% for AGIs $75k-100k, 2.5% for AGIs $100k-200k, 2.6% for AGIs over 200k)
Taxes paid: $7,399 (reported on 15.1% of returns)
76110:
$7,399
State:
$6,921
(% of AGI for various income ranges: 0.6% for AGIs below $25k, 0.9% for AGIs $25k-50k, 2.1% for AGIs $50k-75k, 3.7% for AGIs $75k-100k, 4.6% for AGIs $100k-200k, 2.9% for AGIs over 200k)
Earned income credit: $2,648 (reported on 30.3% of returns)
Here:
$2,648
State:
$2,570
(% of AGI for various income ranges: 9.5% for AGIs below $25k, 1.7% for AGIs $25k-50k)
Percentage of individuals using paid preparers for their 2012 taxes: 60.3%
Here:
60%
State:
51%
(% for various income ranges: 61.3% for AGIs below $25k, 61.4% for AGIs $25k-50k, 55.3% for AGIs $50k-75k, 50.9% for AGIs $75k-100k, 54.3% for AGIs $100k-200k, 75.0% for AGIs over 200k)
Averages for the 2004 tax year for zip code 76110, filed in 2005:
Average Adjusted Gross Income (AGI) in 2004: $34,484 (Individual Income Tax Returns)
Here:
$34,484
State:
$47,881
Salary/wage: $32,172 (reported on 89.1% of returns)
Here:
$32,172
State:
$41,947
(% of AGI for various income ranges: 122.4% for AGIs below $10k, 88.2% for AGIs $10k-25k, 90.5% for AGIs $25k-50k, 85.2% for AGIs $50k-75k, 80.3% for AGIs $75k-100k, 71.1% for AGIs over 100k)
Taxable interest for individuals: $1,725 (reported on 21.6% of returns)
This zip code:
$1,725
Texas:
$2,255
(% of AGI for various income ranges: 3.3% for AGIs below $10k, 0.6% for AGIs $10k-25k, 0.5% for AGIs $25k-50k, 1.0% for AGIs $50k-75k, 1.2% for AGIs $75k-100k, 1.7% for AGIs over 100k)
Taxable dividends: $3,436 (reported on 11.2% of returns)
Here:
$3,436
State:
$4,261
(% of AGI for various income ranges: 2.0% for AGIs below $10k, 0.3% for AGIs $10k-25k, 0.3% for AGIs $25k-50k, 0.8% for AGIs $50k-75k, 1.1% for AGIs $75k-100k, 2.3% for AGIs over 100k)
Net capital gain/loss: +$8,070 (reported on 9.0% of returns)
Here:
+$8,070
State:
+$16,110
(% of AGI for various income ranges: -1.6% for AGIs below $10k, 0.0% for AGIs $10k-25k, 0.3% for AGIs $25k-50k, 0.7% for AGIs $50k-75k, 1.1% for AGIs $75k-100k, 5.9% for AGIs over 100k)
Profit/loss from business: +$11,298 (reported on 14.7% of returns)
Here:
+$11,298
State:
+$11,013
(% of AGI for various income ranges: 8.9% for AGIs below $10k, 6.0% for AGIs $10k-25k, 2.8% for AGIs $25k-50k, 4.0% for AGIs $50k-75k, 3.6% for AGIs $75k-100k, 6.1% for AGIs over 100k)
IRA payment deduction: $2,667 (reported on 1.2% of returns)
76110:
$2,667
Texas:
$3,120
(% of AGI for various income ranges: 0.1% for AGIs $10k-25k, 0.1% for AGIs $25k-50k, 0.1% for AGIs $50k-75k, 0.2% for AGIs $75k-100k, 0.1% for AGIs over 100k)
Self-employed pension: $12,514 (reported on 0.6% of returns)
Here:
$12,514
Texas:
$16,401
(% of AGI for various income ranges: 0.1% for AGIs $10k-25k, 0.2% for AGIs $50k-75k, 0.6% for AGIs over 100k)
Total itemized deductions: $18,645 (18% of AGI, reported on 13.3% of returns)
Here:
$18,645
State:
$19,631
Here:
18.2% of AGI
State:
18.9% of AGI
(% of AGI for various income ranges: 5.8% for AGIs below $10k, 2.5% for AGIs $10k-25k, 4.6% for AGIs $25k-50k, 8.6% for AGIs $50k-75k, 12.9% for AGIs $75k-100k, 10.3% for AGIs over 100k)
Charity contributions deductions: $4,342 (4% of AGI, reported on 11.3% of returns)
Here:
$4,342
State:
$4,753
Here:
4.0% of AGI
State:
4.2% of AGI
(% of AGI for various income ranges: 0.4% for AGIs below $10k, 0.3% for AGIs $10k-25k, 0.6% for AGIs $25k-50k, 1.2% for AGIs $50k-75k, 2.4% for AGIs $75k-100k, 2.7% for AGIs over 100k)
Total tax: $6,414 (reported on 58.8% of returns)
76110:
$6,414
State:
$9,058
(% of AGI for various income ranges: 3.4% for AGIs below $10k, 3.1% for AGIs $10k-25k, 5.4% for AGIs $25k-50k, 9.3% for AGIs $50k-75k, 12.1% for AGIs $75k-100k, 21.0% for AGIs over 100k)
Earned income credit: $2,066 (reported on 31.2% of returns)
Here:
$2,066
State:
$2,024
Percentage of individuals using paid preparers for their 2004 taxes: 62.5%
Here:
62%
State:
57%
(% for various income ranges: 57.2% for AGIs below $10k, 68.8% for AGIs $10k-25k, 61.2% for AGIs $25k-50k, 53.6% for AGIs $50k-75k, 55.9% for AGIs $75k-100k, 60.4% for AGIs over 100k)
Likely homosexual households (counted as self-reported same-sex unmarried-partner households)
Lesbian couples: 0.1% of all households
Gay men: 0.0% of all households
Household received Food Stamps/SNAP in the past 12 months: 1,340 Household did not receive Food Stamps/SNAP in the past 12 months: 10,572
Women who had a birth in the past 12 months: 514 (276 now married, 234 unmarried) Women who did not have a birth in the past 12 months: 7,993 (3,590 now married, 4,400 unmarried)
Housing units in zip code 76110 with a mortgage: 3,578 (212 second mortgage, 47 home equity loan, 152 both second mortgage and home equity loan) Houses without a mortgage: 111
Median monthly owner costs for units with a mortgage: $2,194 Median monthly owner costs for units without a mortgage: $568
Residents with income below the poverty level in 2022:
This zip code:
19.7%
Whole state:
14.0%
Residents with income below 50% of the poverty level in 2022:
This zip code:
9.2%
Whole state:
7.4%
Median number of rooms in houses and condos:
Here:
5.9
State:
6.3
Median number of rooms in apartments:
Here:
4.4
State:
4.0
Notable locations in this zip code not listed on our city pages
Notable locations in zip code 76110: Fairmount-Southside Historic District (A), Elizabeth Boulevard Historic District (B), Johnson-Elliott House (C), M A Benton House (D), Fort Worth Fire Department Station 10 (E), Rogers-O'Daniel House (F). Display/hide their locations on the map
Churches in zip code 76110 include: Grace Fellowship Church (A), Community Fellowship Church (B), Liberty Missionary Baptist Church (C), Macedonia Missionary Baptist Church (D), Richmond Avenue Baptist Church (E), Travis Avenue Baptist Church (F), South Fort Worth Baptist Church (G), Christian Science Church (H), San Juan Apostle Church (I). Display/hide their locations on the map
Tourist attractions (not listed on the city page) : Fort Worth Zoo (Cultural Attractions- Events- & Facilities; 1989 Colonial Parkway), Fort Worth City - Parks & Community Services Department- Zoo- Informa (Cultural Attractions- Events- & Facilities; 1989 Colonial Parkway), Aerostat Ascensions (Po Box 11725).
5,228 married couples with children.
2,455 single-parent households (510 men, 1,945 women).
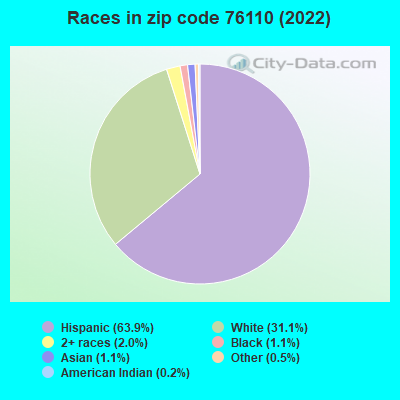
45.3% of residents of 76110 zip code speak English at home.
52.2% of residents speak Spanish at home (55% very well, 15% well, 18% not well, 12% not at all).
0.4% of residents speak other Indo-European language at home (87% very well, 13% well).
0.9% of residents speak Asian or Pacific Island language at home (51% very well, 36% well, 7% not well, 7% not at all).
0.3% of residents speak other language at home (100% very well).
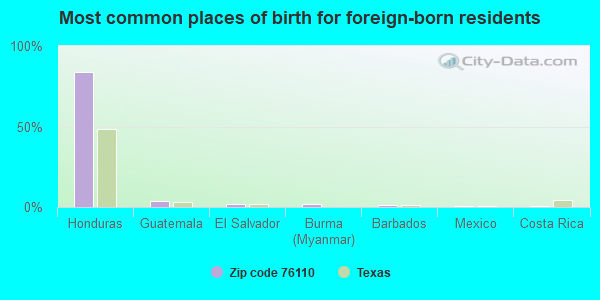
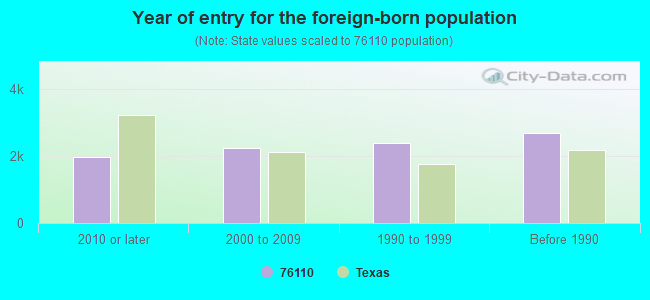
Foreign born population: 8,882 (25.7%) (30.8% of them are naturalized citizens)
Facilities with environmental interests located in this zip code:
A-1 AUTOMATIC TRANSMISSION SVC (3428 SOUTH FWY in FORT WORTH, TX)
(Resource Conservation and Recovery Act (tracking hazardous waste)) Alternative names: A 1 AUTOMATIC TRANSM
AMR PRINTING (3425 S JONES ST in FORT WORTH, TX)
(Resource Conservation and Recovery Act (tracking hazardous waste)) Business NAICS classification: COMMERCIAL GRAVURE PRINTING. Alternative names: THREE D EMBLEM INC
AMR PRINTING (3316 S JONES in FORT WORTH, TX)
(Resource Conservation and Recovery Act (tracking hazardous waste)) Business NAICS classification: BROADWOVEN FABRIC FINISHING MILLS. Organizations: 3D EMBLEM INC (CONTACT/OPERATOR)
B-SQUARE COMPANY (2708 SAINT LOUIS AVE in FORT WORTH, TX)
(Resource Conservation and Recovery Act (tracking hazardous waste)) Business NAICS classification: HAND AND EDGE TOOL MANUFACTURING.
AEROSPACE COMPOSITE TECH (3220 SOUTH GROVE ST in FORT WORTH, TX)
Conditionally Exempt Small Quantity Generators, less than 100 kg/month of hazardous waste (Resource Conservation and Recovery Act (tracking hazardous waste)) - notification Business NAICS classification: DENTAL EQUIPMENT AND SUPPLIES MANUFACTURING. Organizations: GKN WESTLAND AEROSPACE (CONTACT/OPERATOR)
ARROW PLATING CO INC (3129 MAY ST. in FORT WORTH, TX)
Small Quantity Generators, between 100 kg and 1000 kg of hazardous waste/month (Resource Conservation and Recovery Act (tracking hazardous waste)) TRI REPORTER (Tracking of toxic chemicals releasing facilities) Business SIC and NAICS classification: ELECTROPLATING, PLATING, POLISHING, ANODIZING, AND COLORING
ADVANCED METALLURGICAL TECH (212 PAGE ST in FORT WORTH, TX)
Small Quantity Generators, between 100 kg and 1000 kg of hazardous waste/month (Resource Conservation and Recovery Act (tracking hazardous waste)) - notification Organizations: JAMES B SMITH (CONTACT/OWNER)
ADVANTAGEFLEA.COM/KATHLEEN KEESEE (2205 WEATHERBY in FORT WORTH, TX)
ENFORCEMENT/COMPLIANCE ACTIVITY (Integrated Compliance Information System)
Housing units lacking complete plumbing facilities: 1.5% Housing units lacking complete kitchen facilities: 2.3%
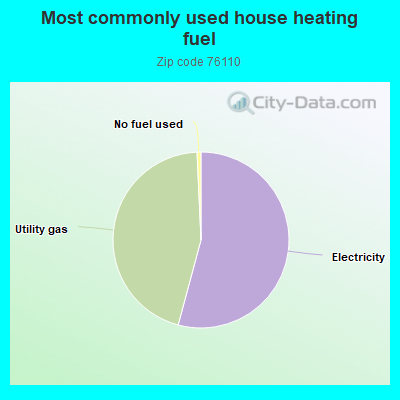
53.7%Electricity
44.7%Utility gas
0.7%No fuel used
Population in 1990: 27,828. Population change in the 1990s: +4,914 (+17.7%).
Place of birth for U.S.-born residents:
This state: 19,651
Northeast: 538
Midwest: 1,412
South: 1,406
West: 1,967
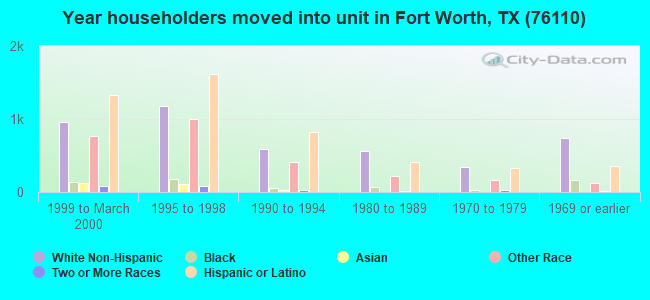
53% of the 76110 zip code residents lived in the same house 5 years ago. Out of people who lived in different houses, 70% lived in this county. Out of people who lived in different counties, 50% lived in Texas.
88% of the 76110 zip code residents lived in the same house 1 year ago. Out of people who lived in different houses, 64% moved from this county. Out of people who lived in different houses, 16% moved from different county within same state. Out of people who lived in different houses, 13% moved from different state. Out of people who lived in different houses, 6% moved from abroad.
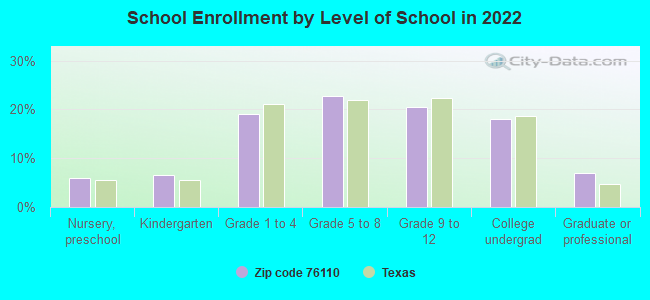
Private vs. public school enrollment:
Students in private schools in grades 1 to 8 (elementary and middle school): 522
Here:
13.3%
Texas:
8.8%
Students in private schools in grades 9 to 12 (high school): 155
Here:
8.1%
Texas:
8.0%
Students in private undergraduate colleges: 775
Here:
46.0%
Texas:
16.2%
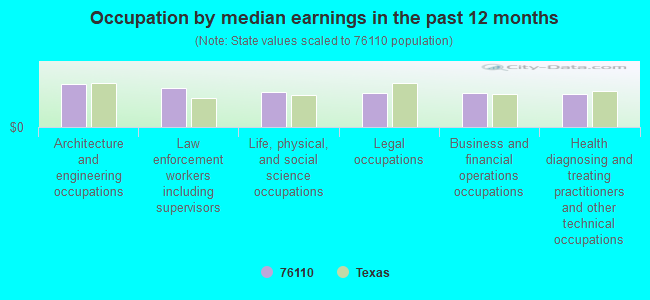
Occupation by median earnings in the past 12 months ($)
117,583Architecture and engineering occupations
105,025Law enforcement workers including supervisors
94,023Life, physical, and social science occupations
92,591Legal occupations
92,059Business and financial operations occupations
88,307Health diagnosing and treating practitioners and other technical occupations
Companies with biggest federal contracts located in this zip code (FORT WORTH, TX):
CENTRAL TRANSPORTATION SYSTEMS (3301 WEST BOLT ST; small business)
$214,687 with Navy for Packing/Crating Services. Signed on 2001-01-01. Completion date: 2001-12-31.
HAYES & STOLZ INDUSTRIAL MANUF (3521 HEMPHILL ST; small business) 50 employees, $0 revenue. : $211,635 in 10 contractsfrom 2004 to 2005
Contracts for Other Professional Services, Plate, Sheet, Strip, Foil; and Leaf, Vehicular Cab, Body, and Frame Structural Components by Army Signed by year:2000: $0; 2001: $0; 2002: $0; 2003: $0; 2004: $174,646; 2005: $36,989; 2006: $0.
Biggest contracts:
$88,931 with Army for Other Professional Services. Signed on 2004-03-17. Completion date: 2004-04-09.
$43,354, same as above.Signed on 2004-10-15. Completion date: 2004-12-13.
$34,598, same as above.Signed on 2004-03-03. Completion date: 2004-05-07.
$31,635 with Army for Plate, Sheet, Strip, Foil; and Leaf. Signed on 2005-04-07. Completion date: 2005-06-07.
GKN AEROSPACE TRANSPARENCY SYS (3220 S GROVE ST; small business) : $74,400 in 7 contractsfrom 2005 to 2006
Contracts for Miscellaneous Aircraft Accessories and Components by Navy Signed by year:2000: $0; 2001: $0; 2002: $0; 2003: $0; 2004: $0; 2005: $29,700; 2006: $44,700.
Biggest contracts:
$14,900 with Navy for Miscellaneous Aircraft Accessories and Components. Signed on 2006-06-09. Completion date: 2006-08-11.
$14,900, same as above.Signed on 2006-03-21. Completion date: 2006-04-25.
$14,900, same as above.Signed on 2006-04-05. Completion date: 2006-05-25.
$10,231, same as above.Signed on 2005-05-26. Completion date: 2005-06-10.
FRESNEL TECHNOLOGIES, INC (101 W MORNINGSIDE DR; small business) : $69,657 in 2 contractsin 2002
$69,857 with Army for Other Research and Development -- Basic Research (R&D). Signed on 2002-12-05. Completion date: 2003-06-06.
-$200, same as above.Signed on 2002-12-18. Completion date: 2003-06-06.
RAYS CHAMPION SPRING & MOTOR S (3336 SOUTH FWY; small business) : $30,119 in 3 contractsfrom 2004 to 2005
$19,846 with Army for Maintenance, Repair and Rebuilding of Equipment -- Vehicular Equipment Components. Signed on 2005-08-30. Completion date: 2005-09-30.
$6,905 with Navy for Trucks and Truck Tractors, Wheeled. Signed on 2004-04-28. Completion date: 2004-05-13.
$3,368, same as above.Signed on 2004-08-20. Completion date: 2004-09-10.
JONES, KERMIT, REV (2612 W DREW STREET; small business)
$18,200 with Navy for Vocational/Technical. Signed on 2004-12-01. Completion date: 2005-09-30.
BOLINGER SUPPLY COMPANY INC (3212 S JONES STREET; small business)
$6,865 with Army for Space and Water Heating Equipment. Signed on 2003-10-27. Completion date: 2003-11-13.
UTLEY, MARSHAL CARPETS INC (2209 8TH AVE; small business)
$6,790 with Air Force for Floor Coverings. Signed on 2005-09-30. Completion date: 2005-10-31.
AAA GLASS & MIRROR CO (2405 BENBROOK BLVD; small business)
$4,470 with Navy for Electron Tubes and Associated Hardware. Signed on 2004-02-10. Completion date: 2004-03-02.
COLLINS, PAUL (2909 HEMPHILL ST; small business) : $4,400 in 4 contractsin 2004
$17,520 with Army for Guard Services. Signed on 2004-02-02. Completion date: 2004-09-30.
$1,280, same as above.Signed on 2004-01-20. Completion date: 2004-09-30.
$0, same as above.Signed on 2004-02-02. Completion date: 2004-09-30.
-$14,400, same as above.Signed on 2004-03-26. Completion date: 2004-09-30.
Top industries in this zip code by the number of employees in 2005:
Arts, Entertainment, and Recreation: Zoos and Botanical Gardens (500-999 employees: 1 establishment)
Other Services (except Public Administration): Religious Organizations (100-249: 1, 20-49: 1, 10-19: 5, 5-9: 5, 1-4: 11)
2002 - 2017 National Fire Incident Reporting System (NFIRS) incidents
According to the data from the years 2002 - 2017 the average number of fires per year is 124. The highest number of fires - 208 took place in 2006, and the least - 10 in 2017. The data has a decreasing trend.
When looking into fire subcategories, the most incidents belonged to: Outside Fires (45.3%), and Structure Fires (29.9%).
Fire incident types reported to NFIRS in Zip Code 76110


 Nearest zip codes: 76129, 76104, 76115, 76109, 76102, 76107.
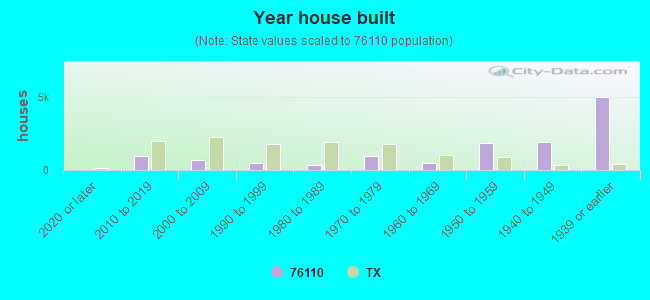


 According to the data from the years 2002 - 2017 the average number of fires per year is 124. The highest number of fires - 208 took place in 2006, and the least - 10 in 2017. The data has a decreasing trend.
 When looking into fire subcategories, the most incidents belonged to: Outside Fires (45.3%), and Structure Fires (29.9%).