Estimated zip code population in 2022: 857 Zip code population in 2010: 937 Zip code population in 2000: 839
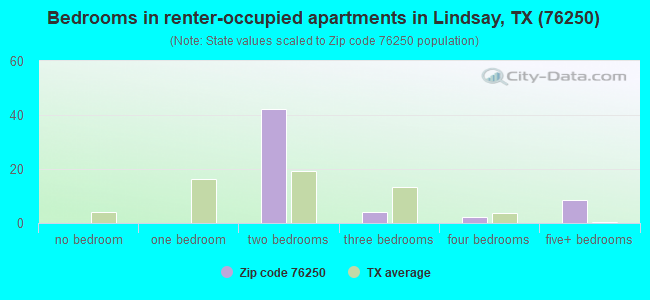
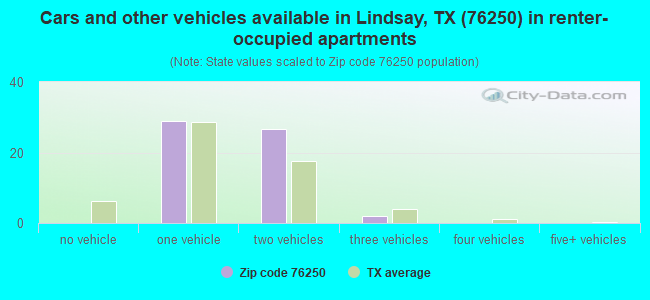
Houses and condos: 367 Renter-occupied apartments: 58
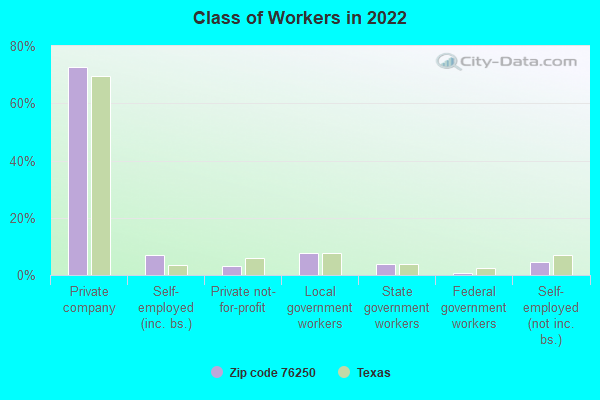
% of renters here:
16%
State:
38%
March 2022 cost of living index in zip code 76250: 80.5 (low, U.S. average is 100)
Land area: 8.8 sq. mi. Water area: 0.0 sq. mi.
Population density: 97 people per square mile
(very low).
OSM Map
General Map
Google Map
MSN Map
OSM Map
General Map
Google Map
MSN Map
OSM Map
General Map
Google Map
MSN Map
OSM Map
General Map
Google Map
MSN Map
Please wait while loading the map...
Real estate property taxes paid for housing units in 2022:
This zip code:
1.4% ($3,880)
Texas:
1.5% ($4,050)
Median real estate property taxes paid for housing units with mortgages in 2022: $4,637 (1.4%) Median real estate property taxes paid for housing units with no mortgage in 2022: $3,399 (1.6%)
Business Search- 14 Million verified businesses
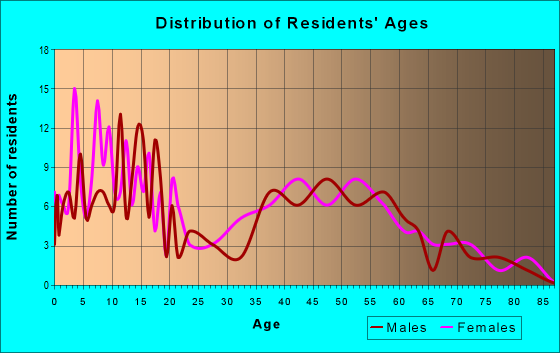
Males: 419
(48.9%)
Females: 438
(51.1%)
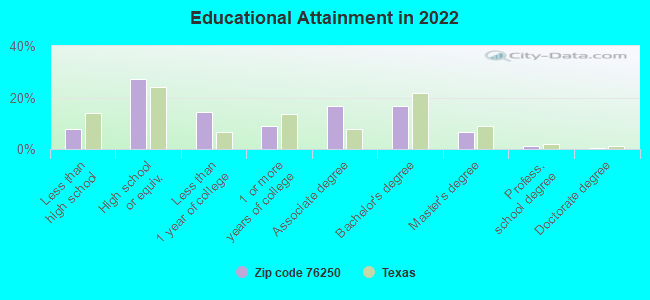
For population 25 years and over in 76250:
High school or higher: 92.1%
Bachelor's degree or higher: 25.0%
Graduate or professional degree: 8.3%
Unemployed: 1.0%
Mean travel time to work (commute): 23.4 minutes
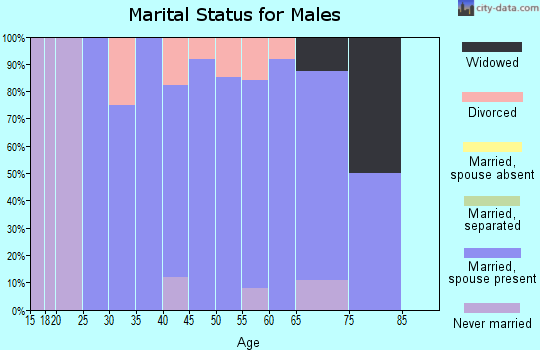
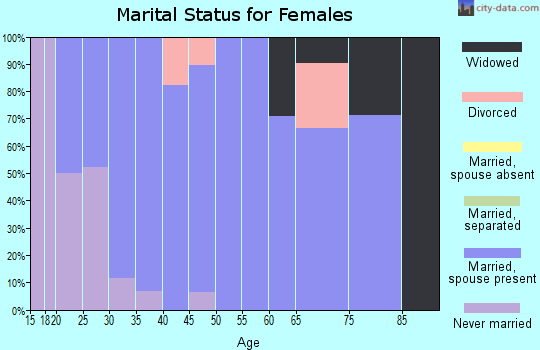
For population 15 years and over in 76250:
Never married: 19.1%
Now married: 65.9%
Separated: 0.0%
Widowed: 12.1%
Divorced: 2.9%
Zip code 76250 compared to state average:
Unemployed percentage significantly below state average.
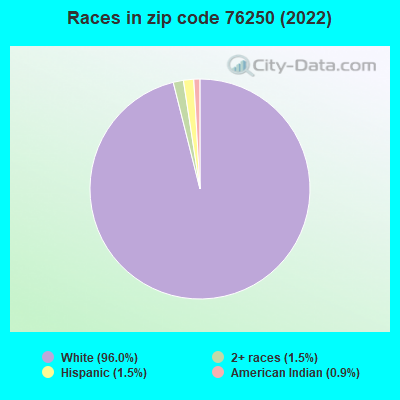
Black race population percentage significantly below state average.
Hispanic race population percentage significantly below state average.
Median age significantly above state average.
Foreign-born population percentage significantly below state average.
Renting percentage significantly below state average.
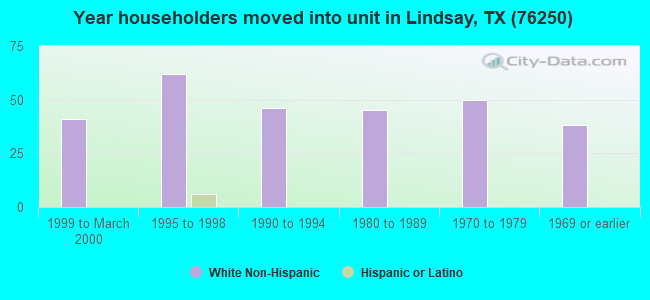
Length of stay since moving in significantly above state average.
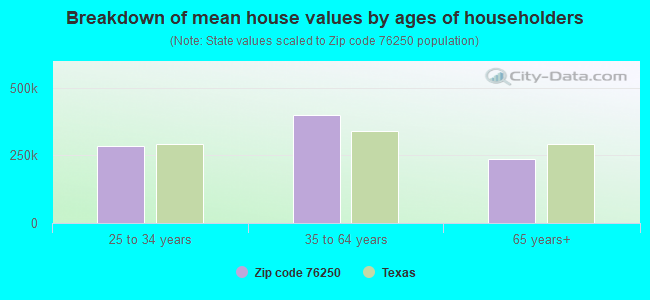
Estimated median house/condo value in 2022: $282,343
76250:
$282,343
Texas:
$275,400
Median resident age:
This zip code:
46.4 years
Texas median age:
35.6 years
Average household size:
This zip code:
2.4 people
Texas:
2.6 people
Averages for the 2020 tax year for zip code 76250, filed in 2021:
Average Adjusted Gross Income (AGI) in 2020: $88,073 (Individual Income Tax Returns)
Here:
$88,073
State:
$77,054
Salary/wage: $73,765 (reported on 81.4% of returns)
Here:
$73,765
State:
$62,766
(% of AGI for various income ranges: 1208.8% for AGIs below $25k, 3057.5% for AGIs $25k-50k, 6423.3% for AGIs $50k-75k, 9224.0% for AGIs $75k-100k, 14117.5% for AGIs $100k-200k)
Taxable interest for individuals: $826 (reported on 45.8% of returns)
This zip code:
$826
Texas:
$2,665
(% of AGI for various income ranges: 8.8% for AGIs below $25k, 33.8% for AGIs $25k-50k, 23.3% for AGIs $50k-75k, 32.0% for AGIs $75k-100k, 46.7% for AGIs $100k-200k)
Ordinary dividends: $3,953 (reported on 25.4% of returns)
Here:
$3,953
State:
$10,044
(% of AGI for various income ranges: 173.8% for AGIs $25k-50k, 250.0% for AGIs $50k-75k, 170.0% for AGIs $100k-200k)
Net capital gain/loss in AGI: +$18,843 (reported on 23.7% of returns)
Here:
+$18,843
State:
+$39,590
(% of AGI for various income ranges: 38.8% for AGIs $25k-50k, 110.0% for AGIs $50k-75k, 452.5% for AGIs $100k-200k)
Profit/loss from business: +$9,050 (reported on 20.3% of returns)
Here:
+$9,050
State:
+$10,888
(% of AGI for various income ranges: 85.0% for AGIs below $25k, 288.8% for AGIs $25k-50k, 153.3% for AGIs $50k-75k, 579.2% for AGIs $100k-200k)
Taxable individual retirement arrangement distribution: $18,429 (reported on 11.9% of returns)
76250:
$18,429
Texas:
$24,740
(% of AGI for various income ranges: 881.2% for AGIs $25k-50k, 487.5% for AGIs $100k-200k)
Total itemized deductions: $32,150 (reported on 6.8% of returns)
Here:
$32,150
State:
$40,428
(% of AGI for various income ranges: 1071.7% for AGIs $100k-200k)
Charity contributions: $10,850 (reported on 6.8% of returns)
Here:
$10,850
State:
$18,201
(% of AGI for various income ranges: 361.7% for AGIs $100k-200k)
Taxes paid: $7,950 (reported on 6.8% of returns)
76250:
$7,950
State:
$7,821
(% of AGI for various income ranges: 265.0% for AGIs $100k-200k)
Earned income credit: $2,433 (reported on 5.1% of returns)
Here:
$2,433
State:
$2,584
(% of AGI for various income ranges: 91.2% for AGIs below $25k)
Percentage of individuals using paid preparers for their 2020 taxes: 93.2%
Here:
93%
State:
92%
(% for various income ranges: 92.3% for AGIs below $25k, 100.0% for AGIs $25k-50k, 88.9% for AGIs $50k-75k, 85.7% for AGIs $75k-100k, 93.8% for AGIs $100k-200k, 100.0% for AGIs over 200k)
Averages for the 2012 tax year for zip code 76250, filed in 2013:
Average Adjusted Gross Income (AGI) in 2012: $70,815 (Individual Income Tax Returns)
Here:
$70,815
State:
$65,384
Salary/wage: $59,384 (reported on 83.6% of returns)
Here:
$59,384
State:
$52,524
(% of AGI for various income ranges: 74.8% for AGIs below $25k, 83.4% for AGIs $25k-50k, 79.5% for AGIs $50k-75k, 85.5% for AGIs $75k-100k, 75.2% for AGIs $100k-200k, 38.5% for AGIs over 200k)
Taxable interest for individuals: $810 (reported on 49.2% of returns)
This zip code:
$810
Texas:
$2,372
(% of AGI for various income ranges: 0.7% for AGIs below $25k, 1.1% for AGIs $25k-50k, 0.7% for AGIs $50k-75k, 0.5% for AGIs $75k-100k, 0.5% for AGIs $100k-200k, 0.4% for AGIs over 200k)
Ordinary dividends: $2,653 (reported on 24.6% of returns)
Here:
$2,653
State:
$9,721
(% of AGI for various income ranges: 3.0% for AGIs $25k-50k, 0.5% for AGIs $75k-100k, 1.6% for AGIs $100k-200k)
Net capital gain/loss in AGI: +$6,609 (reported on 18.0% of returns)
Here:
+$6,609
State:
+$35,319
(% of AGI for various income ranges: 0.3% for AGIs $25k-50k, 1.6% for AGIs $75k-100k, 4.0% for AGIs $100k-200k)
Profit/loss from business: +$22,008 (reported on 19.7% of returns)
Here:
+$22,008
State:
+$13,732
(% of AGI for various income ranges: 7.3% for AGIs $25k-50k, 3.2% for AGIs $75k-100k, 14.1% for AGIs $100k-200k)
Taxable individual retirement arrangement distribution: $13,017 (reported on 9.8% of returns)
76250:
$13,017
Texas:
$19,511
(% of AGI for various income ranges: 10.4% for AGIs $25k-50k, 5.2% for AGIs $75k-100k)
Total itemized deductions: $20,053 (17% of AGI, reported on 31.1% of returns)
Here:
$20,053
State:
$24,724
Here:
16.9% of AGI
State:
15.9% of AGI
(% of AGI for various income ranges: 7.2% for AGIs $25k-50k, 7.3% for AGIs $50k-75k, 7.0% for AGIs $75k-100k, 11.4% for AGIs $100k-200k, 9.4% for AGIs over 200k)
Charity contributions: $6,706 (reported on 26.2% of returns)
Here:
$6,706
State:
$6,808
(% of AGI for various income ranges: 1.5% for AGIs $50k-75k, 1.4% for AGIs $75k-100k, 5.9% for AGIs $100k-200k)
Taxes paid: $5,679 (reported on 31.1% of returns)
76250:
$5,679
State:
$6,921
(% of AGI for various income ranges: 2.3% for AGIs $25k-50k, 2.0% for AGIs $50k-75k, 2.1% for AGIs $75k-100k, 3.2% for AGIs $100k-200k, 2.5% for AGIs over 200k)
Earned income credit: $1,600 (reported on 8.2% of returns)
Here:
$1,600
State:
$2,570
(% of AGI for various income ranges: 4.4% for AGIs below $25k)
Percentage of individuals using paid preparers for their 2012 taxes: 65.6%
Here:
66%
State:
51%
(% for various income ranges: 61.1% for AGIs below $25k, 54.5% for AGIs $25k-50k, 66.7% for AGIs $50k-75k, 75.0% for AGIs $75k-100k, 75.0% for AGIs $100k-200k, 66.7% for AGIs over 200k)
Averages for the 2004 tax year for zip code 76250, filed in 2005:
Average Adjusted Gross Income (AGI) in 2004: $49,859 (Individual Income Tax Returns)
Here:
$49,859
State:
$47,881
Salary/wage: $45,605 (reported on 88.1% of returns)
Here:
$45,605
State:
$41,947
(% of AGI for various income ranges: 87.9% for AGIs below $10k, 68.6% for AGIs $10k-25k, 77.1% for AGIs $25k-50k, 85.3% for AGIs $50k-75k, 87.2% for AGIs $75k-100k, 73.5% for AGIs over 100k)
Taxable interest for individuals: $909 (reported on 56.1% of returns)
This zip code:
$909
Texas:
$2,255
(% of AGI for various income ranges: 4.2% for AGIs below $10k, 4.5% for AGIs $10k-25k, 1.9% for AGIs $25k-50k, 0.7% for AGIs $50k-75k, 0.4% for AGIs $75k-100k, 0.6% for AGIs over 100k)
Taxable dividends: $1,234 (reported on 28.9% of returns)
Here:
$1,234
State:
$4,261
(% of AGI for various income ranges: 0.4% for AGIs $10k-25k, 1.6% for AGIs $25k-50k, 1.0% for AGIs $50k-75k, 0.2% for AGIs $75k-100k, 0.4% for AGIs over 100k)
Net capital gain/loss: +$7,466 (reported on 23.8% of returns)
Here:
+$7,466
State:
+$16,110
(% of AGI for various income ranges: -1.2% for AGIs below $10k, 1.6% for AGIs $25k-50k, 1.2% for AGIs $50k-75k, 2.7% for AGIs $75k-100k, 8.8% for AGIs over 100k)
Profit/loss from business: +$6,019 (reported on 21.5% of returns)
Here:
+$6,019
State:
+$11,013
(% of AGI for various income ranges: 8.6% for AGIs below $10k, 5.8% for AGIs $25k-50k, 1.6% for AGIs $50k-75k, 4.4% for AGIs $75k-100k, -0.5% for AGIs over 100k)
IRA payment deduction: $3,238 (reported on 4.3% of returns)
76250:
$3,238
Texas:
$3,120
Total itemized deductions: $16,737 (20% of AGI, reported on 28.1% of returns)
Here:
$16,737
State:
$19,631
Here:
20.5% of AGI
State:
18.9% of AGI
(% of AGI for various income ranges: 11.5% for AGIs $25k-50k, 10.1% for AGIs $50k-75k, 7.2% for AGIs $75k-100k, 11.8% for AGIs over 100k)
Charity contributions deductions: $2,642 (3% of AGI, reported on 24.6% of returns)
Here:
$2,642
State:
$4,753
Here:
3.1% of AGI
State:
4.2% of AGI
(% of AGI for various income ranges: 1.1% for AGIs $25k-50k, 1.3% for AGIs $50k-75k, 1.2% for AGIs $75k-100k, 1.9% for AGIs over 100k)
Total tax: $6,031 (reported on 80.5% of returns)
76250:
$6,031
State:
$9,058
(% of AGI for various income ranges: 2.6% for AGIs below $10k, 3.3% for AGIs $10k-25k, 7.2% for AGIs $25k-50k, 7.7% for AGIs $50k-75k, 9.9% for AGIs $75k-100k, 14.7% for AGIs over 100k)
Earned income credit: $1,353 (reported on 7.0% of returns)
Here:
$1,353
State:
$2,024
Percentage of individuals using paid preparers for their 2004 taxes: 67.2%
Here:
67%
State:
57%
(% for various income ranges: 51.0% for AGIs below $10k, 57.4% for AGIs $10k-25k, 76.7% for AGIs $25k-50k, 68.5% for AGIs $50k-75k, 74.3% for AGIs $75k-100k, 77.8% for AGIs over 100k)
Household received Food Stamps/SNAP in the past 12 months: 2 Household did not receive Food Stamps/SNAP in the past 12 months: 354
Women who had a birth in the past 12 months: 5 (5 now married, 0 unmarried) Women who did not have a birth in the past 12 months: 151 (103 now married, 46 unmarried)
Housing units in zip code 76250 with a mortgage: 136 (6 second mortgage, 4 both second mortgage and home equity loan) Median monthly owner costs for units with a mortgage: $2,028 Median monthly owner costs for units without a mortgage: $706
Residents with income below the poverty level in 2022:
This zip code:
2.6%
Whole state:
14.0%
Residents with income below 50% of the poverty level in 2022:
This zip code:
1.7%
Whole state:
7.4%
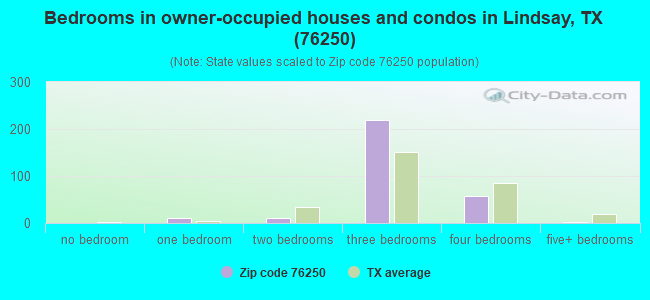
Median number of rooms in houses and condos:
Here:
6.2
State:
6.3
Median number of rooms in apartments:
Here:
4.8
State:
4.0
Notable locations in this zip code not listed on our city pages
Size of family households: 124 2-persons, 40 3-persons, 51 4-persons, 10 5-persons, 9 6-persons, 8 7-or-more-persons
Size of nonfamily households: 113 1-person, 1 2-persons
188 married couples with children.
27 single-parent households (23 men, 4 women).
98.4% of residents of 76250 zip code speak English at home.
1.4% of residents speak Spanish at home (64% very well, 36% well).
0.4% of residents speak other Indo-European language at home (100% very well).
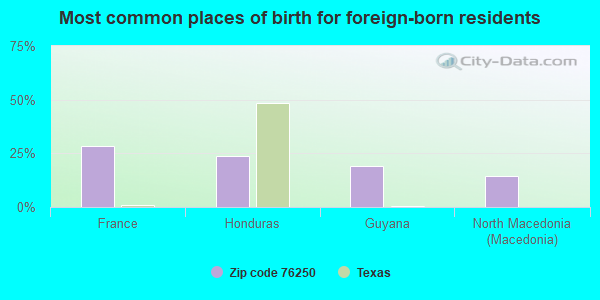
Foreign born population: 23 (2.7%) (100.0% of them are naturalized citizens)
This zip code:
2.7%
Whole state:
17.2%
29%France
24%Honduras
19%Guyana
14%North Macedonia (Macedonia)
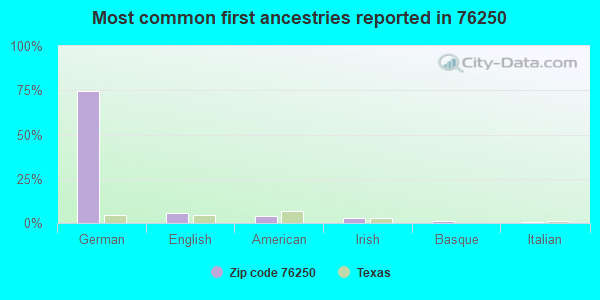
74%German
6%English
4%American
3%Irish
1%Basque
1%Italian
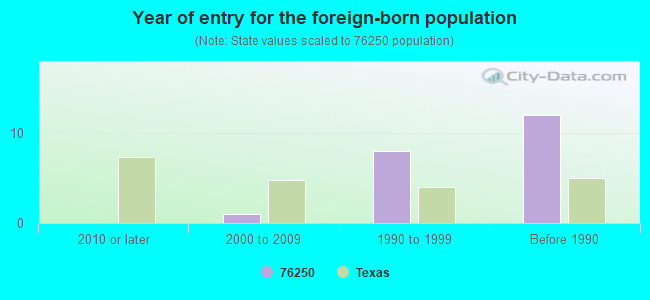
Year of entry for the foreign-born population
02010 or later
12000 to 2009
81990 to 1999
12Before 1990
Housing units lacking complete kitchen facilities: 0.5%
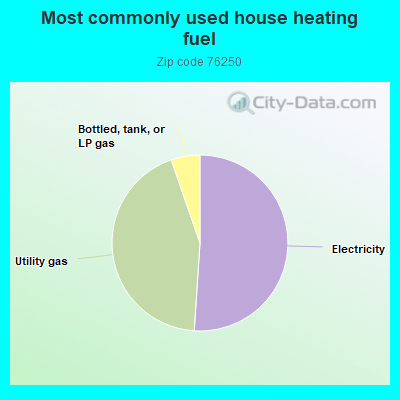
51.2%Electricity
43.8%Utility gas
5.3%Bottled, tank, or LP gas
Population in 1990: 610. Population change in the 1990s: +229 (+37.5%).
Place of birth for U.S.-born residents:
This state: 688
Midwest: 40
South: 72
West: 24
65% of the 76250 zip code residents lived in the same house 5 years ago. Out of people who lived in different houses, 65% lived in this county. Out of people who lived in different counties, 50% lived in Texas.
98% of the 76250 zip code residents lived in the same house 1 year ago. Out of people who lived in different houses, 110% moved from this county.
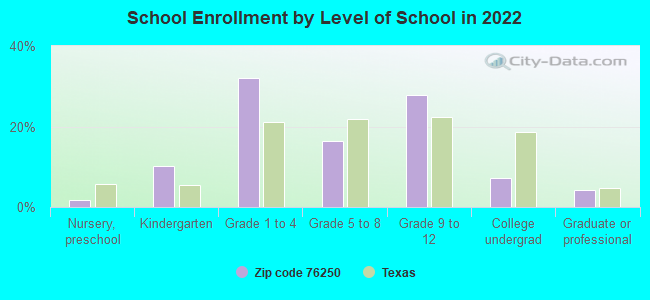
Private vs. public school enrollment:
Students in private schools in grades 1 to 8 (elementary and middle school): 15
Here:
19.4%
Texas:
8.8%
Students in private schools in grades 9 to 12 (high school): 3
Here:
7.0%
Texas:
8.0%
Students in private undergraduate colleges:
Here:
0.0%
Texas:
16.2%
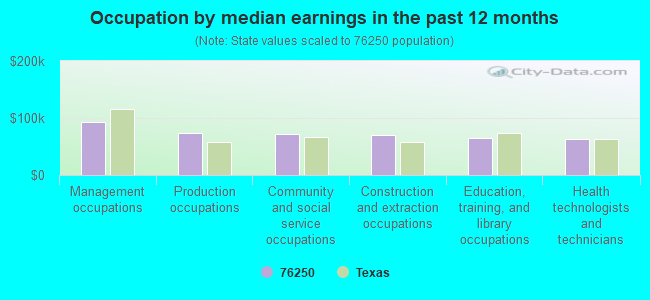
Occupation by median earnings in the past 12 months ($)
92,848Management occupations
73,230Production occupations
71,941Community and social service occupations
69,793Construction and extraction occupations
65,407Education, training, and library occupations
62,441Health technologists and technicians
Top industries in this zip code by the number of employees in 2005:
Accommodation and Food Services: Limited-Service Restaurants (20-49: 1)
Other Services (except Public Administration): Drycleaning and Laundry Services (except Coin-Operated) (20-49: 1)
Other Services (except Public Administration): Religious Organizations (10-19: 1)
Construction: Site Preparation Contractors (5-9: 1)
Finance and Insurance: Insurance Agencies and Brokerages (1-4: 1)
Other Services (except Public Administration): Beauty Salons (1-4: 1)
2002 - 2018 National Fire Incident Reporting System (NFIRS) incidents
Based on the data from the years 2002 - 2018 the average number of fires per year is 8. The highest number of reported fires - 15 took place in 2006, and the least - 1 in 2004. The data has a constant trend.
When looking into fire subcategories, the most incidents belonged to: Outside Fires (60.4%), and Structure Fires (27.1%).
Fire incident types reported to NFIRS in Zip Code 76250


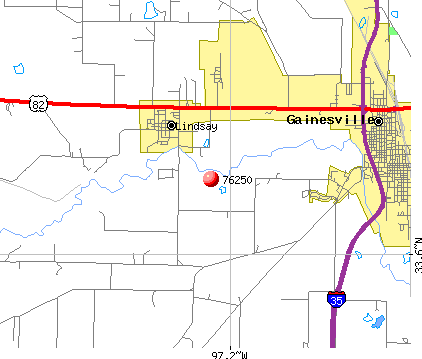 Nearest zip codes: 76240, 76253, 76252, 73459, 76238, 76272.
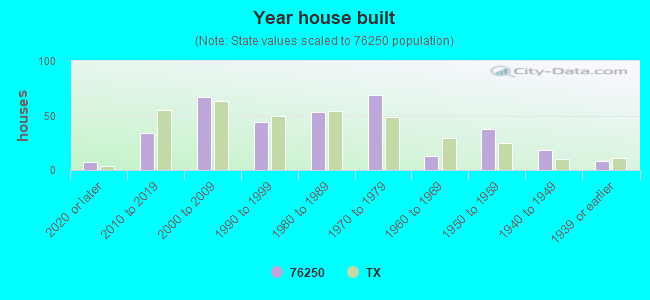


 Based on the data from the years 2002 - 2018 the average number of fires per year is 8. The highest number of reported fires - 15 took place in 2006, and the least - 1 in 2004. The data has a constant trend.
 When looking into fire subcategories, the most incidents belonged to: Outside Fires (60.4%), and Structure Fires (27.1%).