Estimated zip code population in 2022: 12,111 Zip code population in 2010: 11,270 Zip code population in 2000: 11,347
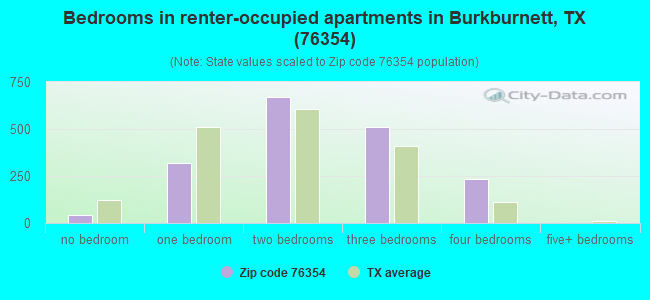
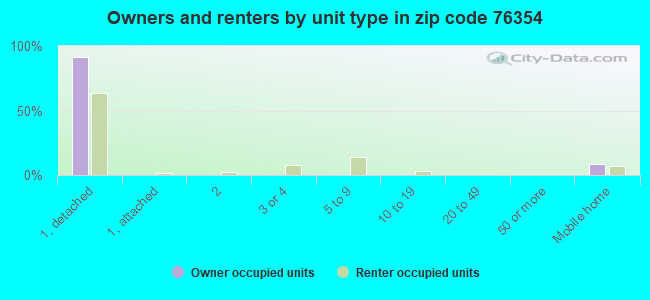
Houses and condos: 5,573 Renter-occupied apartments: 1,787
% of renters here:
35%
State:
38%
March 2022 cost of living index in zip code 76354: 82.4 (low, U.S. average is 100)
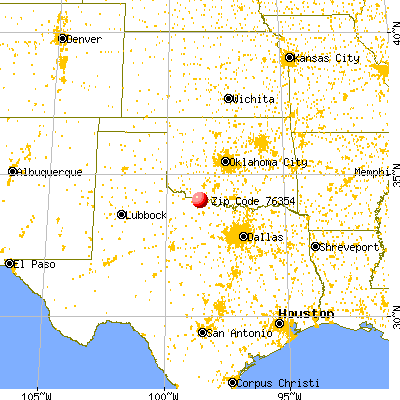
Land area: 78.5 sq. mi. Water area: 0.1 sq. mi.
Population density: 154 people per square mile
(very low).
OSM Map
General Map
Google Map
MSN Map
OSM Map
General Map
Google Map
MSN Map
OSM Map
General Map
Google Map
MSN Map
OSM Map
General Map
Google Map
MSN Map
Please wait while loading the map...
Real estate property taxes paid for housing units in 2022:
This zip code:
1.6% ($2,547)
Texas:
1.5% ($4,050)
Median real estate property taxes paid for housing units with mortgages in 2022: $3,725 (1.9%) Median real estate property taxes paid for housing units with no mortgage in 2022: $1,920 (1.4%)
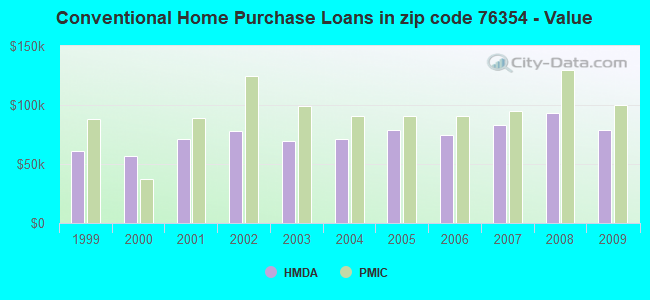
Estimated median house/condo value in 2022: $160,496
76354:
$160,496
Texas:
$275,400
According to our research of Texas and other state lists, there were 27 registered sex offenders living in 76354 zip code as of April 26, 2024. The ratio of all residents to sex offenders in zip code 76354 is 438 to 1. The ratio of registered sex offenders to all residents in this zip code is near the state average.
Median resident age:
This zip code:
43.2 years
Texas median age:
35.6 years
Average household size:
This zip code:
2.4 people
Texas:
2.6 people
Averages for the 2020 tax year for zip code 76354, filed in 2021:
Average Adjusted Gross Income (AGI) in 2020: $54,624 (Individual Income Tax Returns)
Here:
$54,624
State:
$77,054
Salary/wage: $47,171 (reported on 83.2% of returns)
Here:
$47,171
State:
$62,766
(% of AGI for various income ranges: 1116.8% for AGIs below $25k, 3316.5% for AGIs $25k-50k, 5832.8% for AGIs $50k-75k, 8377.1% for AGIs $75k-100k, 15370.5% for AGIs $100k-200k, 49563.3% for AGIs over 200k)
Taxable interest for individuals: $1,278 (reported on 24.4% of returns)
This zip code:
$1,278
Texas:
$2,665
(% of AGI for various income ranges: 13.7% for AGIs below $25k, 12.2% for AGIs $25k-50k, 50.8% for AGIs $50k-75k, 71.7% for AGIs $75k-100k, 115.6% for AGIs $100k-200k, 636.7% for AGIs over 200k)
Ordinary dividends: $3,148 (reported on 10.7% of returns)
Here:
$3,148
State:
$10,044
(% of AGI for various income ranges: 9.2% for AGIs below $25k, 19.1% for AGIs $25k-50k, 33.3% for AGIs $50k-75k, 71.4% for AGIs $75k-100k, 125.6% for AGIs $100k-200k, 1220.0% for AGIs over 200k)
Net capital gain/loss in AGI: +$5,583 (reported on 10.1% of returns)
Here:
+$5,583
State:
+$39,590
(% of AGI for various income ranges: 5.7% for AGIs below $25k, 7.7% for AGIs $25k-50k, 51.0% for AGIs $50k-75k, 56.7% for AGIs $75k-100k, 324.2% for AGIs $100k-200k, 2826.7% for AGIs over 200k)
Profit/loss from business: +$8,944 (reported on 11.6% of returns)
Here:
+$8,944
State:
+$10,888
(% of AGI for various income ranges: 56.5% for AGIs below $25k, 69.1% for AGIs $25k-50k, 130.2% for AGIs $50k-75k, 254.5% for AGIs $75k-100k, 299.8% for AGIs $100k-200k, 2300.0% for AGIs over 200k)
Taxable individual retirement arrangement distribution: $13,554 (reported on 7.0% of returns)
76354:
$13,554
Texas:
$24,740
(% of AGI for various income ranges: 26.1% for AGIs below $25k, 53.7% for AGIs $25k-50k, 174.5% for AGIs $50k-75k, 201.4% for AGIs $75k-100k, 491.9% for AGIs $100k-200k)
Total itemized deductions: $37,794 (reported on 3.2% of returns)
Here:
$37,794
State:
$40,428
(% of AGI for various income ranges: 36.1% for AGIs below $25k, 88.0% for AGIs $50k-75k, 220.5% for AGIs $75k-100k, 622.8% for AGIs $100k-200k, 5896.7% for AGIs over 200k)
Charity contributions: $11,600 (reported on 2.9% of returns)
Here:
$11,600
State:
$18,201
(% of AGI for various income ranges: 17.0% for AGIs $25k-50k, 51.4% for AGIs $75k-100k, 172.3% for AGIs $100k-200k, 1946.7% for AGIs over 200k)
Taxes paid: $6,362 (reported on 3.0% of returns)
76354:
$6,362
State:
$7,821
(% of AGI for various income ranges: 6.1% for AGIs below $25k, 10.8% for AGIs $50k-75k, 43.3% for AGIs $75k-100k, 100.5% for AGIs $100k-200k, 836.7% for AGIs over 200k)
Earned income credit: $2,493 (reported on 19.6% of returns)
Here:
$2,493
State:
$2,584
(% of AGI for various income ranges: 111.2% for AGIs below $25k, 80.3% for AGIs $25k-50k, 2.7% for AGIs $50k-75k)
Percentage of individuals using paid preparers for their 2020 taxes: 94.3%
Here:
94%
State:
92%
(% for various income ranges: 94.3% for AGIs below $25k, 94.9% for AGIs $25k-50k, 92.4% for AGIs $50k-75k, 94.6% for AGIs $75k-100k, 94.2% for AGIs $100k-200k, 100.0% for AGIs over 200k)
Averages for the 2012 tax year for zip code 76354, filed in 2013:
Average Adjusted Gross Income (AGI) in 2012: $48,056 (Individual Income Tax Returns)
Here:
$48,056
State:
$65,384
Salary/wage: $40,025 (reported on 85.0% of returns)
Here:
$40,025
State:
$52,524
(% of AGI for various income ranges: 78.0% for AGIs below $25k, 78.2% for AGIs $25k-50k, 75.8% for AGIs $50k-75k, 72.0% for AGIs $75k-100k, 73.6% for AGIs $100k-200k, 29.1% for AGIs over 200k)
Taxable interest for individuals: $1,504 (reported on 29.3% of returns)
This zip code:
$1,504
Texas:
$2,372
(% of AGI for various income ranges: 0.8% for AGIs below $25k, 0.7% for AGIs $25k-50k, 0.6% for AGIs $50k-75k, 0.8% for AGIs $75k-100k, 0.8% for AGIs $100k-200k, 2.6% for AGIs over 200k)
Ordinary dividends: $2,518 (reported on 12.2% of returns)
Here:
$2,518
State:
$9,721
(% of AGI for various income ranges: 0.6% for AGIs below $25k, 0.5% for AGIs $25k-50k, 0.4% for AGIs $50k-75k, 0.7% for AGIs $75k-100k, 0.9% for AGIs $100k-200k, 1.0% for AGIs over 200k)
Net capital gain/loss in AGI: +$7,967 (reported on 9.4% of returns)
Here:
+$7,967
State:
+$35,319
(% of AGI for various income ranges: 0.2% for AGIs $25k-50k, 0.5% for AGIs $50k-75k, 0.7% for AGIs $75k-100k, 1.2% for AGIs $100k-200k, 10.9% for AGIs over 200k)
Profit/loss from business: +$12,229 (reported on 11.6% of returns)
Here:
+$12,229
State:
+$13,732
(% of AGI for various income ranges: 3.7% for AGIs below $25k, 1.8% for AGIs $25k-50k, 1.8% for AGIs $50k-75k, 1.8% for AGIs $75k-100k, 2.3% for AGIs $100k-200k, 10.4% for AGIs over 200k)
Taxable individual retirement arrangement distribution: $8,004 (reported on 9.1% of returns)
76354:
$8,004
Texas:
$19,511
(% of AGI for various income ranges: 1.9% for AGIs below $25k, 1.4% for AGIs $25k-50k, 1.5% for AGIs $50k-75k, 1.8% for AGIs $75k-100k, 1.7% for AGIs $100k-200k)
Total itemized deductions: $20,700 (23% of AGI, reported on 16.7% of returns)
Here:
$20,700
State:
$24,724
Here:
23.0% of AGI
State:
15.9% of AGI
(% of AGI for various income ranges: 4.5% for AGIs below $25k, 4.5% for AGIs $25k-50k, 7.1% for AGIs $50k-75k, 7.7% for AGIs $75k-100k, 10.4% for AGIs $100k-200k, 7.0% for AGIs over 200k)
Charity contributions: $5,923 (reported on 12.2% of returns)
Here:
$5,923
State:
$6,808
(% of AGI for various income ranges: 0.5% for AGIs below $25k, 0.8% for AGIs $25k-50k, 1.2% for AGIs $50k-75k, 1.5% for AGIs $75k-100k, 2.6% for AGIs $100k-200k, 2.2% for AGIs over 200k)
Taxes paid: $4,598 (reported on 16.5% of returns)
76354:
$4,598
State:
$6,921
(% of AGI for various income ranges: 0.5% for AGIs below $25k, 0.9% for AGIs $25k-50k, 1.5% for AGIs $50k-75k, 1.9% for AGIs $75k-100k, 2.6% for AGIs $100k-200k, 1.4% for AGIs over 200k)
Earned income credit: $2,274 (reported on 20.7% of returns)
Here:
$2,274
State:
$2,570
(% of AGI for various income ranges: 7.0% for AGIs below $25k, 1.4% for AGIs $25k-50k)
Percentage of individuals using paid preparers for their 2012 taxes: 39.8%
Here:
40%
State:
51%
(% for various income ranges: 33.8% for AGIs below $25k, 39.7% for AGIs $25k-50k, 41.5% for AGIs $50k-75k, 45.8% for AGIs $75k-100k, 50.0% for AGIs $100k-200k, 100.0% for AGIs over 200k)
Averages for the 2004 tax year for zip code 76354, filed in 2005:
Average Adjusted Gross Income (AGI) in 2004: $38,543 (Individual Income Tax Returns)
Here:
$38,543
State:
$47,881
Salary/wage: $34,573 (reported on 84.7% of returns)
Here:
$34,573
State:
$41,947
(% of AGI for various income ranges: 161.0% for AGIs below $10k, 76.9% for AGIs $10k-25k, 78.4% for AGIs $25k-50k, 80.0% for AGIs $50k-75k, 78.7% for AGIs $75k-100k, 57.9% for AGIs over 100k)
Taxable interest for individuals: $1,774 (reported on 41.7% of returns)
This zip code:
$1,774
Texas:
$2,255
(% of AGI for various income ranges: 7.7% for AGIs below $10k, 2.2% for AGIs $10k-25k, 1.6% for AGIs $25k-50k, 1.2% for AGIs $50k-75k, 1.3% for AGIs $75k-100k, 3.4% for AGIs over 100k)
Taxable dividends: $1,333 (reported on 16.7% of returns)
Here:
$1,333
State:
$4,261
(% of AGI for various income ranges: 2.0% for AGIs below $10k, 0.4% for AGIs $10k-25k, 0.4% for AGIs $25k-50k, 0.4% for AGIs $50k-75k, 0.6% for AGIs $75k-100k, 1.0% for AGIs over 100k)
Net capital gain/loss: +$4,471 (reported on 12.3% of returns)
Here:
+$4,471
State:
+$16,110
(% of AGI for various income ranges: 2.0% for AGIs below $10k, 0.1% for AGIs $10k-25k, 0.1% for AGIs $25k-50k, 0.5% for AGIs $50k-75k, 0.8% for AGIs $75k-100k, 6.0% for AGIs over 100k)
Profit/loss from business: +$9,312 (reported on 13.2% of returns)
Here:
+$9,312
State:
+$11,013
(% of AGI for various income ranges: 0.3% for AGIs below $10k, 3.7% for AGIs $10k-25k, 1.8% for AGIs $25k-50k, 1.9% for AGIs $50k-75k, 2.3% for AGIs $75k-100k, 7.7% for AGIs over 100k)
IRA payment deduction: $2,507 (reported on 3.1% of returns)
76354:
$2,507
Texas:
$3,120
(% of AGI for various income ranges: 0.2% for AGIs $10k-25k, 0.3% for AGIs $25k-50k, 0.2% for AGIs $50k-75k, 0.3% for AGIs $75k-100k)
Self-employed pension: $10,562 (reported on 0.3% of returns)
Here:
$10,562
Texas:
$16,401
Total itemized deductions: $15,985 (22% of AGI, reported on 17.5% of returns)
Here:
$15,985
State:
$19,631
Here:
22.4% of AGI
State:
18.9% of AGI
(% of AGI for various income ranges: 6.6% for AGIs below $10k, 4.4% for AGIs $10k-25k, 5.6% for AGIs $25k-50k, 6.8% for AGIs $50k-75k, 9.0% for AGIs $75k-100k, 10.4% for AGIs over 100k)
Charity contributions deductions: $4,183 (6% of AGI, reported on 14.9% of returns)
Here:
$4,183
State:
$4,753
Here:
5.6% of AGI
State:
4.2% of AGI
(% of AGI for various income ranges: 0.7% for AGIs below $10k, 0.8% for AGIs $10k-25k, 1.0% for AGIs $25k-50k, 1.6% for AGIs $50k-75k, 2.2% for AGIs $75k-100k, 2.6% for AGIs over 100k)
Total tax: $4,863 (reported on 73.0% of returns)
76354:
$4,863
State:
$9,058
(% of AGI for various income ranges: 3.9% for AGIs below $10k, 3.7% for AGIs $10k-25k, 6.1% for AGIs $25k-50k, 8.4% for AGIs $50k-75k, 10.7% for AGIs $75k-100k, 17.3% for AGIs over 100k)
Earned income credit: $1,728 (reported on 18.1% of returns)
Here:
$1,728
State:
$2,024
Percentage of individuals using paid preparers for their 2004 taxes: 52.6%
Here:
53%
State:
57%
(% for various income ranges: 45.7% for AGIs below $10k, 54.7% for AGIs $10k-25k, 53.2% for AGIs $25k-50k, 52.9% for AGIs $50k-75k, 53.9% for AGIs $75k-100k, 60.7% for AGIs over 100k)
Likely homosexual households (counted as self-reported same-sex unmarried-partner households)
Lesbian couples: 2.6% of all households
Gay men: 0.0% of all households
Household received Food Stamps/SNAP in the past 12 months: 557 Household did not receive Food Stamps/SNAP in the past 12 months: 4,489
Women who had a birth in the past 12 months: 194 (119 now married, 74 unmarried) Women who did not have a birth in the past 12 months: 2,781 (1,268 now married, 1,511 unmarried)
Housing units in zip code 76354 with a mortgage: 1,505 (79 second mortgage, 18 both second mortgage and home equity loan) Median monthly owner costs for units with a mortgage: $1,533 Median monthly owner costs for units without a mortgage: $535
Residents with income below the poverty level in 2022:
This zip code:
8.9%
Whole state:
14.0%
Residents with income below 50% of the poverty level in 2022:
This zip code:
3.8%
Whole state:
7.4%
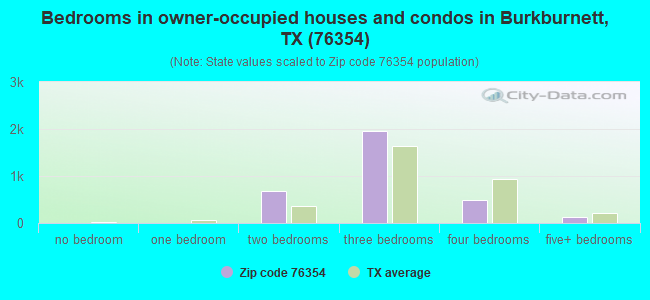
Median number of rooms in houses and condos:
Here:
6.3
State:
6.3
Median number of rooms in apartments:
Here:
4.7
State:
4.0
Notable locations in this zip code not listed on our city pages
Notable locations in zip code 76354: Kendall County Library System (A), Burkburnett Fire Department Station 1 (B), Burkburnett Fire Department Station 3 (C). Display/hide their locations on the map
Churches in zip code 76354 include: Janlee Baptist Church (A), Saint John the Divine Episcopal Church of Burkburnett (B), Church of the Nazarene (C), Burkburnett Church of God (D), Central Church of Christ of Burkburnett (E), Burkburnett Church of Christ (F), Saint Jude Catholic Church (G), First United Methodist Church of Burkburnett (H), Grace Lutheran Church of Burkburnett (I). Display/hide their locations on the map
1,575 married couples with children.
355 single-parent households (13 men, 342 women).
92.6% of residents of 76354 zip code speak English at home.
5.9% of residents speak Spanish at home (65% very well, 11% well, 22% not well, 2% not at all).
1.4% of residents speak other Indo-European language at home (28% very well, 72% not well).
0.1% of residents speak Asian or Pacific Island language at home (100% well).
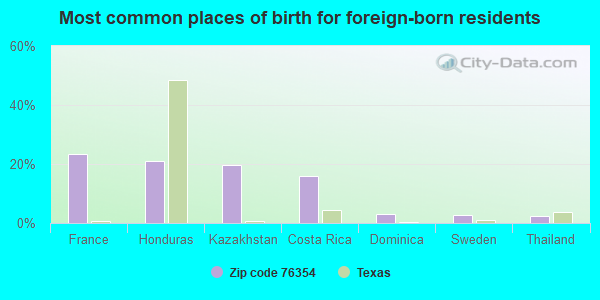
Foreign born population: 533 (4.4%) (40.0% of them are naturalized citizens)
This zip code:
4.4%
Whole state:
17.2%
24%France
21%Honduras
20%Kazakhstan
16%Costa Rica
3%Dominica
3%Sweden
2%Thailand
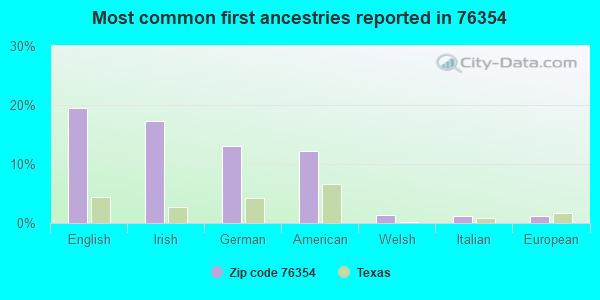
20%English
17%Irish
13%German
12%American
1%Welsh
1%Italian
1%European
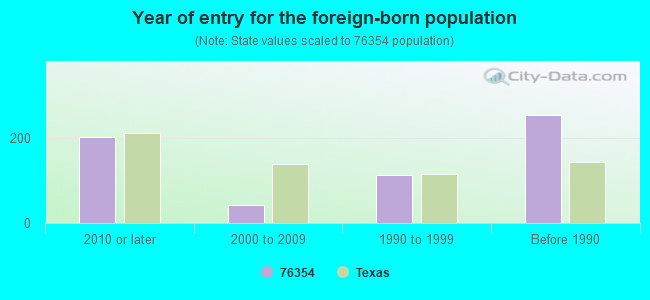
Year of entry for the foreign-born population
2022010 or later
422000 to 2009
1141990 to 1999
254Before 1990
Facilities with environmental interests located in this zip code:
AMERON FIBERGLASS PIPE DIVISION (1004 AMERON RD. in BURKBURNETT, TX)
AIR MAJOR (AIRS/AFS) ENFORCEMENT/COMPLIANCE ACTIVITY (Integrated Compliance Information System) CRITERIA AND HAZARDOUS AIR POLLUTANT INVENTORY (Inventory of air pollution sources) HAZARDOUS WASTE BIENNIAL REPORTER (Resource Conservation and Recovery Act (tracking hazardous waste)) Large Quantity Generators, more that 1000 kg of hazardous waste/month (Resource Conservation and Recovery Act (tracking hazardous waste)) - notification TRI REPORTER (Tracking of toxic chemicals releasing facilities) Business SIC and NAICS classification: PLASTICS PIPE Organizations: AMERON FIBERGLASS COMPOSITE PIPE DIVISIO (CONTACT/OPERATOR)
, AMERON INC (CONTACT/OWNER)
Alternative names: AMERON FIBERGLASS COMPOSITE PIPE DIV. USA
ATHENS CULTURED MARBLE (411 E 3RD ST in BURKBURNETT, TX)
(Resource Conservation and Recovery Act (tracking hazardous waste))
Housing units lacking complete plumbing facilities: 3.6% Housing units lacking complete kitchen facilities: 3.7%
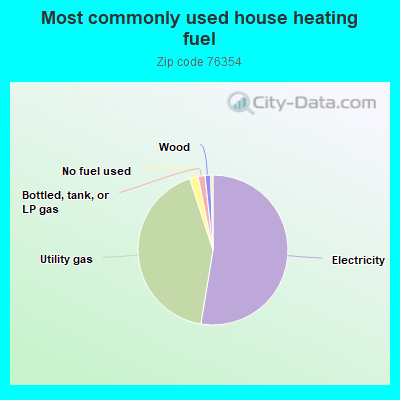
52.7%Electricity
42.5%Utility gas
1.8%No fuel used
1.5%Bottled, tank, or LP gas
1.2%Wood
Population in 1990: 10,558. Population change in the 1990s: +789 (+7.5%).
Place of birth for U.S.-born residents:
This state: 6,505
Northeast: 364
Midwest: 1,257
South: 2,190
West: 1,213
55% of the 76354 zip code residents lived in the same house 5 years ago. Out of people who lived in different houses, 62% lived in this county. Out of people who lived in different counties, 50% lived in Texas.
89% of the 76354 zip code residents lived in the same house 1 year ago. Out of people who lived in different houses, 50% moved from this county. Out of people who lived in different houses, 41% moved from different county within same state. Out of people who lived in different houses, 6% moved from different state. Out of people who lived in different houses, 2% moved from abroad.
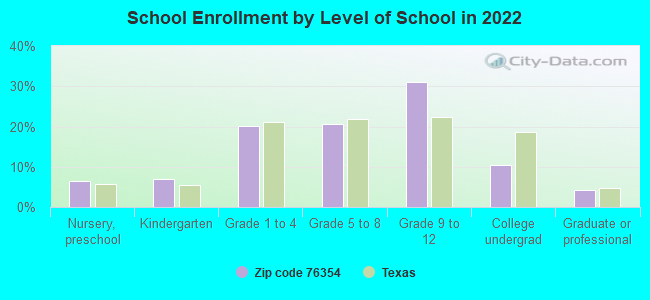
Private vs. public school enrollment:
Students in private schools in grades 1 to 8 (elementary and middle school): 60
Here:
6.1%
Texas:
8.8%
Students in private schools in grades 9 to 12 (high school): 55
Here:
7.4%
Texas:
8.0%
Students in private undergraduate colleges: 56
Here:
22.0%
Texas:
16.2%
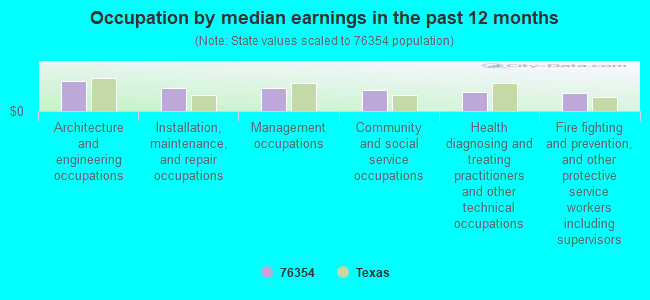
Occupation by median earnings in the past 12 months ($)
93,744Architecture and engineering occupations
71,946Installation, maintenance, and repair occupations
71,127Management occupations
65,705Community and social service occupations
58,069Health diagnosing and treating practitioners and other technical occupations
56,179Fire fighting and prevention, and other protective service workers including supervisors
Companies with federal contracts located in this zip code (BURKBURNETT, TX):
CANTU SERVICES INC (1003 SHEPPARD RD; small business) : $19,292,593 in 34 contractsfrom 1999 to 2002
Contracts for Food Services by Air Force, Army Signed by year:2000: $5,358,065; 2001: $6,612,123; 2002: $3,767,463; 2003: $0; 2004: $0; 2005: $0; 2006: $0.
Biggest contracts:
$2,079,483 with Air Force for Food Services. Taking place in AL. Signed on 2002-01-07. Completion date: 2001-05-31.
$2,031,452, same as above.Signed on 1999-10-29. Completion date: 2000-11-30.
$1,525,340 with Army for Food Services. Taking place in OK. Signed on 2001-07-01. Completion date: 2001-09-30.
$1,405,742, same as above.Signed on 2000-07-01. Completion date: 2000-09-30.
DONALD D RUTLEDGE (1120 SHEPPARD RD; small business) : $69,845 in 3 contractsfrom 2000 to 2004
$58,500 with Air Force for Maintenance, Repair and Rebuilding of Equipment -- Pumps and Compressors. Signed on 2003-09-27. Completion date: 2003-12-09.
$6,387 with Air Force for Maintenance, Repair or Alteration of Real Property -- Hospitals and Infirmaries. Signed on 2004-03-15. Completion date: 2004-04-11.
$4,958, same as above.Signed on 2000-08-17. Completion date: 2000-08-19.
PATSY L MONTGOMERY (812 EASY ST; small business) : $22,098 in 7 contractsfrom 2004 to 2005
Contracts for Recreational Services by U.S. Army Corps of Engineers - civil program financing only, Army Signed by year:2000: $0; 2001: $0; 2002: $0; 2003: $0; 2004: $17,215; 2005: $4,883; 2006: $0.
Biggest contracts:
$9,164 with U.S. Army Corps of Engineers - civil program financing only for Recreational Services. Signed on 2004-02-25. Completion date: 2004-09-30.
$9,164 with Army for Recreational Services. Signed on 2004-02-25. Completion date: 2004-09-30.
$4,883, same as above.Signed on 2005-02-04. Completion date: 2005-09-30.
$769, same as above.Signed on 2004-02-26. Completion date: 2004-09-30.
BRANCH ENTERPRISES, LLC (900 SYCAMORE DR; small business)
$3,558 with Navy for Photographic Projection Equipment. Taking place in PA. Signed on 2004-09-20. Completion date: 2004-09-30.
Top industries in this zip code by the number of employees in 2005:
Accommodation and Food Services: Food Service Contractors (500-999 employees: 1 establishment, 1-4 employees: 1 establishment)
2002 - 2018 National Fire Incident Reporting System (NFIRS) incidents
According to the data from the years 2002 - 2018 the average number of fires per year is 106. The highest number of reported fires - 192 took place in 2008, and the least - 38 in 2002. The data has a rising trend.
When looking into fire subcategories, the most incidents belonged to: Outside Fires (65.8%), and Structure Fires (22.1%).
Fire incident types reported to NFIRS in Zip Code 76354


 Nearest zip codes: 73531, 73546, 76367, 76311, 76306, 76309.


 According to the data from the years 2002 - 2018 the average number of fires per year is 106. The highest number of reported fires - 192 took place in 2008, and the least - 38 in 2002. The data has a rising trend.
 When looking into fire subcategories, the most incidents belonged to: Outside Fires (65.8%), and Structure Fires (22.1%).