Estimated zip code population in 2022: 2,609 Zip code population in 2010: 3,502 Zip code population in 2000: 3,986
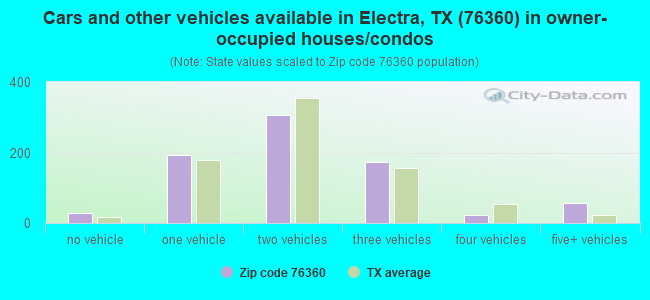
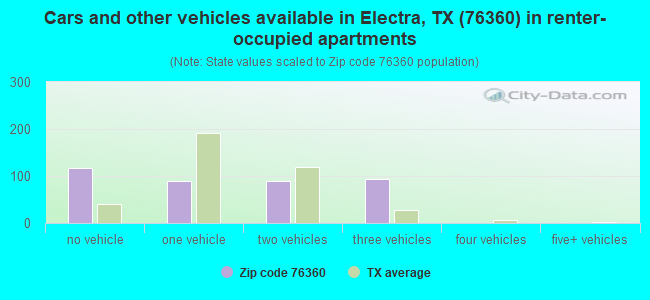
Houses and condos: 1,523 Renter-occupied apartments: 391
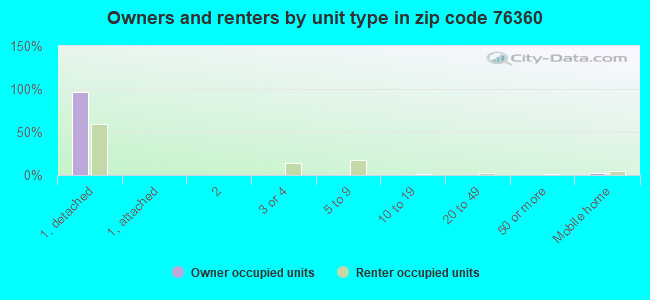
% of renters here:
33%
State:
38%
March 2022 cost of living index in zip code 76360: 80.7 (low, U.S. average is 100)
Land area: 284.3 sq. mi. Water area: 2.4 sq. mi.
Population density: 9 people per square mile
(very low).
OSM Map
General Map
Google Map
MSN Map
OSM Map
General Map
Google Map
MSN Map
OSM Map
General Map
Google Map
MSN Map
OSM Map
General Map
Google Map
MSN Map
Please wait while loading the map...
Real estate property taxes paid for housing units in 2022:
This zip code:
1.5% ($998)
Texas:
1.5% ($4,050)
Median real estate property taxes paid for housing units with mortgages in 2022: $2,223 (1.7%) Median real estate property taxes paid for housing units with no mortgage in 2022: $739 (1.3%)
Business Search- 14 Million verified businesses
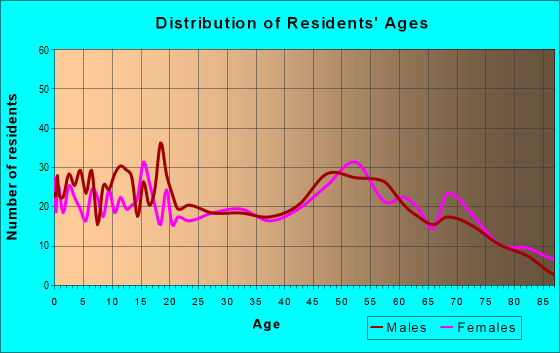
Males: 1,281
(49.1%)
Females: 1,327
(50.9%)
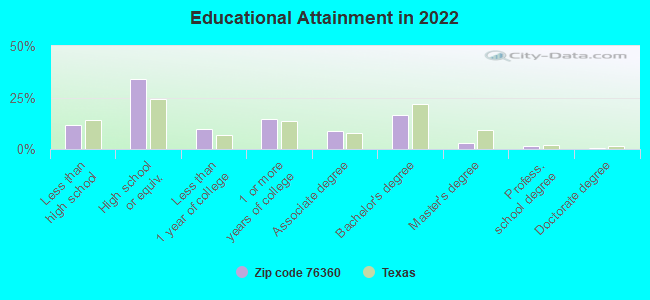
For population 25 years and over in 76360:
High school or higher: 87.5%
Bachelor's degree or higher: 21.3%
Graduate or professional degree: 5.0%
Unemployed: 4.1%
Mean travel time to work (commute): 17.8 minutes
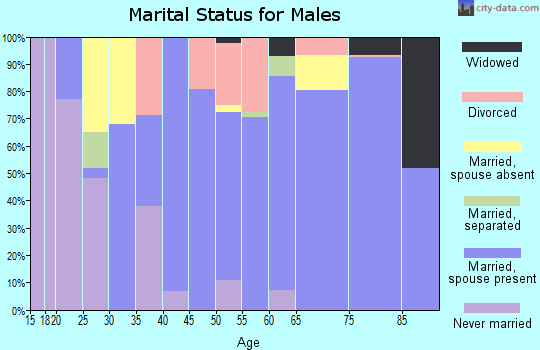
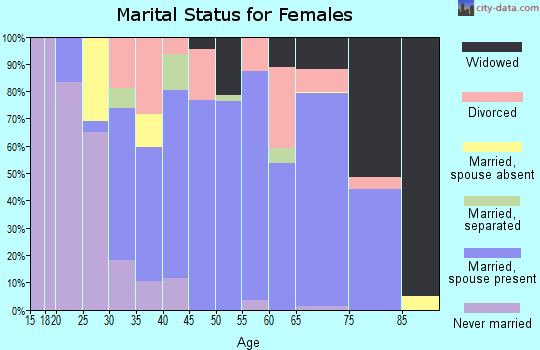
For population 15 years and over in 76360:
Never married: 22.5%
Now married: 49.5%
Separated: 1.7%
Widowed: 9.8%
Divorced: 16.3%
Zip code 76360 compared to state average:
Median house value significantly below state average.
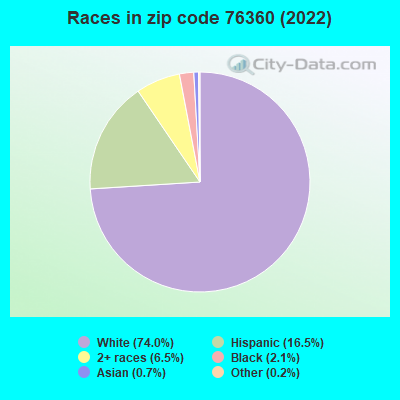
Black race population percentage significantly below state average.
Hispanic race population percentage below state average.
Median age above state average.
Foreign-born population percentage significantly below state average.
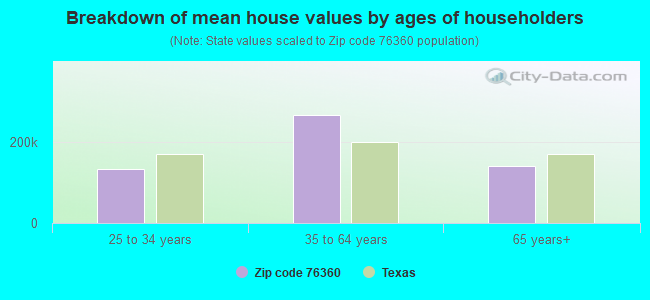
Estimated median house/condo value in 2022: $68,387
76360:
$68,387
Texas:
$275,400
According to our research of Texas and other state lists, there were 9 registered sex offenders living in 76360 zip code as of April 27, 2024. The ratio of all residents to sex offenders in zip code 76360 is 374 to 1. The ratio of registered sex offenders to all residents in this zip code is near the state average.
Median resident age:
This zip code:
43.5 years
Texas median age:
35.6 years
Average household size:
This zip code:
2.2 people
Texas:
2.6 people
Averages for the 2020 tax year for zip code 76360, filed in 2021:
Average Adjusted Gross Income (AGI) in 2020: $46,599 (Individual Income Tax Returns)
Here:
$46,599
State:
$77,054
Salary/wage: $42,109 (reported on 83.1% of returns)
Here:
$42,109
State:
$62,766
(% of AGI for various income ranges: 1198.1% for AGIs below $25k, 3662.8% for AGIs $25k-50k, 6548.5% for AGIs $50k-75k, 7884.3% for AGIs $75k-100k, 20500.0% for AGIs $100k-200k)
Taxable interest for individuals: $1,261 (reported on 19.5% of returns)
This zip code:
$1,261
Texas:
$2,665
(% of AGI for various income ranges: 22.5% for AGIs below $25k, 15.9% for AGIs $25k-50k, 14.6% for AGIs $50k-75k, 5.7% for AGIs $75k-100k, 233.3% for AGIs $100k-200k)
Ordinary dividends: $6,278 (reported on 7.6% of returns)
Here:
$6,278
State:
$10,044
(% of AGI for various income ranges: 13.3% for AGIs below $25k, 22.3% for AGIs $50k-75k, 813.3% for AGIs $100k-200k)
Net capital gain/loss in AGI: +$2,378 (reported on 7.6% of returns)
Here:
+$2,378
State:
+$39,590
(% of AGI for various income ranges: 20.7% for AGIs $25k-50k, 256.7% for AGIs $100k-200k)
Profit/loss from business: +$6,527 (reported on 12.7% of returns)
Here:
+$6,527
State:
+$10,888
(% of AGI for various income ranges: 77.5% for AGIs below $25k, 82.1% for AGIs $25k-50k, 163.1% for AGIs $50k-75k, 416.7% for AGIs $100k-200k)
Taxable individual retirement arrangement distribution: $14,767 (reported on 7.6% of returns)
76360:
$14,767
Texas:
$24,740
(% of AGI for various income ranges: 128.3% for AGIs $25k-50k, 280.8% for AGIs $50k-75k, 986.7% for AGIs $100k-200k)
Total itemized deductions: $42,900 (reported on 2.5% of returns)
Here:
$42,900
State:
$40,428
(% of AGI for various income ranges: 1838.6% for AGIs $75k-100k)
Taxes paid: $4,467 (reported on 2.5% of returns)
76360:
$4,467
State:
$7,821
(% of AGI for various income ranges: 46.2% for AGIs $25k-50k)
Earned income credit: $2,621 (reported on 24.6% of returns)
Here:
$2,621
State:
$2,584
(% of AGI for various income ranges: 142.5% for AGIs below $25k, 85.2% for AGIs $25k-50k)
Percentage of individuals using paid preparers for their 2020 taxes: 91.5%
Here:
92%
State:
92%
(% for various income ranges: 88.9% for AGIs below $25k, 94.3% for AGIs $25k-50k, 88.9% for AGIs $50k-75k, 100.0% for AGIs $75k-100k, 90.0% for AGIs $100k-200k, 100.0% for AGIs over 200k)
Averages for the 2012 tax year for zip code 76360, filed in 2013:
Average Adjusted Gross Income (AGI) in 2012: $43,873 (Individual Income Tax Returns)
Here:
$43,873
State:
$65,384
Salary/wage: $37,488 (reported on 83.7% of returns)
Here:
$37,488
State:
$52,524
(% of AGI for various income ranges: 76.1% for AGIs below $25k, 80.6% for AGIs $25k-50k, 81.3% for AGIs $50k-75k, 77.3% for AGIs $75k-100k, 53.2% for AGIs $100k-200k)
Taxable interest for individuals: $1,036 (reported on 24.4% of returns)
This zip code:
$1,036
Texas:
$2,372
(% of AGI for various income ranges: 1.2% for AGIs below $25k, 0.3% for AGIs $25k-50k, 0.3% for AGIs $50k-75k, 0.5% for AGIs $75k-100k, 0.7% for AGIs $100k-200k)
Ordinary dividends: $4,946 (reported on 9.6% of returns)
Here:
$4,946
State:
$9,721
(% of AGI for various income ranges: 1.9% for AGIs below $25k, 1.5% for AGIs $25k-50k, 0.5% for AGIs $50k-75k, 1.4% for AGIs $100k-200k)
Net capital gain/loss in AGI: +$1,100 (reported on 8.9% of returns)
Here:
+$1,100
State:
+$35,319
(% of AGI for various income ranges: 0.6% for AGIs $25k-50k, 0.2% for AGIs $50k-75k, 0.2% for AGIs $100k-200k)
Profit/loss from business: +$7,284 (reported on 14.1% of returns)
Here:
+$7,284
State:
+$13,732
(% of AGI for various income ranges: 4.4% for AGIs below $25k, 4.3% for AGIs $25k-50k, 3.5% for AGIs $50k-75k, 0.4% for AGIs $100k-200k)
Taxable individual retirement arrangement distribution: $10,146 (reported on 9.6% of returns)
76360:
$10,146
Texas:
$19,511
(% of AGI for various income ranges: 4.8% for AGIs below $25k, 1.2% for AGIs $25k-50k, 1.9% for AGIs $50k-75k, 6.7% for AGIs $75k-100k)
Total itemized deductions: $21,057 (23% of AGI, reported on 10.4% of returns)
Here:
$21,057
State:
$24,724
Here:
22.6% of AGI
State:
15.9% of AGI
(% of AGI for various income ranges: 6.2% for AGIs $25k-50k, 7.2% for AGIs $50k-75k, 6.9% for AGIs $100k-200k)
Charity contributions: $5,267 (reported on 6.7% of returns)
Here:
$5,267
State:
$6,808
(% of AGI for various income ranges: 1.7% for AGIs below $25k, 1.3% for AGIs $50k-75k, 1.0% for AGIs $100k-200k)
Taxes paid: $3,192 (reported on 9.6% of returns)
76360:
$3,192
State:
$6,921
(% of AGI for various income ranges: 0.7% for AGIs $25k-50k, 1.0% for AGIs $50k-75k, 1.1% for AGIs $100k-200k)
Earned income credit: $2,274 (reported on 23.0% of returns)
Here:
$2,274
State:
$2,570
(% of AGI for various income ranges: 8.0% for AGIs below $25k, 1.2% for AGIs $25k-50k)
Percentage of individuals using paid preparers for their 2012 taxes: 48.1%
Here:
48%
State:
51%
(% for various income ranges: 41.4% for AGIs below $25k, 50.0% for AGIs $25k-50k, 54.5% for AGIs $50k-75k, 50.0% for AGIs $75k-100k, 63.6% for AGIs $100k-200k)
Averages for the 2004 tax year for zip code 76360, filed in 2005:
Average Adjusted Gross Income (AGI) in 2004: $31,621 (Individual Income Tax Returns)
Here:
$31,621
State:
$47,881
Salary/wage: $28,659 (reported on 84.6% of returns)
Here:
$28,659
State:
$41,947
(% of AGI for various income ranges: 92.9% for AGIs below $10k, 78.7% for AGIs $10k-25k, 85.9% for AGIs $25k-50k, 81.9% for AGIs $50k-75k, 73.8% for AGIs $75k-100k, 48.4% for AGIs over 100k)
Taxable interest for individuals: $1,791 (reported on 32.4% of returns)
This zip code:
$1,791
Texas:
$2,255
(% of AGI for various income ranges: 9.5% for AGIs below $10k, 1.9% for AGIs $10k-25k, 1.6% for AGIs $25k-50k, 1.1% for AGIs $50k-75k, 0.8% for AGIs $75k-100k, 2.3% for AGIs over 100k)
Taxable dividends: $4,117 (reported on 11.8% of returns)
Here:
$4,117
State:
$4,261
(% of AGI for various income ranges: 1.4% for AGIs below $10k, 0.9% for AGIs $10k-25k, 0.7% for AGIs $25k-50k, 1.3% for AGIs $50k-75k, 0.6% for AGIs $75k-100k, 4.6% for AGIs over 100k)
Net capital gain/loss: +$6,291 (reported on 10.2% of returns)
Here:
+$6,291
State:
+$16,110
(% of AGI for various income ranges: -0.5% for AGIs below $10k, -0.1% for AGIs $10k-25k, 0.4% for AGIs $25k-50k, 0.8% for AGIs $50k-75k, 0.5% for AGIs $75k-100k, 10.5% for AGIs over 100k)
Profit/loss from business: +$6,995 (reported on 14.6% of returns)
Here:
+$6,995
State:
+$11,013
(% of AGI for various income ranges: 8.9% for AGIs below $10k, 5.6% for AGIs $10k-25k, 2.8% for AGIs $25k-50k, 0.8% for AGIs $50k-75k, -0.1% for AGIs $75k-100k, 6.3% for AGIs over 100k)
IRA payment deduction: $2,207 (reported on 2.0% of returns)
76360:
$2,207
Texas:
$3,120
Total itemized deductions: $16,598 (28% of AGI, reported on 8.4% of returns)
Here:
$16,598
State:
$19,631
Here:
27.6% of AGI
State:
18.9% of AGI
(% of AGI for various income ranges: 6.6% for AGIs $10k-25k, 3.6% for AGIs $25k-50k, 4.4% for AGIs $50k-75k, 4.1% for AGIs $75k-100k, 5.0% for AGIs over 100k)
Charity contributions deductions: $4,188 (6% of AGI, reported on 6.6% of returns)
Here:
$4,188
State:
$4,753
Here:
6.5% of AGI
State:
4.2% of AGI
(% of AGI for various income ranges: 0.5% for AGIs $10k-25k, 0.7% for AGIs $25k-50k, 1.4% for AGIs $50k-75k, 1.5% for AGIs over 100k)
Total tax: $4,206 (reported on 65.9% of returns)
76360:
$4,206
State:
$9,058
(% of AGI for various income ranges: 3.0% for AGIs below $10k, 3.7% for AGIs $10k-25k, 5.6% for AGIs $25k-50k, 9.0% for AGIs $50k-75k, 11.8% for AGIs $75k-100k, 18.2% for AGIs over 100k)
Earned income credit: $1,843 (reported on 23.7% of returns)
Here:
$1,843
State:
$2,024
Percentage of individuals using paid preparers for their 2004 taxes: 57.5%
Here:
58%
State:
57%
(% for various income ranges: 50.0% for AGIs below $10k, 63.1% for AGIs $10k-25k, 55.3% for AGIs $25k-50k, 58.1% for AGIs $50k-75k, 62.5% for AGIs $75k-100k, 78.0% for AGIs over 100k)
Household received Food Stamps/SNAP in the past 12 months: 179 Household did not receive Food Stamps/SNAP in the past 12 months: 993
Women who had a birth in the past 12 months: 49 (50 now married, 0 unmarried) Women who did not have a birth in the past 12 months: 506 (181 now married, 326 unmarried)
Housing units in zip code 76360 with a mortgage: 259 (20 second mortgage, 22 both second mortgage and home equity loan) Median monthly owner costs for units with a mortgage: $1,397 Median monthly owner costs for units without a mortgage: $448
Residents with income below the poverty level in 2022:
This zip code:
19.1%
Whole state:
14.0%
Residents with income below 50% of the poverty level in 2022:
This zip code:
9.3%
Whole state:
7.4%
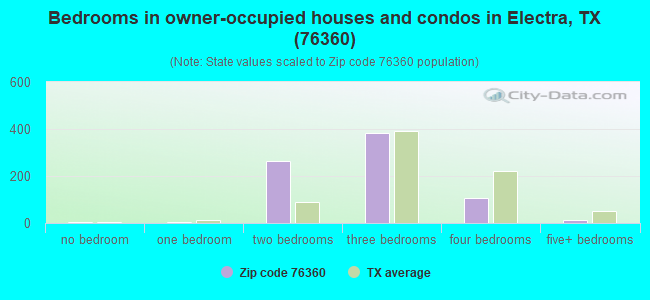
Median number of rooms in houses and condos:
Here:
5.9
State:
6.3
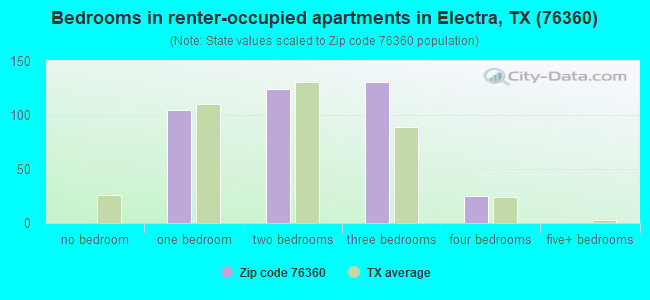
Median number of rooms in apartments:
Here:
5.0
State:
4.0
Notable locations in this zip code not listed on our city pages
Reservoirs: Four Corners Cow Camp Lake (A), Coffee Creek Cow Camp Lake (B), Santa Rosa Lake (C), South Parker Tank (D). Display/hide their locations on the map
In group quarters: 29 (-1 institutionalized population)
Size of family households: 338 2-persons, 85 3-persons, 83 4-persons, 25 5-persons, 41 6-persons, 5 7-or-more-persons
Size of nonfamily households: 471 1-person, 96 2-persons, 28 5-persons
484 married couples with children.
21 single-parent households (11 men, 10 women).
93.9% of residents of 76360 zip code speak English at home.
5.3% of residents speak Spanish at home (97% very well, 3% not well).
0.7% of residents speak other Indo-European language at home (71% very well, 29% not well).
0.1% of residents speak other language at home (100% very well).
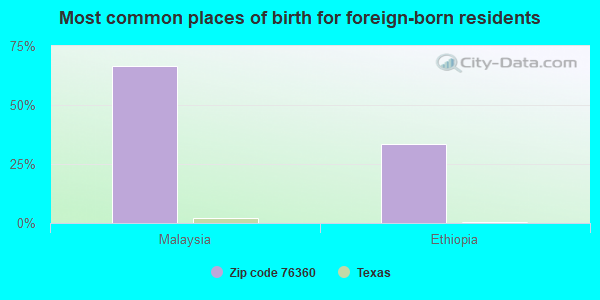
Foreign born population: 9 (0.4%) (35.7% of them are naturalized citizens)
This zip code:
0.4%
Whole state:
17.2%
67%Malaysia
33%Ethiopia
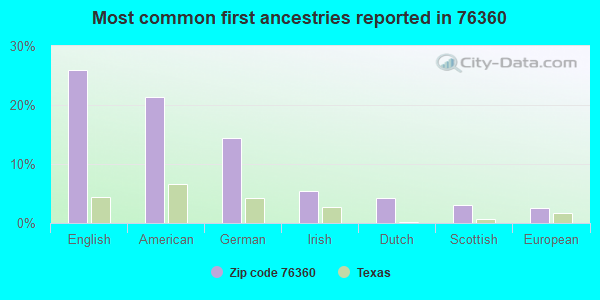
26%English
21%American
14%German
5%Irish
4%Dutch
3%Scottish
3%European
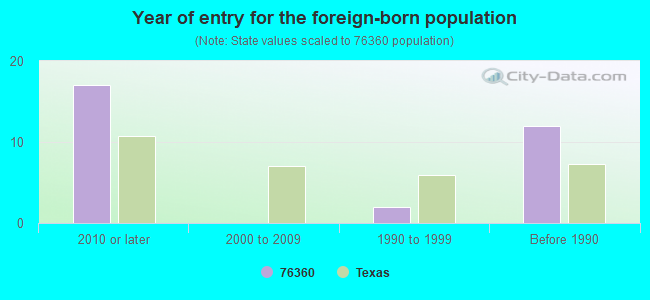
Year of entry for the foreign-born population
172010 or later
02000 to 2009
21990 to 1999
12Before 1990
Housing units lacking complete plumbing facilities: 18.4% Housing units lacking complete kitchen facilities: 12.1%
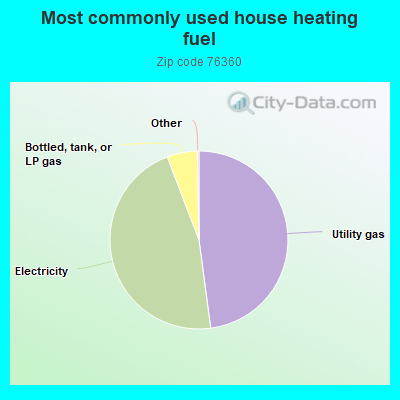
47.9%Utility gas
46.3%Electricity
5.5%Bottled, tank, or LP gas
Population in 1990: 3,580. Population change in the 1990s: +406 (+11.3%).
Place of birth for U.S.-born residents:
This state: 2,062
Northeast: 36
Midwest: 75
South: 268
West: 117
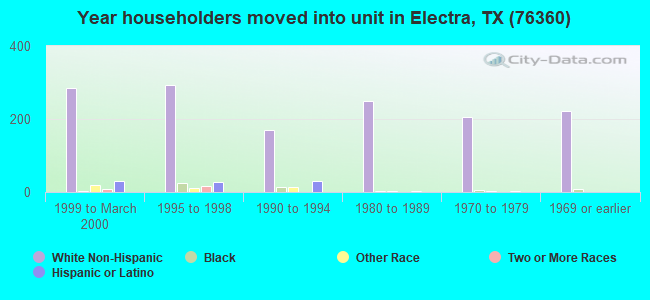
59% of the 76360 zip code residents lived in the same house 5 years ago. Out of people who lived in different houses, 56% lived in this county. Out of people who lived in different counties, 50% lived in Texas.
87% of the 76360 zip code residents lived in the same house 1 year ago. Out of people who lived in different houses, 56% moved from this county. Out of people who lived in different houses, 33% moved from different county within same state. Out of people who lived in different houses, 9% moved from abroad.
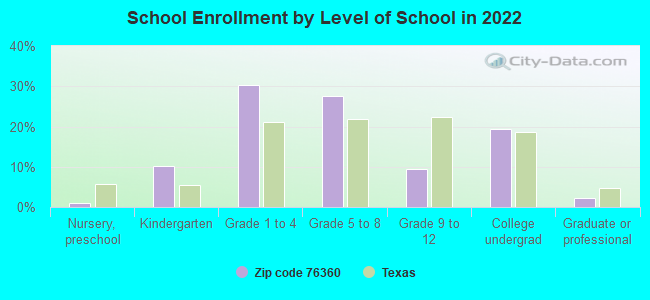
Private vs. public school enrollment:
Students in private schools in grades 1 to 8 (elementary and middle school): 39
Here:
12.2%
Texas:
8.8%
Students in private schools in grades 9 to 12 (high school): 18
Here:
34.8%
Texas:
8.0%
Students in private undergraduate colleges: 6
Here:
6.3%
Texas:
16.2%
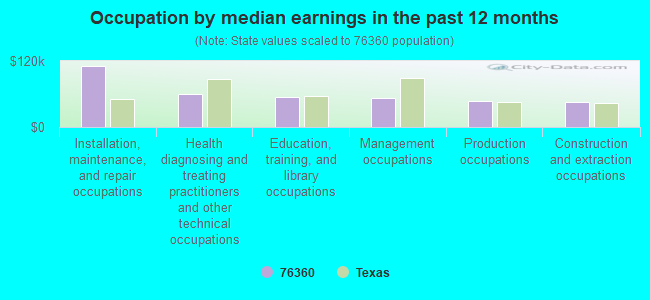
Occupation by median earnings in the past 12 months ($)
110,535Installation, maintenance, and repair occupations
60,231Health diagnosing and treating practitioners and other technical occupations
55,105Education, training, and library occupations
53,049Management occupations
48,038Production occupations
46,264Construction and extraction occupations
Companies with federal contracts located in this zip code:
PELPLE SENSE COUNSELING (214 N MAIN ST in ELECTRA, TX) : $24,768 in 2 contractsfrom 2005 to 2006
$16,000 with Army for Lectures For Training. Taking place in VA. Signed on 2005-03-04. Completion date: 2005-08-18.
$8,768 with Army for Educational Services. Taking place in VA. Signed on 2006-06-27. Completion date: 2006-03-17.
Top industries in this zip code by the number of employees in 2005:
Health Care and Social Assistance: General Medical and Surgical Hospitals (100-249 employees: 1 establishment)
Mining: Support Activities for Oil and Gas Operations (20-49: 1, 10-19: 2, 5-9: 3, 1-4: 2)
Health Care and Social Assistance: Nursing Care Facilities (50-99: 1)
Mining: Drilling Oil and Gas Wells (20-49: 1, 5-9: 1)
Accommodation and Food Services: Limited-Service Restaurants (20-49: 1, 1-4: 3)
Professional, Scientific, and Technical Services: Engineering Services (20-49: 1)
People in group quarters in 2010:
30 people in nursing facilities/skilled-nursing facilities
People in group quarters in 2000:
27 people in nursing homes
Home Mortgage Disclosure Act Aggregated Statistics For Year 2009 (Based on 1 full and 2 partial tracts)
A) FHA, FSA/RHS & VA Home Purchase Loans
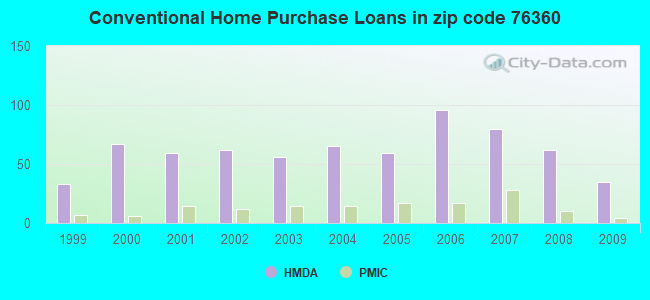
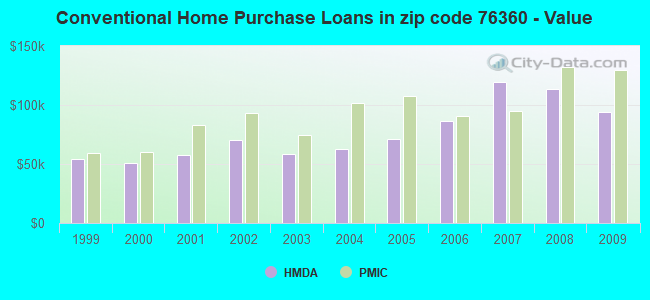
B) Conventional Home Purchase Loans
C) Refinancings
D) Home Improvement Loans
F) Non-occupant Loans on < 5 Family Dwellings (A B C & D)
G) Loans On Manufactured Home Dwelling (A B C & D)
Number
Average Value
Number
Average Value
Number
Average Value
Number
Average Value
Number
Average Value
Number
Average Value
LOANS ORIGINATED
29
$128,561
35
$94,156
79
$110,814
9
$30,736
18
$65,989
8
$52,978
APPLICATIONS APPROVED, NOT ACCEPTED
0
$0
1
$45,000
5
$119,856
0
$0
0
$0
1
$45,000
APPLICATIONS DENIED
0
$0
5
$135,328
24
$106,090
4
$16,725
0
$0
4
$59,382
APPLICATIONS WITHDRAWN
2
$113,320
1
$29,420
8
$109,315
1
$30,000
1
$165,620
1
$29,420
FILES CLOSED FOR INCOMPLETENESS
0
$0
1
$195,040
2
$109,505
0
$0
0
$0
1
$114,410
Aggregated Statistics For Year 2008 (Based on 1 full and 2 partial tracts)
A) FHA, FSA/RHS & VA Home Purchase Loans
B) Conventional Home Purchase Loans
C) Refinancings
D) Home Improvement Loans
F) Non-occupant Loans on < 5 Family Dwellings (A B C & D)
G) Loans On Manufactured Home Dwelling (A B C & D)
Number
Average Value
Number
Average Value
Number
Average Value
Number
Average Value
Number
Average Value
Number
Average Value
LOANS ORIGINATED
30
$101,196
62
$113,723
45
$106,568
14
$25,808
13
$52,842
10
$67,664
APPLICATIONS APPROVED, NOT ACCEPTED
0
$0
5
$94,578
5
$157,694
2
$66,020
0
$0
4
$69,462
APPLICATIONS DENIED
4
$120,032
6
$141,565
31
$85,630
17
$28,838
1
$37,000
8
$52,981
APPLICATIONS WITHDRAWN
4
$109,385
2
$112,230
12
$77,641
1
$32,690
1
$40,000
1
$68,000
FILES CLOSED FOR INCOMPLETENESS
0
$0
0
$0
0
$0
2
$56,660
0
$0
0
$0
Aggregated Statistics For Year 2007 (Based on 1 full and 2 partial tracts)
A) FHA, FSA/RHS & VA Home Purchase Loans
B) Conventional Home Purchase Loans
C) Refinancings
D) Home Improvement Loans
F) Non-occupant Loans on < 5 Family Dwellings (A B C & D)
G) Loans On Manufactured Home Dwelling (A B C & D)
Number
Average Value
Number
Average Value
Number
Average Value
Number
Average Value
Number
Average Value
Number
Average Value
LOANS ORIGINATED
23
$116,220
80
$119,633
53
$65,985
18
$38,179
34
$125,835
8
$52,399
APPLICATIONS APPROVED, NOT ACCEPTED
3
$65,740
8
$102,565
3
$112,600
3
$13,173
0
$0
0
$0
APPLICATIONS DENIED
6
$93,085
20
$60,086
46
$89,614
31
$37,395
4
$27,962
14
$67,008
APPLICATIONS WITHDRAWN
0
$0
8
$77,089
22
$107,505
1
$58,840
1
$81,720
0
$0
FILES CLOSED FOR INCOMPLETENESS
1
$84,000
1
$155,810
3
$82,340
0
$0
0
$0
0
$0
Aggregated Statistics For Year 2006 (Based on 1 full and 2 partial tracts)
A) FHA, FSA/RHS & VA Home Purchase Loans
B) Conventional Home Purchase Loans
C) Refinancings
D) Home Improvement Loans
F) Non-occupant Loans on < 5 Family Dwellings (A B C & D)
G) Loans On Manufactured Home Dwelling (A B C & D)
Number
Average Value
Number
Average Value
Number
Average Value
Number
Average Value
Number
Average Value
Number
Average Value
LOANS ORIGINATED
18
$117,417
96
$86,053
42
$92,633
15
$32,401
20
$60,774
9
$59,564
APPLICATIONS APPROVED, NOT ACCEPTED
0
$0
6
$62,467
4
$98,372
2
$20,160
0
$0
2
$63,740
APPLICATIONS DENIED
3
$131,617
12
$65,010
48
$74,756
40
$28,778
6
$31,833
9
$59,870
APPLICATIONS WITHDRAWN
1
$153,630
7
$88,216
32
$88,084
4
$25,278
2
$61,015
3
$78,087
FILES CLOSED FOR INCOMPLETENESS
0
$0
1
$82,810
10
$85,220
0
$0
0
$0
0
$0
Aggregated Statistics For Year 2005 (Based on 1 full and 2 partial tracts)
A) FHA, FSA/RHS & VA Home Purchase Loans
B) Conventional Home Purchase Loans
C) Refinancings
D) Home Improvement Loans
F) Non-occupant Loans on < 5 Family Dwellings (A B C & D)
G) Loans On Manufactured Home Dwelling (A B C & D)
Number
Average Value
Number
Average Value
Number
Average Value
Number
Average Value
Number
Average Value
Number
Average Value
LOANS ORIGINATED
25
$104,474
59
$71,090
45
$85,187
12
$38,717
16
$38,584
6
$70,465
APPLICATIONS APPROVED, NOT ACCEPTED
0
$0
15
$69,779
8
$55,746
2
$32,150
1
$40,000
5
$70,172
APPLICATIONS DENIED
1
$84,990
10
$61,998
59
$73,533
34
$32,149
1
$30,000
9
$46,222
APPLICATIONS WITHDRAWN
0
$0
6
$48,582
25
$106,394
10
$170,015
5
$34,648
0
$0
FILES CLOSED FOR INCOMPLETENESS
1
$57,000
1
$127,480
15
$112,083
3
$51,320
1
$113,320
0
$0
Aggregated Statistics For Year 2004 (Based on 1 full and 2 partial tracts)
A) FHA, FSA/RHS & VA Home Purchase Loans
B) Conventional Home Purchase Loans
C) Refinancings
D) Home Improvement Loans
F) Non-occupant Loans on < 5 Family Dwellings (A B C & D)
G) Loans On Manufactured Home Dwelling (A B C & D)
Number
Average Value
Number
Average Value
Number
Average Value
Number
Average Value
Number
Average Value
Number
Average Value
LOANS ORIGINATED
23
$86,783
65
$62,408
75
$62,229
19
$23,787
25
$24,461
5
$72,350
APPLICATIONS APPROVED, NOT ACCEPTED
1
$34,000
9
$67,302
14
$60,266
3
$27,967
1
$35,960
4
$50,395
APPLICATIONS DENIED
1
$68,000
31
$73,463
57
$59,884
21
$19,172
7
$25,634
13
$38,605
APPLICATIONS WITHDRAWN
1
$98,060
3
$134,747
49
$67,370
8
$25,654
3
$13,263
1
$98,060
FILES CLOSED FOR INCOMPLETENESS
0
$0
4
$43,585
14
$101,251
1
$46,850
0
$0
0
$0
Aggregated Statistics For Year 2003 (Based on 1 full and 2 partial tracts)
A) FHA, FSA/RHS & VA Home Purchase Loans
B) Conventional Home Purchase Loans
C) Refinancings
D) Home Improvement Loans
F) Non-occupant Loans on < 5 Family Dwellings (A B C & D)
Number
Average Value
Number
Average Value
Number
Average Value
Number
Average Value
Number
Average Value
LOANS ORIGINATED
18
$85,982
56
$58,795
114
$76,294
15
$25,085
17
$23,706
APPLICATIONS APPROVED, NOT ACCEPTED
2
$71,370
0
$0
9
$67,659
3
$44,757
0
$0
APPLICATIONS DENIED
2
$62,650
13
$67,874
67
$65,621
19
$10,796
0
$0
APPLICATIONS WITHDRAWN
3
$145,643
8
$62,246
31
$65,300
2
$13,895
1
$91,530
FILES CLOSED FOR INCOMPLETENESS
0
$0
2
$75,980
4
$66,738
0
$0
0
$0
Aggregated Statistics For Year 2002 (Based on 1 full and 2 partial tracts)
A) FHA, FSA/RHS & VA Home Purchase Loans
B) Conventional Home Purchase Loans
C) Refinancings
D) Home Improvement Loans
F) Non-occupant Loans on < 5 Family Dwellings (A B C & D)
Number
Average Value
Number
Average Value
Number
Average Value
Number
Average Value
Number
Average Value
LOANS ORIGINATED
15
$79,559
62
$70,014
67
$65,074
11
$18,774
8
$43,126
APPLICATIONS APPROVED, NOT ACCEPTED
1
$63,200
4
$70,372
11
$66,355
10
$13,075
0
$0
APPLICATIONS DENIED
3
$54,273
20
$48,100
31
$50,685
14
$10,970
1
$3,270
APPLICATIONS WITHDRAWN
0
$0
1
$74,090
29
$61,736
1
$6,540
0
$0
FILES CLOSED FOR INCOMPLETENESS
0
$0
3
$44,697
3
$51,893
0
$0
0
$0
Aggregated Statistics For Year 2001 (Based on 1 full and 2 partial tracts)
A) FHA, FSA/RHS & VA Home Purchase Loans
B) Conventional Home Purchase Loans
C) Refinancings
D) Home Improvement Loans
F) Non-occupant Loans on < 5 Family Dwellings (A B C & D)
Number
Average Value
Number
Average Value
Number
Average Value
Number
Average Value
Number
Average Value
LOANS ORIGINATED
18
$76,976
59
$57,743
48
$70,718
24
$15,242
12
$24,862
APPLICATIONS APPROVED, NOT ACCEPTED
0
$0
6
$47,077
13
$45,151
0
$0
1
$5,000
APPLICATIONS DENIED
2
$95,340
20
$52,278
30
$48,340
15
$14,617
1
$19,000
APPLICATIONS WITHDRAWN
0
$0
3
$64,780
11
$44,529
1
$12,000
1
$16,000
FILES CLOSED FOR INCOMPLETENESS
0
$0
0
$0
2
$56,660
0
$0
0
$0
Aggregated Statistics For Year 2000 (Based on 1 full and 2 partial tracts)
A) FHA, FSA/RHS & VA Home Purchase Loans
B) Conventional Home Purchase Loans
C) Refinancings
D) Home Improvement Loans
E) Loans on Dwellings For 5+ Families
F) Non-occupant Loans on < 5 Family Dwellings (A B C & D)
Number
Average Value
Number
Average Value
Number
Average Value
Number
Average Value
Number
Average Value
Number
Average Value
LOANS ORIGINATED
9
$55,990
67
$50,430
26
$45,641
13
$22,318
1
$108,960
12
$15,615
APPLICATIONS APPROVED, NOT ACCEPTED
1
$59,930
11
$36,365
7
$49,119
1
$14,160
0
$0
0
$0
APPLICATIONS DENIED
0
$0
21
$53,739
14
$53,642
7
$8,930
0
$0
2
$8,500
APPLICATIONS WITHDRAWN
1
$96,970
5
$99,870
14
$40,882
0
$0
0
$0
0
$0
FILES CLOSED FOR INCOMPLETENESS
0
$0
3
$71,610
3
$51,937
0
$0
0
$0
0
$0
Aggregated Statistics For Year 1999 (Based on 1 full and 1 partial tracts)
A) FHA, FSA/RHS & VA Home Purchase Loans
B) Conventional Home Purchase Loans
C) Refinancings
D) Home Improvement Loans
F) Non-occupant Loans on < 5 Family Dwellings (A B C & D)
Detailed PMIC statistics for the following Tracts:0137.00
, 0138.00
2004 - 2018 National Fire Incident Reporting System (NFIRS) incidents
According to the data from the years 2004 - 2018 the average number of fires per year is 27. The highest number of reported fires - 106 took place in 2018, and the least - 0 in 2006. The data has a rising trend.
When looking into fire subcategories, the most incidents belonged to: Outside Fires (78.4%), and Structure Fires (12.1%).
Fire incident types reported to NFIRS in Zip Code 76360


 Nearest zip codes: 76364, 76373, 76367, 73530, 76366, 73546.
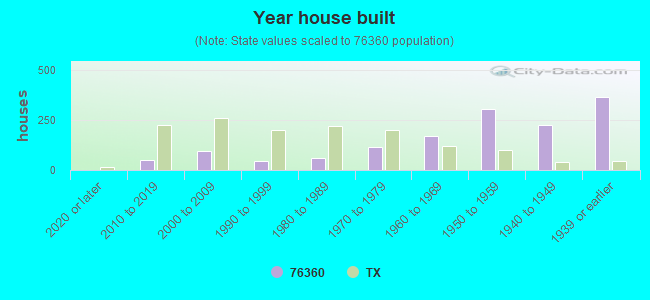


 : $24,768 in 2 contracts from 2005 to 2006
 According to the data from the years 2004 - 2018 the average number of fires per year is 27. The highest number of reported fires - 106 took place in 2018, and the least - 0 in 2006. The data has a rising trend.
 When looking into fire subcategories, the most incidents belonged to: Outside Fires (78.4%), and Structure Fires (12.1%).