Estimated zip code population in 2022: 8,089 Zip code population in 2010: 8,413 Zip code population in 2000: 8,458
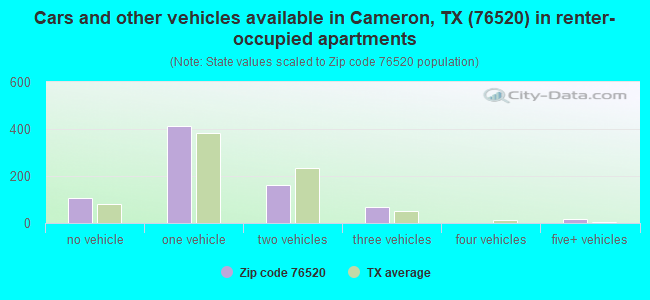
Houses and condos: 3,389 Renter-occupied apartments: 765
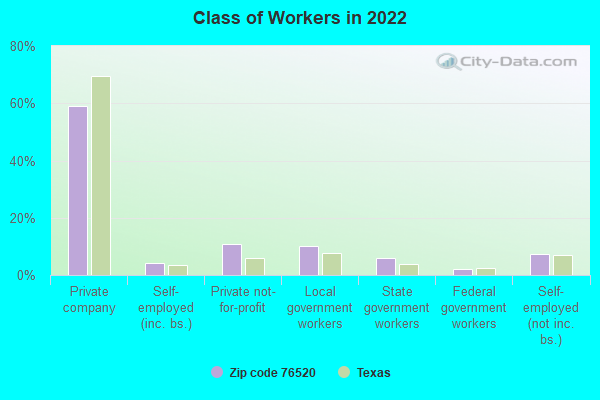
% of renters here:
27%
State:
38%
March 2022 cost of living index in zip code 76520: 77.5 (low, U.S. average is 100)
Land area: 301.3 sq. mi. Water area: 1.0 sq. mi.
Population density: 27 people per square mile
(very low).
OSM Map
General Map
Google Map
MSN Map
OSM Map
General Map
Google Map
MSN Map
OSM Map
General Map
Google Map
MSN Map
OSM Map
General Map
Google Map
MSN Map
Please wait while loading the map...
Real estate property taxes paid for housing units in 2022:
This zip code:
1.1% ($1,791)
Texas:
1.5% ($4,050)
Median real estate property taxes paid for housing units with mortgages in 2022: $1,863 (1.3%) Median real estate property taxes paid for housing units with no mortgage in 2022: $1,710 (1.0%)
Business Search- 14 Million verified businesses
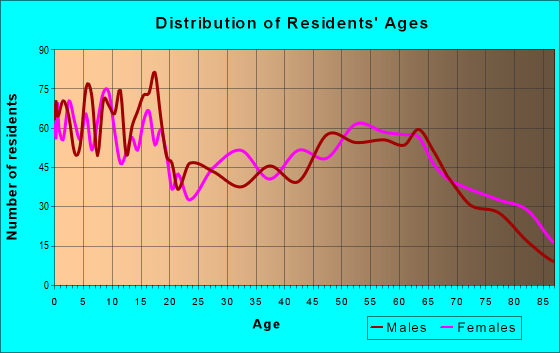
Males: 4,016
(49.6%)
Females: 4,073
(50.4%)
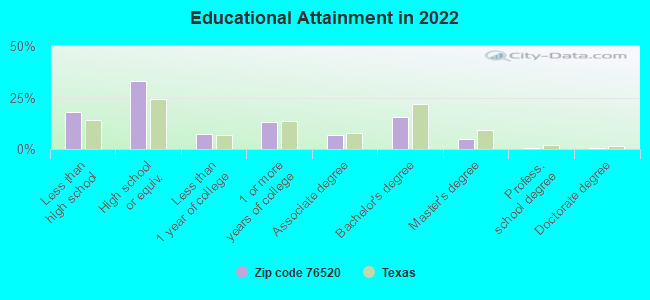
For population 25 years and over in 76520:
High school or higher: 80.8%
Bachelor's degree or higher: 21.1%
Graduate or professional degree: 5.6%
Unemployed: 8.0%
Mean travel time to work (commute): 25.2 minutes
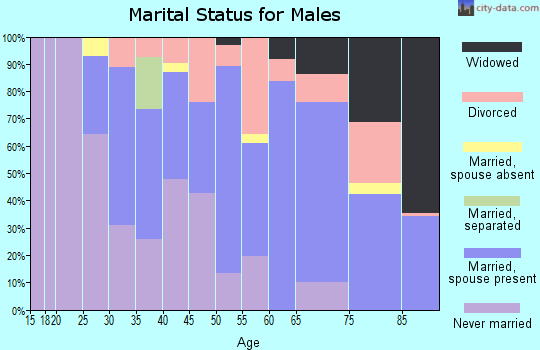
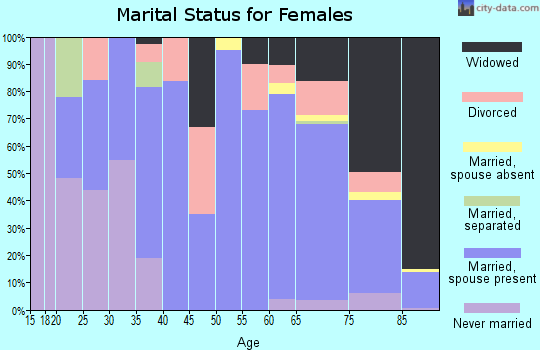
For population 15 years and over in 76520:
Never married: 26.4%
Now married: 51.9%
Separated: 1.4%
Widowed: 6.6%
Divorced: 13.7%
Zip code 76520 compared to state average:
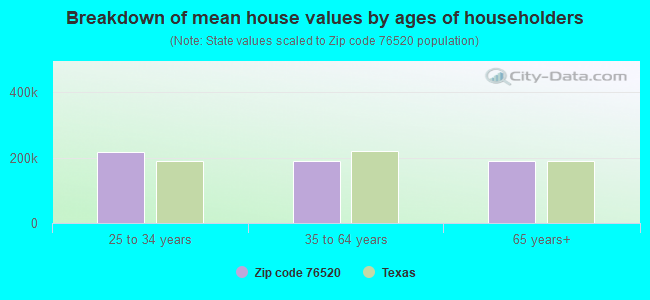
Median house value below state average.
Unemployed percentage above state average.
Foreign-born population percentage below state average.
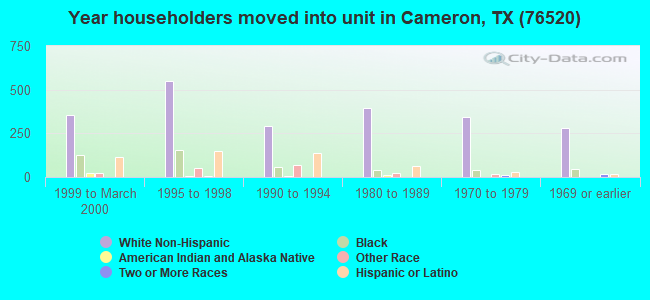
Length of stay since moving in significantly above state average.
Percentage of population with a bachelor's degree or higher below state average.
Averages for the 2020 tax year for zip code 76520, filed in 2021:
Average Adjusted Gross Income (AGI) in 2020: $51,923 (Individual Income Tax Returns)
Here:
$51,923
State:
$77,054
Salary/wage: $42,820 (reported on 79.5% of returns)
Here:
$42,820
State:
$62,766
(% of AGI for various income ranges: 1222.2% for AGIs below $25k, 3555.9% for AGIs $25k-50k, 6752.3% for AGIs $50k-75k, 9141.9% for AGIs $75k-100k, 15727.9% for AGIs $100k-200k)
Taxable interest for individuals: $1,206 (reported on 24.6% of returns)
This zip code:
$1,206
Texas:
$2,665
(% of AGI for various income ranges: 10.5% for AGIs below $25k, 20.0% for AGIs $25k-50k, 60.4% for AGIs $50k-75k, 76.2% for AGIs $75k-100k, 71.1% for AGIs $100k-200k)
Ordinary dividends: $5,094 (reported on 13.6% of returns)
Here:
$5,094
State:
$10,044
(% of AGI for various income ranges: 16.9% for AGIs below $25k, 31.2% for AGIs $25k-50k, 131.2% for AGIs $50k-75k, 95.7% for AGIs $75k-100k, 235.3% for AGIs $100k-200k)
Net capital gain/loss in AGI: +$27,967 (reported on 12.4% of returns)
Here:
+$27,967
State:
+$39,590
(% of AGI for various income ranges: 18.4% for AGIs below $25k, 50.7% for AGIs $25k-50k, 119.2% for AGIs $50k-75k, 193.8% for AGIs $75k-100k, 592.6% for AGIs $100k-200k)
Profit/loss from business: +$11,435 (reported on 16.5% of returns)
Here:
+$11,435
State:
+$10,888
(% of AGI for various income ranges: 145.4% for AGIs below $25k, 142.6% for AGIs $25k-50k, 408.5% for AGIs $50k-75k, 208.1% for AGIs $75k-100k, 1321.1% for AGIs $100k-200k)
Taxable individual retirement arrangement distribution: $20,452 (reported on 7.2% of returns)
76520:
$20,452
Texas:
$24,740
(% of AGI for various income ranges: 38.8% for AGIs below $25k, 60.8% for AGIs $25k-50k, 175.8% for AGIs $50k-75k, 471.9% for AGIs $75k-100k, 1485.8% for AGIs $100k-200k)
Total itemized deductions: $34,189 (reported on 2.6% of returns)
Here:
$34,189
State:
$40,428
(% of AGI for various income ranges: 368.8% for AGIs $50k-75k, 563.7% for AGIs $100k-200k)
Charity contributions: $21,880 (reported on 1.4% of returns)
Here:
$21,880
State:
$18,201
(% of AGI for various income ranges: 287.9% for AGIs $100k-200k)
Taxes paid: $5,925 (reported on 2.3% of returns)
76520:
$5,925
State:
$7,821
(% of AGI for various income ranges: 45.4% for AGIs $50k-75k, 92.1% for AGIs $100k-200k)
Earned income credit: $2,613 (reported on 25.1% of returns)
Here:
$2,613
State:
$2,584
(% of AGI for various income ranges: 154.3% for AGIs below $25k, 100.1% for AGIs $25k-50k)
Percentage of individuals using paid preparers for their 2020 taxes: 93.6%
Here:
94%
State:
92%
(% for various income ranges: 92.9% for AGIs below $25k, 93.8% for AGIs $25k-50k, 92.7% for AGIs $50k-75k, 93.3% for AGIs $75k-100k, 96.9% for AGIs $100k-200k, 100.0% for AGIs over 200k)
Averages for the 2012 tax year for zip code 76520, filed in 2013:
Average Adjusted Gross Income (AGI) in 2012: $42,435 (Individual Income Tax Returns)
Here:
$42,435
State:
$65,384
Salary/wage: $34,757 (reported on 82.0% of returns)
Here:
$34,757
State:
$52,524
(% of AGI for various income ranges: 78.8% for AGIs below $25k, 79.8% for AGIs $25k-50k, 76.3% for AGIs $50k-75k, 72.6% for AGIs $75k-100k, 67.0% for AGIs $100k-200k, 21.8% for AGIs over 200k)
Taxable interest for individuals: $1,278 (reported on 27.8% of returns)
This zip code:
$1,278
Texas:
$2,372
(% of AGI for various income ranges: 1.5% for AGIs below $25k, 0.8% for AGIs $25k-50k, 0.8% for AGIs $50k-75k, 0.6% for AGIs $75k-100k, 0.5% for AGIs $100k-200k, 1.0% for AGIs over 200k)
Ordinary dividends: $3,588 (reported on 14.7% of returns)
Here:
$3,588
State:
$9,721
(% of AGI for various income ranges: 1.0% for AGIs below $25k, 1.0% for AGIs $25k-50k, 0.7% for AGIs $50k-75k, 1.3% for AGIs $75k-100k, 1.6% for AGIs $100k-200k, 1.9% for AGIs over 200k)
Net capital gain/loss in AGI: +$9,805 (reported on 11.3% of returns)
Here:
+$9,805
State:
+$35,319
(% of AGI for various income ranges: 0.8% for AGIs $50k-75k, 2.1% for AGIs $75k-100k, 2.2% for AGIs $100k-200k, 12.1% for AGIs over 200k)
Profit/loss from business: +$15,175 (reported on 15.6% of returns)
Here:
+$15,175
State:
+$13,732
(% of AGI for various income ranges: 7.0% for AGIs below $25k, 2.8% for AGIs $25k-50k, 5.6% for AGIs $50k-75k, 2.9% for AGIs $75k-100k, 8.1% for AGIs $100k-200k, 7.4% for AGIs over 200k)
Taxable individual retirement arrangement distribution: $12,256 (reported on 9.8% of returns)
76520:
$12,256
Texas:
$19,511
(% of AGI for various income ranges: 2.7% for AGIs below $25k, 2.0% for AGIs $25k-50k, 2.6% for AGIs $50k-75k, 4.3% for AGIs $75k-100k, 5.2% for AGIs $100k-200k)
Total itemized deductions: $22,324 (21% of AGI, reported on 11.3% of returns)
Here:
$22,324
State:
$24,724
Here:
20.7% of AGI
State:
15.9% of AGI
(% of AGI for various income ranges: 6.9% for AGIs below $25k, 4.5% for AGIs $25k-50k, 5.1% for AGIs $50k-75k, 6.8% for AGIs $75k-100k, 7.8% for AGIs $100k-200k, 5.1% for AGIs over 200k)
Charity contributions: $5,600 (reported on 8.6% of returns)
Here:
$5,600
State:
$6,808
(% of AGI for various income ranges: 0.6% for AGIs below $25k, 0.5% for AGIs $25k-50k, 0.8% for AGIs $50k-75k, 1.6% for AGIs $75k-100k, 1.9% for AGIs $100k-200k, 1.6% for AGIs over 200k)
Taxes paid: $4,311 (reported on 11.3% of returns)
76520:
$4,311
State:
$6,921
(% of AGI for various income ranges: 0.6% for AGIs below $25k, 0.6% for AGIs $25k-50k, 1.0% for AGIs $50k-75k, 1.4% for AGIs $75k-100k, 1.8% for AGIs $100k-200k, 1.5% for AGIs over 200k)
Earned income credit: $2,524 (reported on 29.4% of returns)
Here:
$2,524
State:
$2,570
(% of AGI for various income ranges: 9.7% for AGIs below $25k, 1.9% for AGIs $25k-50k)
Percentage of individuals using paid preparers for their 2012 taxes: 64.5%
Here:
65%
State:
51%
(% for various income ranges: 62.8% for AGIs below $25k, 65.1% for AGIs $25k-50k, 67.5% for AGIs $50k-75k, 63.6% for AGIs $75k-100k, 66.7% for AGIs $100k-200k, 80.0% for AGIs over 200k)
Averages for the 2004 tax year for zip code 76520, filed in 2005:
Average Adjusted Gross Income (AGI) in 2004: $31,348 (Individual Income Tax Returns)
Here:
$31,348
State:
$47,881
Salary/wage: $27,910 (reported on 81.7% of returns)
Here:
$27,910
State:
$41,947
(% of AGI for various income ranges: 280.7% for AGIs below $10k, 80.7% for AGIs $10k-25k, 78.6% for AGIs $25k-50k, 76.8% for AGIs $50k-75k, 77.8% for AGIs $75k-100k, 41.9% for AGIs over 100k)
Taxable interest for individuals: $2,191 (reported on 34.5% of returns)
This zip code:
$2,191
Texas:
$2,255
(% of AGI for various income ranges: 26.1% for AGIs below $10k, 2.9% for AGIs $10k-25k, 2.2% for AGIs $25k-50k, 1.9% for AGIs $50k-75k, 1.1% for AGIs $75k-100k, 2.2% for AGIs over 100k)
Taxable dividends: $2,148 (reported on 20.5% of returns)
Here:
$2,148
State:
$4,261
(% of AGI for various income ranges: 13.0% for AGIs below $10k, 0.8% for AGIs $10k-25k, 0.9% for AGIs $25k-50k, 0.6% for AGIs $50k-75k, 0.7% for AGIs $75k-100k, 3.0% for AGIs over 100k)
Net capital gain/loss: +$7,949 (reported on 16.6% of returns)
Here:
+$7,949
State:
+$16,110
(% of AGI for various income ranges: 2.2% for AGIs below $10k, 1.2% for AGIs $10k-25k, 1.0% for AGIs $25k-50k, 1.7% for AGIs $50k-75k, 1.6% for AGIs $75k-100k, 14.1% for AGIs over 100k)
Profit/loss from business: +$9,621 (reported on 14.6% of returns)
Here:
+$9,621
State:
+$11,013
(% of AGI for various income ranges: 10.1% for AGIs below $10k, 3.0% for AGIs $10k-25k, 3.6% for AGIs $25k-50k, 4.8% for AGIs $50k-75k, 3.9% for AGIs $75k-100k, 6.3% for AGIs over 100k)
IRA payment deduction: $3,474 (reported on 1.7% of returns)
76520:
$3,474
Texas:
$3,120
(% of AGI for various income ranges: 0.2% for AGIs $10k-25k, 0.2% for AGIs $25k-50k, 0.2% for AGIs $50k-75k, 0.5% for AGIs $75k-100k)
Self-employed pension: $20,615 (reported on 0.4% of returns)
Here:
$20,615
Texas:
$16,401
Total itemized deductions: $16,224 (22% of AGI, reported on 10.2% of returns)
Here:
$16,224
State:
$19,631
Here:
21.9% of AGI
State:
18.9% of AGI
(% of AGI for various income ranges: 4.3% for AGIs $10k-25k, 4.5% for AGIs $25k-50k, 5.7% for AGIs $50k-75k, 5.3% for AGIs $75k-100k, 6.7% for AGIs over 100k)
Charity contributions deductions: $4,371 (6% of AGI, reported on 8.0% of returns)
Here:
$4,371
State:
$4,753
Here:
5.5% of AGI
State:
4.2% of AGI
(% of AGI for various income ranges: 0.6% for AGIs $10k-25k, 0.7% for AGIs $25k-50k, 1.3% for AGIs $50k-75k, 0.9% for AGIs $75k-100k, 2.0% for AGIs over 100k)
Total tax: $5,040 (reported on 63.3% of returns)
76520:
$5,040
State:
$9,058
(% of AGI for various income ranges: 7.3% for AGIs below $10k, 3.0% for AGIs $10k-25k, 6.3% for AGIs $25k-50k, 9.1% for AGIs $50k-75k, 11.5% for AGIs $75k-100k, 20.6% for AGIs over 100k)
Earned income credit: $1,984 (reported on 26.7% of returns)
Here:
$1,984
State:
$2,024
Percentage of individuals using paid preparers for their 2004 taxes: 67.9%
Here:
68%
State:
57%
(% for various income ranges: 65.2% for AGIs below $10k, 69.7% for AGIs $10k-25k, 66.7% for AGIs $25k-50k, 69.9% for AGIs $50k-75k, 68.9% for AGIs $75k-100k, 71.5% for AGIs over 100k)
Household received Food Stamps/SNAP in the past 12 months: 592 Household did not receive Food Stamps/SNAP in the past 12 months: 2,305
Women who had a birth in the past 12 months: 123 (80 now married, 42 unmarried) Women who did not have a birth in the past 12 months: 1,471 (679 now married, 790 unmarried)
Housing units in zip code 76520 with a mortgage: 770 (46 second mortgage, 50 both second mortgage and home equity loan) Houses without a mortgage: 10
Median monthly owner costs for units with a mortgage: $1,194 Median monthly owner costs for units without a mortgage: $506
Residents with income below the poverty level in 2022:
This zip code:
20.6%
Whole state:
14.0%
Residents with income below 50% of the poverty level in 2022:
This zip code:
11.1%
Whole state:
7.4%
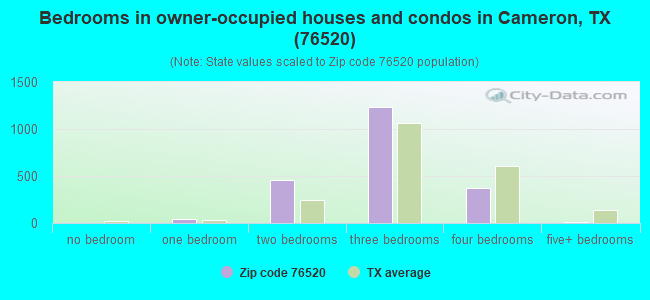
Median number of rooms in houses and condos:
Here:
5.8
State:
6.3
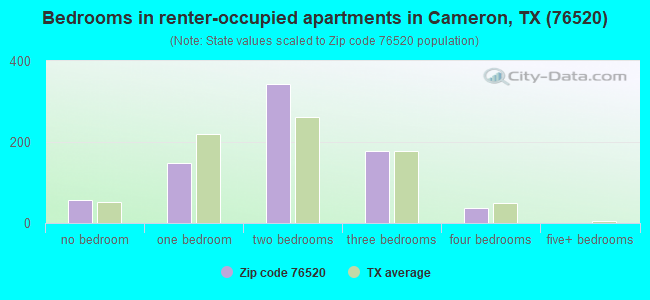
Median number of rooms in apartments:
Here:
3.9
State:
4.0
Notable locations in this zip code not listed on our city pages
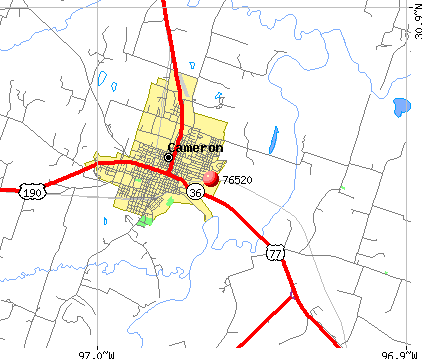
Notable locations in zip code 76520: Smith Ranch (A), Black (B), Milam County Courthouse (C), Fayette Public Library (D), Marlin Public Library (E), Schulenburg Public Library (F), Milam County Historical Museum (G), Cameron Volunteer Fire Department (H), American Medical Response Ambulance Service Station 1 (I), Doctor Nathan and Lula Cass House (J). Display/hide their locations on the map
Churches in zip code 76520 include: Union Ridge Church (A), Pleasant Grove Church (B), Port Sullivan Church (C), Sweet Home Church (D), Clarkson Church (E), Coxes Providence Church (F), Crossroads Church (G), String Prairie Church (H), Harlin Chapel Church (I). Display/hide their locations on the map
Cemeteries: Little River Baptist Cemetery (1), Coxes Providence Community Cemetery (2), Foster Cemetery (3), Battle Cemetery (4), Pebble Grove Cemetery (5), Rice Cemetery (6), Little Rocky Cemetery (7). Display/hide their locations on the map
Lakes, reservoirs, and swamps: Newton Lake (A), Green Lake (B), Hlavacek Lake (C), Knight Lake (D), Hudson Lake (E), Elm Creek Farm Lake Number 1 (F), McCrary Lake (G), Thomas Estate Lake (H). Display/hide their locations on the map
Streams, rivers, and creeks: Big Elm Creek (A), Bear Creek (B), Ackerman Slough (C), Tyson Creek (D), Walkers Creek (E), Wolf Spring Slough (F), Sandy Creek (G), Pond Creek (H), North Elm Creek (I). Display/hide their locations on the map
In group quarters: 324 (-1 institutionalized population)
Size of family households: 787 2-persons, 570 3-persons, 456 4-persons, 121 5-persons, 28 6-persons, 75 7-or-more-persons
Size of nonfamily households: 759 1-person, 86 2-persons
1,180 married couples with children.
474 single-parent households (238 men, 236 women).
78.8% of residents of 76520 zip code speak English at home.
20.4% of residents speak Spanish at home (56% very well, 24% well, 10% not well, 9% not at all).
0.1% of residents speak other Indo-European language at home (100% very well).
0.9% of residents speak Asian or Pacific Island language at home (100% very well).
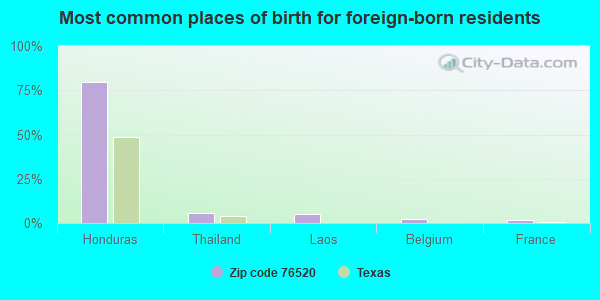
Foreign born population: 590 (7.3%) (26.5% of them are naturalized citizens)
This zip code:
7.3%
Whole state:
17.2%
80%Honduras
5%Thailand
5%Laos
2%Belgium
1%France
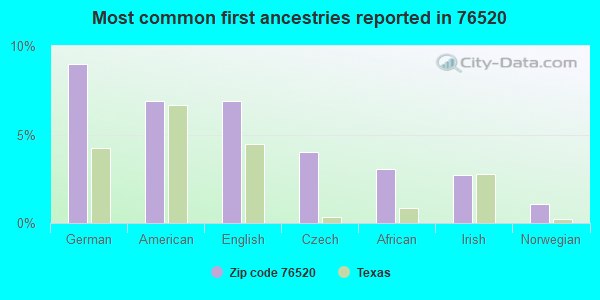
9%German
7%American
7%English
4%Czech
3%African
3%Irish
1%Norwegian
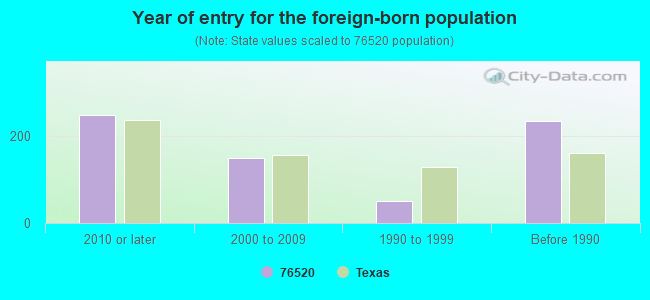
Year of entry for the foreign-born population
2492010 or later
1492000 to 2009
501990 to 1999
236Before 1990
Housing units lacking complete plumbing facilities: 8.8% Housing units lacking complete kitchen facilities: 7.7%
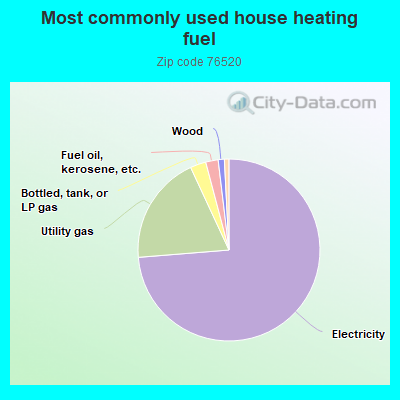
73.5%Electricity
19.3%Utility gas
2.8%Bottled, tank, or LP gas
2.2%Fuel oil, kerosene, etc.
1.1%Wood
0.8%No fuel used
Population in 1990: 6,965. Population change in the 1990s: +1,493 (+21.4%).
Place of birth for U.S.-born residents:
This state: 5,992
Northeast: 231
Midwest: 282
South: 340
West: 523
60% of the 76520 zip code residents lived in the same house 5 years ago. Out of people who lived in different houses, 58% lived in this county. Out of people who lived in different counties, 50% lived in Texas.
89% of the 76520 zip code residents lived in the same house 1 year ago. Out of people who lived in different houses, 12% moved from this county. Out of people who lived in different houses, 35% moved from different county within same state. Out of people who lived in different houses, 58% moved from different state. Out of people who lived in different houses, 4% moved from abroad.
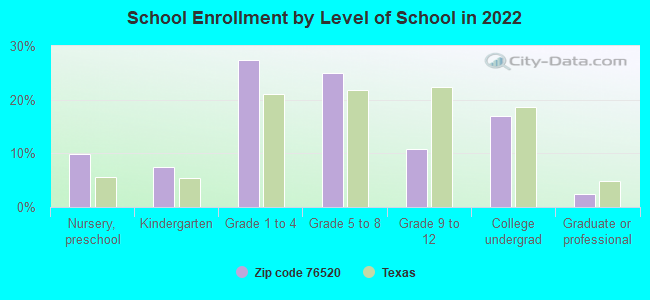
Private vs. public school enrollment:
Students in private schools in grades 1 to 8 (elementary and middle school): 27
Here:
2.4%
Texas:
8.8%
Students in private schools in grades 9 to 12 (high school): 8
Here:
3.7%
Texas:
8.0%
Students in private undergraduate colleges: 112
Here:
30.5%
Texas:
16.2%
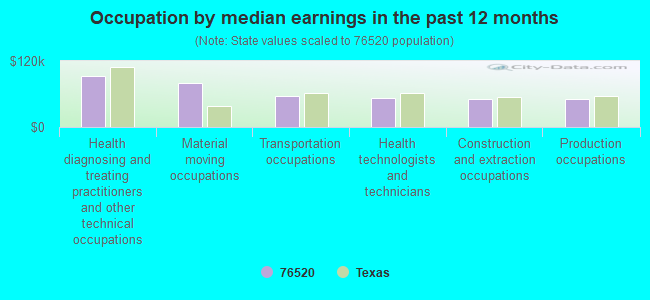
Occupation by median earnings in the past 12 months ($)
93,444Health diagnosing and treating practitioners and other technical occupations
79,362Material moving occupations
55,792Transportation occupations
52,252Health technologists and technicians
51,324Construction and extraction occupations
50,072Production occupations
Top industries in this zip code by the number of employees in 2005:
Health Care and Social Assistance: Nursing Care Facilities (50-99 employees: 2 establishments)
Accommodation and Food Services: Limited-Service Restaurants (20-49: 1, 10-19: 3)
Health Care and Social Assistance: General Medical and Surgical Hospitals (50-99: 1)
Finance and Insurance: Commercial Banking (20-49: 2, 1-4: 1)
Health Care and Social Assistance: Home Health Care Services (20-49: 1, 10-19: 1)
Other Services (except Public Administration): Religious Organizations (10-19: 1, 5-9: 2, 1-4: 7)
People in group quarters in 2010:
106 people in nursing facilities/skilled-nursing facilities
86 people in local jails and other municipal confinement facilities
35 people in residential treatment centers for juveniles (non-correctional)
People in group quarters in 2000:
195 people in nursing homes
44 people in local jails and other confinement facilities (including police lockups)
Fatal accident statistics in 2014:
Fatal accident count: 2
Vehicles involved in fatal accidents: 3
Fatal accidents caused by drunken drivers: 0
Fatalities: 2
Persons involved in fatal accidents: 8
Pedestrians involved in fatal accidents: 0
Fatal accident statistics in 2013:
Fatal accident count: 2
Vehicles involved in fatal accidents: 4
Fatal accidents caused by drunken drivers: 1
Fatalities: 2
Persons involved in fatal accidents: 5
Pedestrians involved in fatal accidents: 0
2002 - 2018 National Fire Incident Reporting System (NFIRS) incidents
Based on the data from the years 2002 - 2018 the average number of fire incidents per year is 50. The highest number of fires - 77 took place in 2009, and the least - 36 in 2007. The data has a growing trend.
When looking into fire subcategories, the most incidents belonged to: Outside Fires (63.6%), and Structure Fires (19.6%).
Fire incident types reported to NFIRS in Zip Code 76520
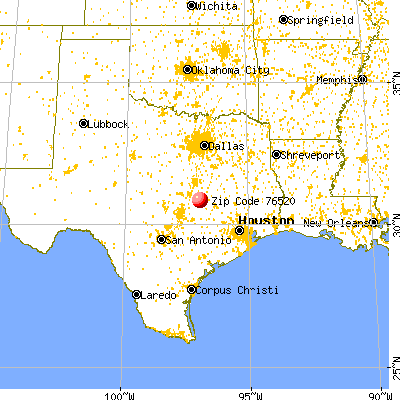


 Nearest zip codes: 76570, 76556, 77857, 76518, 77837, 76519.
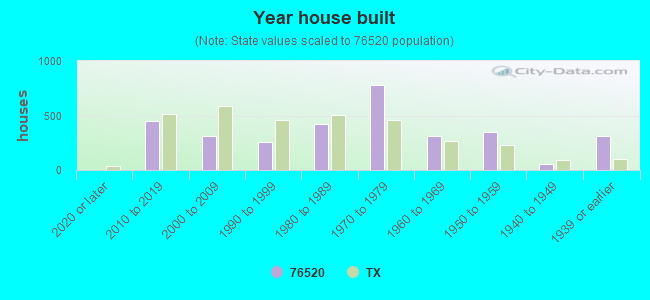


 Based on the data from the years 2002 - 2018 the average number of fire incidents per year is 50. The highest number of fires - 77 took place in 2009, and the least - 36 in 2007. The data has a growing trend.
 When looking into fire subcategories, the most incidents belonged to: Outside Fires (63.6%), and Structure Fires (19.6%).