Estimated zip code population in 2022: 4,161 Zip code population in 2010: 2,867 Zip code population in 2000: 2,434
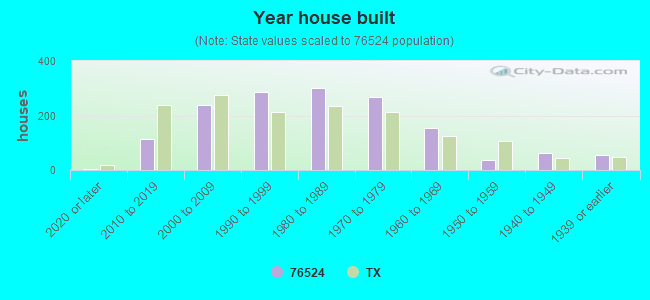
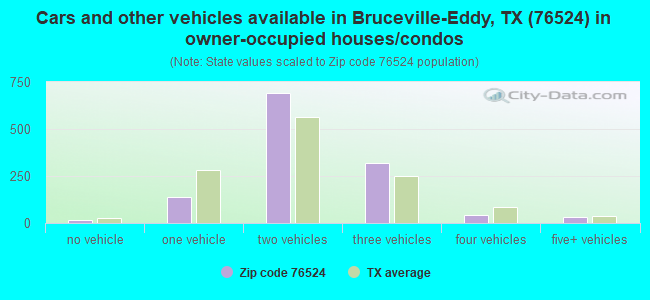
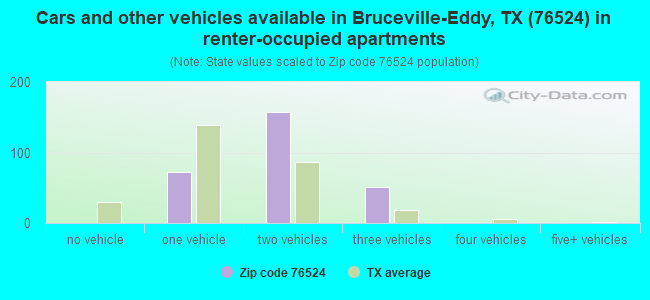
Houses and condos: 1,610 Renter-occupied apartments: 285
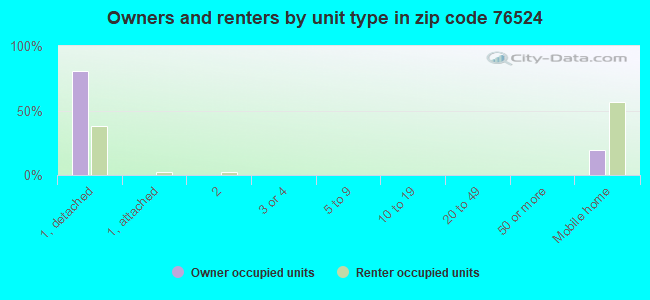
% of renters here:
19%
State:
38%
March 2022 cost of living index in zip code 76524: 79.9 (low, U.S. average is 100)
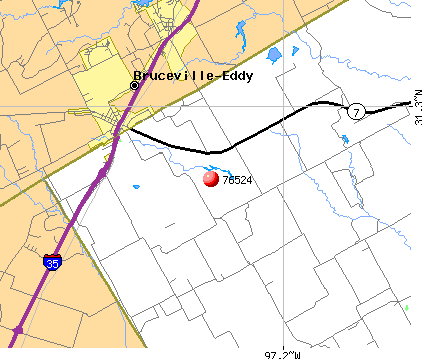
Land area: 67.2 sq. mi. Water area: 0.4 sq. mi.
Population density: 62 people per square mile
(very low).
OSM Map
General Map
Google Map
MSN Map
OSM Map
General Map
Google Map
MSN Map
OSM Map
General Map
Google Map
MSN Map
OSM Map
General Map
Google Map
MSN Map
Please wait while loading the map...
Real estate property taxes paid for housing units in 2022:
This zip code:
1.3% ($2,723)
Texas:
1.5% ($4,050)
Median real estate property taxes paid for housing units with mortgages in 2022: $4,149 (1.7%) Median real estate property taxes paid for housing units with no mortgage in 2022: $1,541 (1.4%)
Averages for the 2020 tax year for zip code 76524, filed in 2021:
Average Adjusted Gross Income (AGI) in 2020: $56,364 (Individual Income Tax Returns)
Here:
$56,364
State:
$77,054
Salary/wage: $52,380 (reported on 82.3% of returns)
Here:
$52,380
State:
$62,766
(% of AGI for various income ranges: 1154.2% for AGIs below $25k, 3551.6% for AGIs $25k-50k, 6283.5% for AGIs $50k-75k, 8929.2% for AGIs $75k-100k, 20175.5% for AGIs $100k-200k)
Taxable interest for individuals: $591 (reported on 26.9% of returns)
This zip code:
$591
Texas:
$2,665
(% of AGI for various income ranges: 4.8% for AGIs below $25k, 4.0% for AGIs $25k-50k, 17.6% for AGIs $50k-75k, 51.7% for AGIs $75k-100k, 81.8% for AGIs $100k-200k)
Ordinary dividends: $2,531 (reported on 10.0% of returns)
Here:
$2,531
State:
$10,044
(% of AGI for various income ranges: 19.0% for AGIs below $25k, 28.8% for AGIs $50k-75k, 20.0% for AGIs $75k-100k, 179.1% for AGIs $100k-200k)
Net capital gain/loss in AGI: +$6,867 (reported on 9.2% of returns)
Here:
+$6,867
State:
+$39,590
(% of AGI for various income ranges: 19.4% for AGIs below $25k, 43.5% for AGIs $50k-75k, 82.5% for AGIs $75k-100k, 537.3% for AGIs $100k-200k)
Profit/loss from business: +$11,161 (reported on 13.8% of returns)
Here:
+$11,161
State:
+$10,888
(% of AGI for various income ranges: 171.0% for AGIs below $25k, 27.2% for AGIs $25k-50k, 310.6% for AGIs $50k-75k, 167.5% for AGIs $75k-100k, 620.0% for AGIs $100k-200k)
Taxable individual retirement arrangement distribution: $15,410 (reported on 7.7% of returns)
76524:
$15,410
Texas:
$24,740
(% of AGI for various income ranges: 48.4% for AGIs below $25k, 110.0% for AGIs $25k-50k, 147.1% for AGIs $50k-75k, 721.7% for AGIs $75k-100k)
Total itemized deductions: $30,967 (reported on 2.3% of returns)
Here:
$30,967
State:
$40,428
(% of AGI for various income ranges: 774.2% for AGIs $75k-100k)
Charity contributions: $11,867 (reported on 2.3% of returns)
Here:
$11,867
State:
$18,201
(% of AGI for various income ranges: 142.4% for AGIs $25k-50k)
Taxes paid: $5,900 (reported on 2.3% of returns)
76524:
$5,900
State:
$7,821
(% of AGI for various income ranges: 147.5% for AGIs $75k-100k)
Earned income credit: $2,296 (reported on 17.7% of returns)
Here:
$2,296
State:
$2,584
(% of AGI for various income ranges: 103.5% for AGIs below $25k, 82.8% for AGIs $25k-50k)
Percentage of individuals using paid preparers for their 2020 taxes: 93.8%
Here:
94%
State:
92%
(% for various income ranges: 92.7% for AGIs below $25k, 93.5% for AGIs $25k-50k, 95.7% for AGIs $50k-75k, 93.8% for AGIs $75k-100k, 105.9% for AGIs $100k-200k, 0.0% for AGIs over 200k)
Averages for the 2012 tax year for zip code 76524, filed in 2013:
Average Adjusted Gross Income (AGI) in 2012: $45,821 (Individual Income Tax Returns)
Here:
$45,821
State:
$65,384
Salary/wage: $42,679 (reported on 83.9% of returns)
Here:
$42,679
State:
$52,524
(% of AGI for various income ranges: 76.8% for AGIs below $25k, 83.0% for AGIs $25k-50k, 79.1% for AGIs $50k-75k, 82.8% for AGIs $75k-100k, 72.4% for AGIs $100k-200k)
Taxable interest for individuals: $548 (reported on 26.6% of returns)
This zip code:
$548
Texas:
$2,372
(% of AGI for various income ranges: 0.3% for AGIs below $25k, 0.2% for AGIs $25k-50k, 0.5% for AGIs $50k-75k, 0.3% for AGIs $75k-100k, 0.3% for AGIs $100k-200k)
Ordinary dividends: $2,091 (reported on 8.9% of returns)
Here:
$2,091
State:
$9,721
(% of AGI for various income ranges: 0.4% for AGIs below $25k, 0.3% for AGIs $25k-50k, 0.6% for AGIs $50k-75k, 0.2% for AGIs $75k-100k, 0.5% for AGIs $100k-200k)
Net capital gain/loss in AGI: +$5,211 (reported on 7.3% of returns)
Here:
+$5,211
State:
+$35,319
(% of AGI for various income ranges: 0.5% for AGIs $25k-50k, 1.3% for AGIs $75k-100k, 1.5% for AGIs $100k-200k)
Profit/loss from business: +$8,179 (reported on 15.3% of returns)
Here:
+$8,179
State:
+$13,732
(% of AGI for various income ranges: 5.8% for AGIs below $25k, 1.3% for AGIs $25k-50k, 3.7% for AGIs $50k-75k, 3.6% for AGIs $75k-100k, 1.5% for AGIs $100k-200k)
Taxable individual retirement arrangement distribution: $16,811 (reported on 7.3% of returns)
76524:
$16,811
Texas:
$19,511
(% of AGI for various income ranges: 6.6% for AGIs below $25k, 4.1% for AGIs $50k-75k, 3.6% for AGIs $100k-200k)
Total itemized deductions: $16,845 (20% of AGI, reported on 16.1% of returns)
Here:
$16,845
State:
$24,724
Here:
19.7% of AGI
State:
15.9% of AGI
(% of AGI for various income ranges: 6.0% for AGIs $25k-50k, 5.2% for AGIs $50k-75k, 6.9% for AGIs $75k-100k, 7.8% for AGIs $100k-200k)
Charity contributions: $4,179 (reported on 11.3% of returns)
Here:
$4,179
State:
$6,808
(% of AGI for various income ranges: 0.8% for AGIs $25k-50k, 0.8% for AGIs $50k-75k, 1.0% for AGIs $75k-100k, 1.7% for AGIs $100k-200k)
Taxes paid: $3,990 (reported on 16.1% of returns)
76524:
$3,990
State:
$6,921
(% of AGI for various income ranges: 1.3% for AGIs $25k-50k, 1.3% for AGIs $50k-75k, 1.9% for AGIs $75k-100k, 1.8% for AGIs $100k-200k)
Earned income credit: $2,386 (reported on 22.6% of returns)
Here:
$2,386
State:
$2,570
(% of AGI for various income ranges: 7.4% for AGIs below $25k, 1.8% for AGIs $25k-50k)
Percentage of individuals using paid preparers for their 2012 taxes: 47.6%
Here:
48%
State:
51%
(% for various income ranges: 43.1% for AGIs below $25k, 50.0% for AGIs $25k-50k, 50.0% for AGIs $50k-75k, 46.2% for AGIs $75k-100k, 58.3% for AGIs $100k-200k)
Averages for the 2004 tax year for zip code 76524, filed in 2005:
Average Adjusted Gross Income (AGI) in 2004: $38,026 (Individual Income Tax Returns)
Here:
$38,026
State:
$47,881
Salary/wage: $36,071 (reported on 86.4% of returns)
Here:
$36,071
State:
$41,947
(% of AGI for various income ranges: 93.5% for AGIs below $10k, 79.2% for AGIs $10k-25k, 82.4% for AGIs $25k-50k, 85.4% for AGIs $50k-75k, 86.5% for AGIs $75k-100k, 74.0% for AGIs over 100k)
Taxable interest for individuals: $1,064 (reported on 34.2% of returns)
This zip code:
$1,064
Texas:
$2,255
(% of AGI for various income ranges: 4.6% for AGIs below $10k, 1.8% for AGIs $10k-25k, 0.8% for AGIs $25k-50k, 0.7% for AGIs $50k-75k, 0.5% for AGIs $75k-100k, 0.9% for AGIs over 100k)
Taxable dividends: $865 (reported on 11.0% of returns)
Here:
$865
State:
$4,261
(% of AGI for various income ranges: 0.8% for AGIs below $10k, 0.4% for AGIs $10k-25k, 0.2% for AGIs $25k-50k, 0.3% for AGIs $50k-75k, 0.1% for AGIs $75k-100k, 0.2% for AGIs over 100k)
Net capital gain/loss: +$9,649 (reported on 9.7% of returns)
Here:
+$9,649
State:
+$16,110
(% of AGI for various income ranges: -0.4% for AGIs below $10k, 0.1% for AGIs $10k-25k, 1.5% for AGIs $25k-50k, 0.0% for AGIs $50k-75k, 0.0% for AGIs $75k-100k, 10.0% for AGIs over 100k)
Profit/loss from business: +$6,260 (reported on 13.1% of returns)
Here:
+$6,260
State:
+$11,013
(% of AGI for various income ranges: 6.4% for AGIs $10k-25k, 2.2% for AGIs $25k-50k, 1.0% for AGIs $50k-75k, 4.8% for AGIs $75k-100k, -0.3% for AGIs over 100k)
IRA payment deduction: $3,300 (reported on 0.9% of returns)
76524:
$3,300
Texas:
$3,120
Total itemized deductions: $16,127 (21% of AGI, reported on 14.4% of returns)
Here:
$16,127
State:
$19,631
Here:
21.4% of AGI
State:
18.9% of AGI
(% of AGI for various income ranges: 4.4% for AGIs $10k-25k, 4.8% for AGIs $25k-50k, 5.7% for AGIs $50k-75k, 9.1% for AGIs $75k-100k, 7.8% for AGIs over 100k)
Charity contributions deductions: $4,168 (5% of AGI, reported on 11.4% of returns)
Here:
$4,168
State:
$4,753
Here:
5.3% of AGI
State:
4.2% of AGI
(% of AGI for various income ranges: 1.1% for AGIs $10k-25k, 0.8% for AGIs $25k-50k, 1.1% for AGIs $50k-75k, 1.6% for AGIs $75k-100k, 2.0% for AGIs over 100k)
Total tax: $5,023 (reported on 68.3% of returns)
76524:
$5,023
State:
$9,058
(% of AGI for various income ranges: 2.4% for AGIs below $10k, 3.7% for AGIs $10k-25k, 5.8% for AGIs $25k-50k, 8.0% for AGIs $50k-75k, 11.0% for AGIs $75k-100k, 16.5% for AGIs over 100k)
Earned income credit: $2,026 (reported on 20.5% of returns)
Here:
$2,026
State:
$2,024
Percentage of individuals using paid preparers for their 2004 taxes: 52.2%
Here:
52%
State:
57%
(% for various income ranges: 43.8% for AGIs below $10k, 56.9% for AGIs $10k-25k, 54.4% for AGIs $25k-50k, 53.2% for AGIs $50k-75k, 43.8% for AGIs $75k-100k, 59.6% for AGIs over 100k)
Household received Food Stamps/SNAP in the past 12 months: 82 Household did not receive Food Stamps/SNAP in the past 12 months: 1,446
Women who had a birth in the past 12 months: 14 (7 now married, 6 unmarried) Women who did not have a birth in the past 12 months: 1,015 (608 now married, 402 unmarried)
Housing units in zip code 76524 with a mortgage: 688 (15 second mortgage, 16 both second mortgage and home equity loan) Median monthly owner costs for units with a mortgage: $1,471 Median monthly owner costs for units without a mortgage: $539
Residents with income below the poverty level in 2022:
This zip code:
28.4%
Whole state:
14.0%
Residents with income below 50% of the poverty level in 2022:
This zip code:
20.9%
Whole state:
7.4%
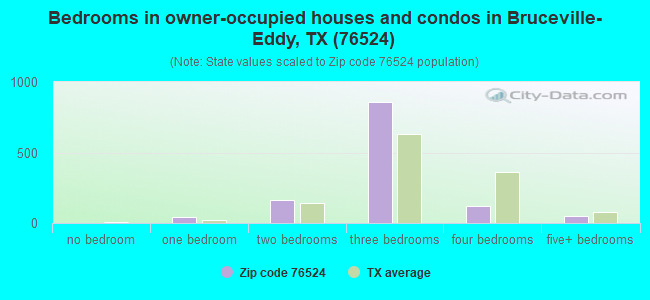
Median number of rooms in houses and condos:
Here:
6.2
State:
6.3
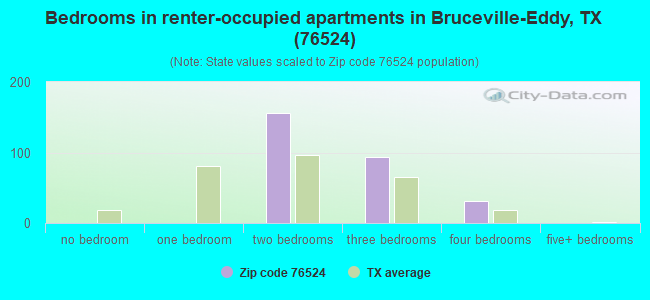
Median number of rooms in apartments:
Here:
5.0
State:
4.0
Notable locations in this zip code not listed on our city pages
Reservoirs: Soil Conservation Service Site 27 Reservoir (A), Soil Conservation Service Site 4 Reservoir (B), Soil Conservation Service Site 5 Reservoir (C). Display/hide their locations on the map
Size of family households: 505 2-persons, 494 3-persons, 109 4-persons, 68 5-persons, 38 6-persons
Size of nonfamily households: 298 1-person, 14 2-persons, 5 7-or-more-persons
318 married couples with children.
189 single-parent households (62 men, 127 women).
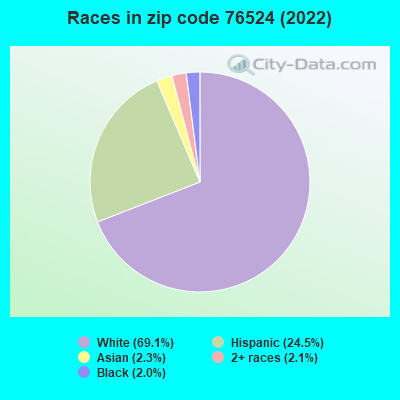
86.0% of residents of 76524 zip code speak English at home.
12.6% of residents speak Spanish at home (13% very well, 24% well, 63% not at all).
2.1% of residents speak other Indo-European language at home (93% very well, 7% well).
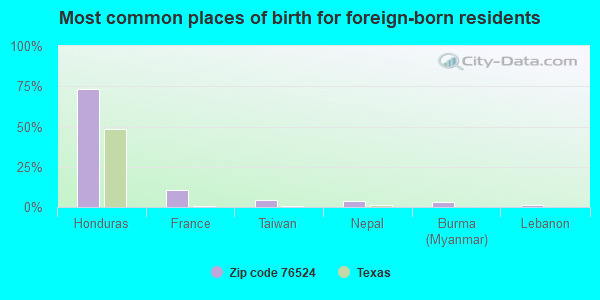
Foreign born population: 412 (9.9%) (20.0% of them are naturalized citizens)
This zip code:
9.9%
Whole state:
17.2%
73%Honduras
11%France
4%Taiwan
4%Nepal
3%Burma (Myanmar)
1%Lebanon
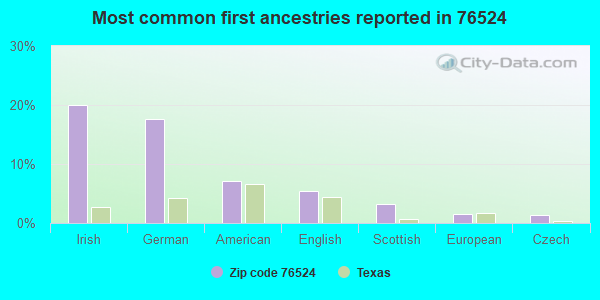
20%Irish
18%German
7%American
5%English
3%Scottish
2%European
1%Czech
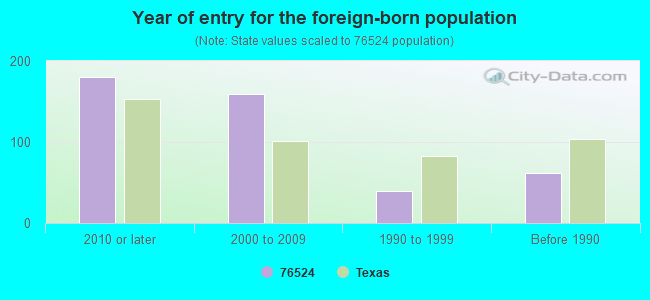
Year of entry for the foreign-born population
1802010 or later
1592000 to 2009
401990 to 1999
62Before 1990
Facilities with environmental interests located in this zip code:
B-E ACHIEVEMENT CTR (#1 EAGLE DR in EDDY, TX)
(National Center for Education Statistics) - STATE ID-161919198 Organizations: BRUCEVILLE-EDDY ISD (SCHOOL DISTRICT)
Housing units lacking complete plumbing facilities: 1.2% Housing units lacking complete kitchen facilities: 1.0%
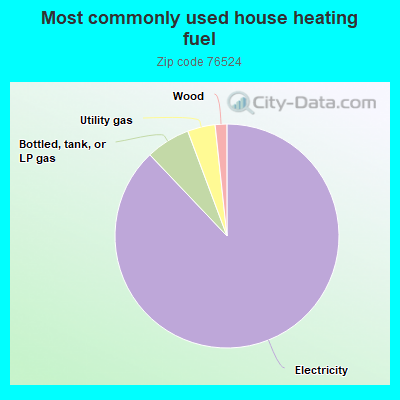
88.0%Electricity
6.4%Bottled, tank, or LP gas
4.0%Utility gas
1.7%Wood
Population in 1990: 2,544.
Place of birth for U.S.-born residents:
This state: 2,797
Northeast: 385
Midwest: 159
South: 191
West: 179
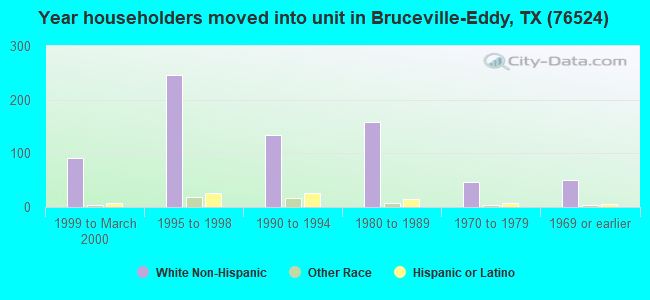
60% of the 76524 zip code residents lived in the same house 5 years ago. Out of people who lived in different houses, 45% lived in this county. Out of people who lived in different counties, 50% lived in Texas.
90% of the 76524 zip code residents lived in the same house 1 year ago. Out of people who lived in different houses, 69% moved from this county. Out of people who lived in different houses, 14% moved from different county within same state. Out of people who lived in different houses, 14% moved from different state.
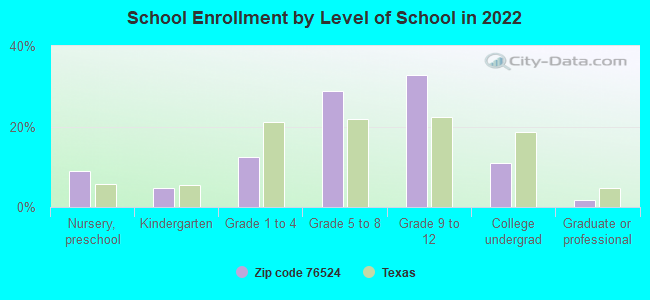
Private vs. public school enrollment:
Students in private schools in grades 1 to 8 (elementary and middle school): 88
Here:
28.8%
Texas:
8.8%
Students in private schools in grades 9 to 12 (high school): 24
Here:
10.3%
Texas:
8.0%
Students in private undergraduate colleges: 41
Here:
51.3%
Texas:
16.2%
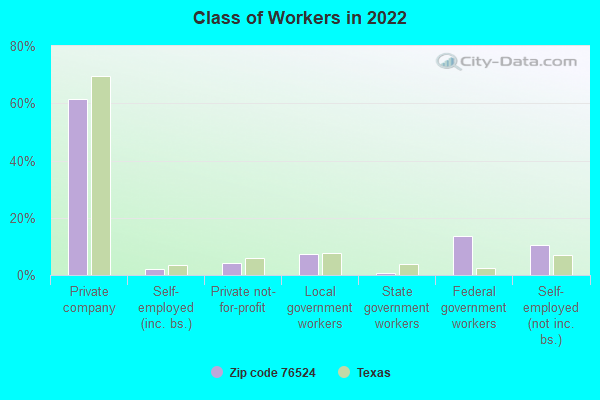
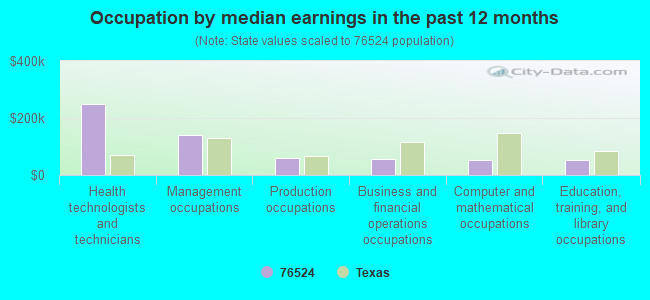
Occupation by median earnings in the past 12 months ($)
247,643Health technologists and technicians
141,776Management occupations
58,232Production occupations
55,087Business and financial operations occupations
54,155Computer and mathematical occupations
53,171Education, training, and library occupations
Companies with federal contracts located in this zip code:
E MEFFORD, KATHERINE, E (128 SOULES CIR in EDDY, TX; small business) : $25,305 in 5 contractsfrom 2004 to 2006
Contracts for Guard Services, Other Housekeeping Services by Army, U.S. Army Corps of Engineers - civil program financing only Signed by year:2000: $0; 2001: $0; 2002: $0; 2003: $0; 2004: $7,875; 2005: $11,060; 2006: $6,370.
Biggest contracts:
$7,875 with Army for Guard Services. Signed on 2004-03-15. Completion date: 2004-08-16.
$6,370 with Army for Other Housekeeping Services. Signed on 2006-01-31. Completion date: 2006-09-30.
$5,530, same as above.Signed on 2005-03-04. Completion date: 2005-09-30.
$5,530 with U.S. Army Corps of Engineers - civil program financing only for Other Housekeeping Services. Signed on 2005-03-04. Completion date: 2005-09-30.
LILA GOODWIN (TEMPLE ST in EDDY, TX; small business) : $23,615 in 7 contractsfrom 2004 to 2006
Contracts for Other Housekeeping Services, Guard Services, Services -- Basic Research (R&D) by Army, U.S. Army Corps of Engineers - civil program financing only Signed by year:2000: $0; 2001: $0; 2002: $0; 2003: $0; 2004: $5,850; 2005: $11,850; 2006: $5,915.
Biggest contracts:
$5,925 with Army for Other Housekeeping Services. Signed on 2005-03-04. Completion date: 2005-09-30.
$5,925 with U.S. Army Corps of Engineers - civil program financing only for Other Housekeeping Services. Signed on 2005-03-04. Completion date: 2005-09-30.
$5,915 with Army for Other Housekeeping Services. Signed on 2006-01-31. Completion date: 2006-09-30.
$4,950 with Army for Guard Services. Signed on 2004-03-15. Completion date: 2003-09-30.
Top industries in this zip code by the number of employees in 2005:
Information: Television Broadcasting (20-49 employees: 1 establishment)
Accommodation and Food Services: Full-Service Restaurants (20-49: 1)
Construction: Highway, Street, and Bridge Construction (20-49: 1)
Health Care and Social Assistance: Home Health Care Services (20-49: 1)
Real Estate and Rental and Leasing: Video Tape and Disc Rental (10-19: 1)
Health Care and Social Assistance: Offices of Physicians (except Mental Health Specialists) (5-9: 1)
Wholesale Trade: Service Establishment Equipment and Supplies Merchant Wholesalers (5-9: 1)
Construction: Electrical Contractors (5-9: 1)
People in group quarters in 2000:
32 people in unknown juvenile institutions
Fatal accident statistics in 2012:
Fatal accident count: 2
Vehicles involved in fatal accidents: 16
Fatal accidents caused by drunken drivers: 0
Fatalities: 2
Persons involved in fatal accidents: 21
Pedestrians involved in fatal accidents: 0
Fatal accident statistics in 2010:
Fatal accident count: 1
Vehicles involved in fatal accidents: 1
Fatal accidents caused by drunken drivers: 0
Fatalities: 1
Persons involved in fatal accidents: 3
Pedestrians involved in fatal accidents: 1
Home Mortgage Disclosure Act Aggregated Statistics For Year 2009 (Based on 2 partial tracts)
A) FHA, FSA/RHS & VA Home Purchase Loans
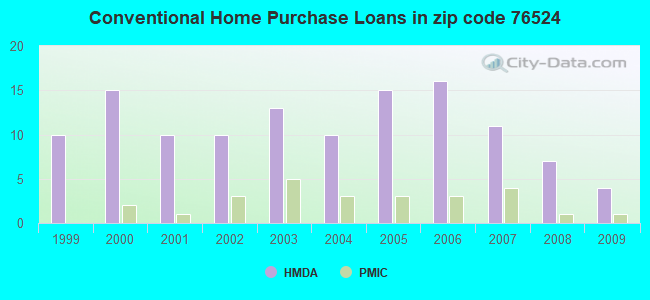
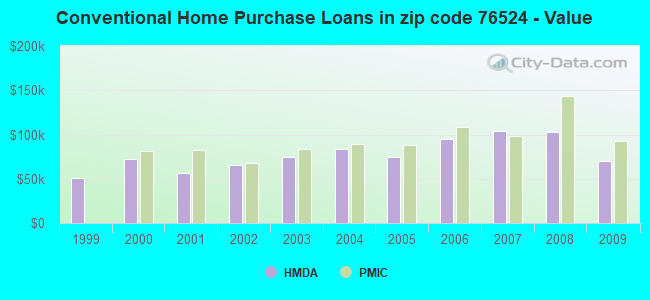
B) Conventional Home Purchase Loans
C) Refinancings
D) Home Improvement Loans
F) Non-occupant Loans on < 5 Family Dwellings (A B C & D)
G) Loans On Manufactured Home Dwelling (A B C & D)
Number
Average Value
Number
Average Value
Number
Average Value
Number
Average Value
Number
Average Value
Number
Average Value
LOANS ORIGINATED
3
$123,680
4
$70,580
11
$133,269
1
$29,420
2
$50,535
2
$74,120
APPLICATIONS APPROVED, NOT ACCEPTED
0
$0
1
$80,630
0
$0
0
$0
0
$0
1
$48,290
APPLICATIONS DENIED
1
$39,750
1
$74,790
3
$142,847
2
$21,225
0
$0
2
$65,360
APPLICATIONS WITHDRAWN
0
$0
0
$0
3
$139,027
1
$45,590
0
$0
1
$45,590
FILES CLOSED FOR INCOMPLETENESS
0
$0
0
$0
1
$50,760
0
$0
0
$0
0
$0
Aggregated Statistics For Year 2008 (Based on 2 partial tracts)
A) FHA, FSA/RHS & VA Home Purchase Loans
B) Conventional Home Purchase Loans
C) Refinancings
D) Home Improvement Loans
F) Non-occupant Loans on < 5 Family Dwellings (A B C & D)
G) Loans On Manufactured Home Dwelling (A B C & D)
Number
Average Value
Number
Average Value
Number
Average Value
Number
Average Value
Number
Average Value
Number
Average Value
LOANS ORIGINATED
7
$136,236
7
$102,514
9
$108,631
2
$46,715
2
$70,635
2
$42,900
APPLICATIONS APPROVED, NOT ACCEPTED
0
$0
2
$79,395
1
$96,350
0
$0
1
$99,050
1
$61,990
APPLICATIONS DENIED
2
$75,130
3
$145,317
5
$122,272
5
$31,174
1
$29,420
1
$61,990
APPLICATIONS WITHDRAWN
0
$0
1
$37,960
2
$93,095
1
$155,200
1
$26,950
0
$0
FILES CLOSED FOR INCOMPLETENESS
0
$0
0
$0
1
$154,970
0
$0
0
$0
0
$0
Aggregated Statistics For Year 2007 (Based on 2 partial tracts)
A) FHA, FSA/RHS & VA Home Purchase Loans
B) Conventional Home Purchase Loans
C) Refinancings
D) Home Improvement Loans
F) Non-occupant Loans on < 5 Family Dwellings (A B C & D)
G) Loans On Manufactured Home Dwelling (A B C & D)
Number
Average Value
Number
Average Value
Number
Average Value
Number
Average Value
Number
Average Value
Number
Average Value
LOANS ORIGINATED
4
$138,802
11
$104,378
10
$102,912
3
$34,590
2
$63,000
4
$54,915
APPLICATIONS APPROVED, NOT ACCEPTED
1
$45,820
1
$86,920
2
$90,850
1
$34,140
0
$0
2
$63,335
APPLICATIONS DENIED
1
$112,300
5
$77,218
12
$84,842
9
$40,578
1
$48,740
6
$52,145
APPLICATIONS WITHDRAWN
1
$85,570
1
$70,080
7
$90,674
1
$29,650
1
$34,140
0
$0
FILES CLOSED FOR INCOMPLETENESS
0
$0
0
$0
1
$112,970
0
$0
0
$0
0
$0
Aggregated Statistics For Year 2006 (Based on 2 partial tracts)
A) FHA, FSA/RHS & VA Home Purchase Loans
B) Conventional Home Purchase Loans
C) Refinancings
D) Home Improvement Loans
F) Non-occupant Loans on < 5 Family Dwellings (A B C & D)
G) Loans On Manufactured Home Dwelling (A B C & D)
Number
Average Value
Number
Average Value
Number
Average Value
Number
Average Value
Number
Average Value
Number
Average Value
LOANS ORIGINATED
4
$124,990
16
$95,244
8
$93,152
3
$38,630
3
$53,753
4
$72,040
APPLICATIONS APPROVED, NOT ACCEPTED
0
$0
2
$74,680
1
$66,260
1
$48,290
0
$0
2
$48,740
APPLICATIONS DENIED
1
$95,460
6
$65,808
7
$74,407
6
$30,133
2
$31,555
5
$52,602
APPLICATIONS WITHDRAWN
1
$99,500
3
$63,113
6
$100,247
1
$64,460
1
$23,130
1
$35,260
FILES CLOSED FOR INCOMPLETENESS
0
$0
0
$0
1
$68,950
0
$0
0
$0
0
$0
Aggregated Statistics For Year 2005 (Based on 2 partial tracts)
A) FHA, FSA/RHS & VA Home Purchase Loans
B) Conventional Home Purchase Loans
C) Refinancings
D) Home Improvement Loans
F) Non-occupant Loans on < 5 Family Dwellings (A B C & D)
G) Loans On Manufactured Home Dwelling (A B C & D)
Number
Average Value
Number
Average Value
Number
Average Value
Number
Average Value
Number
Average Value
Number
Average Value
LOANS ORIGINATED
4
$105,282
15
$74,298
15
$91,652
4
$92,480
5
$58,126
4
$55,532
APPLICATIONS APPROVED, NOT ACCEPTED
0
$0
4
$43,180
2
$48,515
1
$27,400
0
$0
2
$31,780
APPLICATIONS DENIED
1
$40,880
6
$56,973
11
$84,164
5
$33,914
2
$52,445
4
$60,810
APPLICATIONS WITHDRAWN
0
$0
2
$56,485
6
$132,290
1
$156,550
0
$0
0
$0
FILES CLOSED FOR INCOMPLETENESS
0
$0
1
$80,410
3
$90,887
0
$0
0
$0
0
$0
Aggregated Statistics For Year 2004 (Based on 2 partial tracts)
A) FHA, FSA/RHS & VA Home Purchase Loans
B) Conventional Home Purchase Loans
C) Refinancings
D) Home Improvement Loans
F) Non-occupant Loans on < 5 Family Dwellings (A B C & D)
G) Loans On Manufactured Home Dwelling (A B C & D)
Number
Average Value
Number
Average Value
Number
Average Value
Number
Average Value
Number
Average Value
Number
Average Value
LOANS ORIGINATED
4
$92,422
10
$84,045
16
$74,623
4
$19,765
2
$53,005
5
$56,600
APPLICATIONS APPROVED, NOT ACCEPTED
0
$0
1
$34,810
3
$84,227
1
$22,680
0
$0
2
$27,175
APPLICATIONS DENIED
0
$0
4
$51,545
10
$76,184
5
$23,134
1
$53,230
5
$45,594
APPLICATIONS WITHDRAWN
0
$0
1
$129,370
9
$67,779
1
$31,440
0
$0
1
$48,960
FILES CLOSED FOR INCOMPLETENESS
0
$0
0
$0
4
$95,622
0
$0
0
$0
0
$0
Aggregated Statistics For Year 2003 (Based on 2 partial tracts)
A) FHA, FSA/RHS & VA Home Purchase Loans
B) Conventional Home Purchase Loans
C) Refinancings
D) Home Improvement Loans
F) Non-occupant Loans on < 5 Family Dwellings (A B C & D)
Number
Average Value
Number
Average Value
Number
Average Value
Number
Average Value
Number
Average Value
LOANS ORIGINATED
4
$74,848
13
$74,567
31
$85,507
3
$24,183
3
$32,417
APPLICATIONS APPROVED, NOT ACCEPTED
0
$0
1
$110,950
3
$77,710
1
$15,270
0
$0
APPLICATIONS DENIED
0
$0
3
$53,980
16
$64,011
4
$29,368
1
$27,850
APPLICATIONS WITHDRAWN
0
$0
2
$102,305
7
$86,920
1
$27,850
0
$0
FILES CLOSED FOR INCOMPLETENESS
0
$0
0
$0
1
$70,970
1
$54,350
0
$0
Aggregated Statistics For Year 2002 (Based on 2 partial tracts)
A) FHA, FSA/RHS & VA Home Purchase Loans
B) Conventional Home Purchase Loans
C) Refinancings
D) Home Improvement Loans
F) Non-occupant Loans on < 5 Family Dwellings (A B C & D)
Number
Average Value
Number
Average Value
Number
Average Value
Number
Average Value
Number
Average Value
LOANS ORIGINATED
4
$89,278
10
$65,740
17
$75,373
4
$25,155
1
$82,880
APPLICATIONS APPROVED, NOT ACCEPTED
0
$0
2
$33,130
3
$82,727
1
$12,130
0
$0
APPLICATIONS DENIED
0
$0
6
$46,755
6
$61,653
4
$24,930
0
$0
APPLICATIONS WITHDRAWN
1
$52,110
0
$0
5
$65,808
1
$34,590
0
$0
FILES CLOSED FOR INCOMPLETENESS
0
$0
1
$42,000
2
$82,430
0
$0
0
$0
Aggregated Statistics For Year 2001 (Based on 2 partial tracts)
A) FHA, FSA/RHS & VA Home Purchase Loans
B) Conventional Home Purchase Loans
C) Refinancings
D) Home Improvement Loans
F) Non-occupant Loans on < 5 Family Dwellings (A B C & D)
Number
Average Value
Number
Average Value
Number
Average Value
Number
Average Value
Number
Average Value
LOANS ORIGINATED
3
$77,710
10
$56,038
15
$85,168
4
$25,772
2
$25,715
APPLICATIONS APPROVED, NOT ACCEPTED
0
$0
6
$44,995
3
$46,867
0
$0
0
$0
APPLICATIONS DENIED
0
$0
11
$52,046
8
$49,861
2
$53,565
1
$29,870
APPLICATIONS WITHDRAWN
0
$0
2
$33,015
5
$57,228
0
$0
0
$0
FILES CLOSED FOR INCOMPLETENESS
0
$0
0
$0
1
$91,190
0
$0
0
$0
Aggregated Statistics For Year 2000 (Based on 2 partial tracts)
A) FHA, FSA/RHS & VA Home Purchase Loans
B) Conventional Home Purchase Loans
C) Refinancings
D) Home Improvement Loans
Number
Average Value
Number
Average Value
Number
Average Value
Number
Average Value
LOANS ORIGINATED
4
$66,088
15
$72,606
6
$75,803
2
$16,620
APPLICATIONS APPROVED, NOT ACCEPTED
0
$0
5
$49,546
2
$79,510
0
$0
APPLICATIONS DENIED
0
$0
11
$46,860
4
$57,722
2
$9,995
APPLICATIONS WITHDRAWN
0
$0
0
$0
1
$40,650
0
$0
FILES CLOSED FOR INCOMPLETENESS
0
$0
0
$0
1
$47,620
0
$0
Aggregated Statistics For Year 1999 (Based on 1 partial tract)
A) FHA, FSA/RHS & VA Home Purchase Loans
B) Conventional Home Purchase Loans
C) Refinancings
D) Home Improvement Loans
F) Non-occupant Loans on < 5 Family Dwellings (A B C & D)
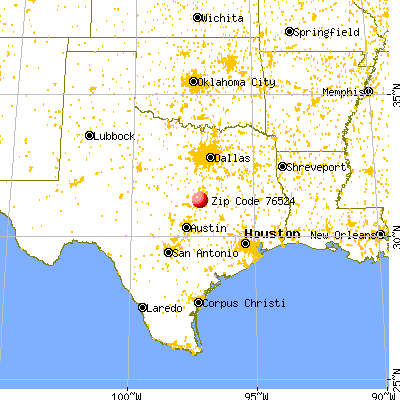


 Nearest zip codes: 76630, 76579, 76655, 76632, 76656, 76643.