Estimated zip code population in 2022: 16,465 Zip code population in 2010: 13,554 Zip code population in 2000: 11,279
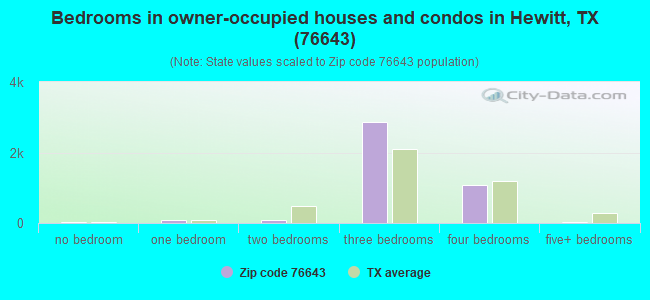
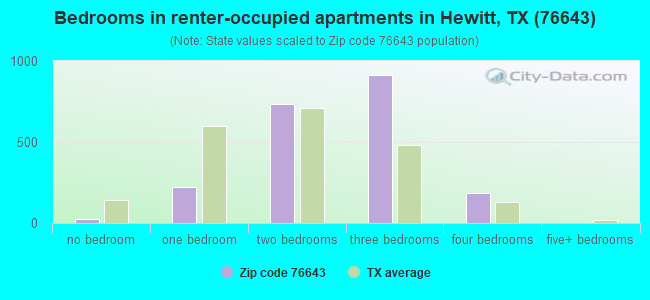
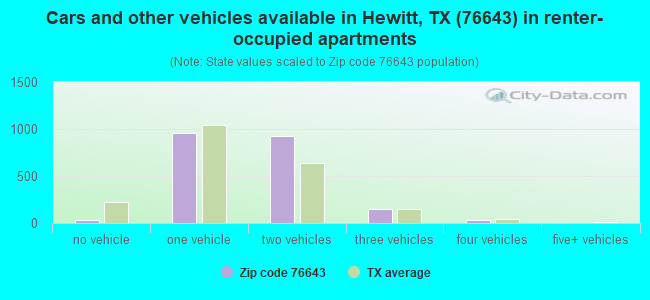
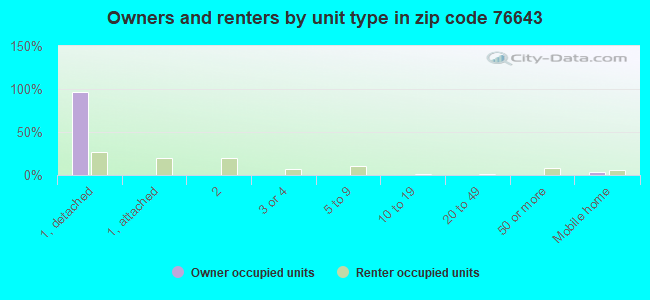
Houses and condos: 6,306 Renter-occupied apartments: 2,111
% of renters here:
34%
State:
38%
March 2022 cost of living index in zip code 76643: 85.9 (less than average, U.S. average is 100)
Land area: 8.0 sq. mi. Water area: 0.0 sq. mi.
Population density: 2,062 people per square mile
(low).
OSM Map
General Map
Google Map
MSN Map
OSM Map
General Map
Google Map
MSN Map
OSM Map
General Map
Google Map
MSN Map
OSM Map
General Map
Google Map
MSN Map
Please wait while loading the map...
Real estate property taxes paid for housing units in 2022:
This zip code:
1.4% ($3,675)
Texas:
1.5% ($4,050)
Median real estate property taxes paid for housing units with mortgages in 2022: $3,908 (1.4%) Median real estate property taxes paid for housing units with no mortgage in 2022: $3,229 (1.2%)
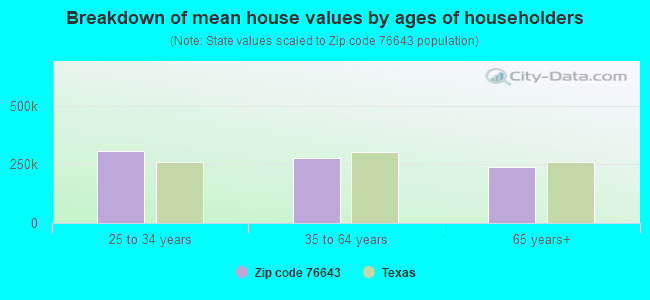
Estimated median house/condo value in 2022: $270,424
76643:
$270,424
Texas:
$275,400
According to our research of Texas and other state lists, there were 3 registered sex offenders living in 76643 zip code as of May 14, 2024. The ratio of all residents to sex offenders in zip code 76643 is 4,777 to 1. The ratio of registered sex offenders to all residents in this zip code is much lower than the state average.
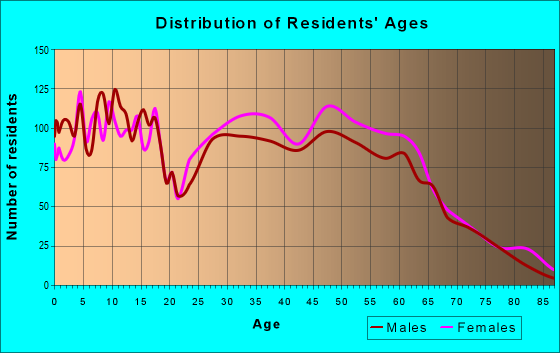
Median resident age:
This zip code:
36.7 years
Texas median age:
35.6 years
Average household size:
This zip code:
2.6 people
Texas:
2.6 people
Averages for the 2020 tax year for zip code 76643, filed in 2021:
Average Adjusted Gross Income (AGI) in 2020: $64,689 (Individual Income Tax Returns)
Here:
$64,689
State:
$77,054
Salary/wage: $58,347 (reported on 82.8% of returns)
Here:
$58,347
State:
$62,766
(% of AGI for various income ranges: 1141.5% for AGIs below $25k, 3426.2% for AGIs $25k-50k, 6328.1% for AGIs $50k-75k, 8869.2% for AGIs $75k-100k, 18071.7% for AGIs $100k-200k, 58874.3% for AGIs over 200k)
Taxable interest for individuals: $1,141 (reported on 30.5% of returns)
This zip code:
$1,141
Texas:
$2,665
(% of AGI for various income ranges: 16.0% for AGIs below $25k, 14.5% for AGIs $25k-50k, 26.7% for AGIs $50k-75k, 53.1% for AGIs $75k-100k, 61.5% for AGIs $100k-200k, 1537.1% for AGIs over 200k)
Ordinary dividends: $3,005 (reported on 14.4% of returns)
Here:
$3,005
State:
$10,044
(% of AGI for various income ranges: 18.4% for AGIs below $25k, 19.5% for AGIs $25k-50k, 43.6% for AGIs $50k-75k, 59.2% for AGIs $75k-100k, 134.8% for AGIs $100k-200k, 1214.3% for AGIs over 200k)
Net capital gain/loss in AGI: +$12,377 (reported on 13.0% of returns)
Here:
+$12,377
State:
+$39,590
(% of AGI for various income ranges: 5.9% for AGIs below $25k, 21.1% for AGIs $25k-50k, 46.8% for AGIs $50k-75k, 95.2% for AGIs $75k-100k, 349.6% for AGIs $100k-200k, 11350.0% for AGIs over 200k)
Profit/loss from business: +$10,597 (reported on 15.8% of returns)
Here:
+$10,597
State:
+$10,888
(% of AGI for various income ranges: 90.8% for AGIs below $25k, 106.4% for AGIs $25k-50k, 191.1% for AGIs $50k-75k, 218.9% for AGIs $75k-100k, 493.9% for AGIs $100k-200k, 3778.6% for AGIs over 200k)
Taxable individual retirement arrangement distribution: $17,472 (reported on 9.3% of returns)
76643:
$17,472
Texas:
$24,740
(% of AGI for various income ranges: 62.8% for AGIs below $25k, 91.0% for AGIs $25k-50k, 186.0% for AGIs $50k-75k, 385.8% for AGIs $75k-100k, 740.8% for AGIs $100k-200k)
Total itemized deductions: $31,064 (reported on 5.2% of returns)
Here:
$31,064
State:
$40,428
(% of AGI for various income ranges: 33.4% for AGIs below $25k, 68.9% for AGIs $25k-50k, 150.1% for AGIs $50k-75k, 278.9% for AGIs $75k-100k, 642.4% for AGIs $100k-200k, 3717.1% for AGIs over 200k)
Charity contributions: $13,875 (reported on 4.3% of returns)
Here:
$13,875
State:
$18,201
(% of AGI for various income ranges: 8.8% for AGIs below $25k, 28.2% for AGIs $50k-75k, 85.5% for AGIs $75k-100k, 251.9% for AGIs $100k-200k, 2310.0% for AGIs over 200k)
Taxes paid: $6,349 (reported on 5.0% of returns)
76643:
$6,349
State:
$7,821
(% of AGI for various income ranges: 3.7% for AGIs below $25k, 7.7% for AGIs $25k-50k, 26.5% for AGIs $50k-75k, 64.5% for AGIs $75k-100k, 138.4% for AGIs $100k-200k, 695.7% for AGIs over 200k)
Earned income credit: $2,241 (reported on 14.4% of returns)
Here:
$2,241
State:
$2,584
(% of AGI for various income ranges: 83.4% for AGIs below $25k, 69.4% for AGIs $25k-50k, 1.2% for AGIs $50k-75k)
Percentage of individuals using paid preparers for their 2020 taxes: 93.4%
Here:
93%
State:
92%
(% for various income ranges: 93.1% for AGIs below $25k, 95.2% for AGIs $25k-50k, 91.5% for AGIs $50k-75k, 92.0% for AGIs $75k-100k, 93.8% for AGIs $100k-200k, 94.7% for AGIs over 200k)
Averages for the 2012 tax year for zip code 76643, filed in 2013:
Average Adjusted Gross Income (AGI) in 2012: $53,941 (Individual Income Tax Returns)
Here:
$53,941
State:
$65,384
Salary/wage: $48,546 (reported on 88.4% of returns)
Here:
$48,546
State:
$52,524
(% of AGI for various income ranges: 78.1% for AGIs below $25k, 81.2% for AGIs $25k-50k, 81.6% for AGIs $50k-75k, 81.6% for AGIs $75k-100k, 80.6% for AGIs $100k-200k, 59.4% for AGIs over 200k)
Taxable interest for individuals: $735 (reported on 34.3% of returns)
This zip code:
$735
Texas:
$2,372
(% of AGI for various income ranges: 1.1% for AGIs below $25k, 0.6% for AGIs $25k-50k, 0.4% for AGIs $50k-75k, 0.3% for AGIs $75k-100k, 0.3% for AGIs $100k-200k, 0.7% for AGIs over 200k)
Ordinary dividends: $1,853 (reported on 13.7% of returns)
Here:
$1,853
State:
$9,721
(% of AGI for various income ranges: 1.0% for AGIs below $25k, 0.5% for AGIs $25k-50k, 0.5% for AGIs $50k-75k, 0.3% for AGIs $75k-100k, 0.4% for AGIs $100k-200k, 0.5% for AGIs over 200k)
Net capital gain/loss in AGI: +$4,196 (reported on 10.7% of returns)
Here:
+$4,196
State:
+$35,319
(% of AGI for various income ranges: 0.3% for AGIs $25k-50k, 0.3% for AGIs $50k-75k, 0.4% for AGIs $75k-100k, 0.9% for AGIs $100k-200k, 5.9% for AGIs over 200k)
Profit/loss from business: +$11,963 (reported on 15.2% of returns)
Here:
+$11,963
State:
+$13,732
(% of AGI for various income ranges: 5.4% for AGIs below $25k, 3.2% for AGIs $25k-50k, 2.6% for AGIs $50k-75k, 2.4% for AGIs $75k-100k, 3.4% for AGIs $100k-200k, 7.3% for AGIs over 200k)
Taxable individual retirement arrangement distribution: $12,161 (reported on 9.1% of returns)
76643:
$12,161
Texas:
$19,511
(% of AGI for various income ranges: 3.7% for AGIs below $25k, 1.9% for AGIs $25k-50k, 1.5% for AGIs $50k-75k, 2.1% for AGIs $75k-100k, 2.5% for AGIs $100k-200k)
Total itemized deductions: $18,141 (21% of AGI, reported on 24.3% of returns)
Here:
$18,141
State:
$24,724
Here:
20.8% of AGI
State:
15.9% of AGI
(% of AGI for various income ranges: 5.9% for AGIs below $25k, 6.9% for AGIs $25k-50k, 8.4% for AGIs $50k-75k, 8.4% for AGIs $75k-100k, 9.0% for AGIs $100k-200k, 8.8% for AGIs over 200k)
Charity contributions: $5,126 (reported on 18.7% of returns)
Here:
$5,126
State:
$6,808
(% of AGI for various income ranges: 0.6% for AGIs below $25k, 0.9% for AGIs $25k-50k, 1.6% for AGIs $50k-75k, 1.6% for AGIs $75k-100k, 2.5% for AGIs $100k-200k, 3.0% for AGIs over 200k)
Taxes paid: $4,753 (reported on 24.0% of returns)
76643:
$4,753
State:
$6,921
(% of AGI for various income ranges: 1.3% for AGIs below $25k, 1.6% for AGIs $25k-50k, 2.1% for AGIs $50k-75k, 2.2% for AGIs $75k-100k, 2.5% for AGIs $100k-200k, 2.3% for AGIs over 200k)
Earned income credit: $2,049 (reported on 15.4% of returns)
Here:
$2,049
State:
$2,570
(% of AGI for various income ranges: 5.5% for AGIs below $25k, 1.2% for AGIs $25k-50k)
Percentage of individuals using paid preparers for their 2012 taxes: 38.2%
Here:
38%
State:
51%
(% for various income ranges: 34.8% for AGIs below $25k, 36.1% for AGIs $25k-50k, 40.7% for AGIs $50k-75k, 40.0% for AGIs $75k-100k, 42.7% for AGIs $100k-200k, 66.7% for AGIs over 200k)
Averages for the 2004 tax year for zip code 76643, filed in 2005:
Average Adjusted Gross Income (AGI) in 2004: $45,961 (Individual Income Tax Returns)
Here:
$45,961
State:
$47,881
Salary/wage: $43,181 (reported on 90.4% of returns)
Here:
$43,181
State:
$41,947
(% of AGI for various income ranges: 135.2% for AGIs below $10k, 82.5% for AGIs $10k-25k, 84.8% for AGIs $25k-50k, 86.5% for AGIs $50k-75k, 89.2% for AGIs $75k-100k, 77.4% for AGIs over 100k)
Taxable interest for individuals: $893 (reported on 41.6% of returns)
This zip code:
$893
Texas:
$2,255
(% of AGI for various income ranges: 4.7% for AGIs below $10k, 1.5% for AGIs $10k-25k, 1.0% for AGIs $25k-50k, 0.7% for AGIs $50k-75k, 0.5% for AGIs $75k-100k, 0.7% for AGIs over 100k)
Taxable dividends: $1,143 (reported on 16.7% of returns)
Here:
$1,143
State:
$4,261
(% of AGI for various income ranges: 2.0% for AGIs below $10k, 0.6% for AGIs $10k-25k, 0.4% for AGIs $25k-50k, 0.4% for AGIs $50k-75k, 0.3% for AGIs $75k-100k, 0.4% for AGIs over 100k)
Net capital gain/loss: +$4,332 (reported on 13.5% of returns)
Here:
+$4,332
State:
+$16,110
(% of AGI for various income ranges: -1.4% for AGIs below $10k, -0.1% for AGIs $10k-25k, 0.6% for AGIs $25k-50k, 0.6% for AGIs $50k-75k, 0.5% for AGIs $75k-100k, 4.0% for AGIs over 100k)
Profit/loss from business: +$6,962 (reported on 15.3% of returns)
Here:
+$6,962
State:
+$11,013
(% of AGI for various income ranges: 3.2% for AGIs below $10k, 4.3% for AGIs $10k-25k, 2.4% for AGIs $25k-50k, 1.7% for AGIs $50k-75k, 1.3% for AGIs $75k-100k, 3.3% for AGIs over 100k)
IRA payment deduction: $3,079 (reported on 2.2% of returns)
76643:
$3,079
Texas:
$3,120
(% of AGI for various income ranges: 0.1% for AGIs $10k-25k, 0.2% for AGIs $25k-50k, 0.1% for AGIs $50k-75k, 0.2% for AGIs $75k-100k, 0.1% for AGIs over 100k)
Self-employed pension: $6,476 (reported on 0.4% of returns)
Here:
$6,476
Texas:
$16,401
Total itemized deductions: $14,934 (21% of AGI, reported on 28.6% of returns)
Here:
$14,934
State:
$19,631
Here:
20.6% of AGI
State:
18.9% of AGI
(% of AGI for various income ranges: 7.2% for AGIs below $10k, 6.0% for AGIs $10k-25k, 8.6% for AGIs $25k-50k, 9.2% for AGIs $50k-75k, 10.5% for AGIs $75k-100k, 10.0% for AGIs over 100k)
Charity contributions deductions: $3,914 (5% of AGI, reported on 23.4% of returns)
Here:
$3,914
State:
$4,753
Here:
5.2% of AGI
State:
4.2% of AGI
(% of AGI for various income ranges: 0.5% for AGIs below $10k, 0.7% for AGIs $10k-25k, 1.4% for AGIs $25k-50k, 1.8% for AGIs $50k-75k, 2.1% for AGIs $75k-100k, 3.1% for AGIs over 100k)
Total tax: $5,910 (reported on 78.2% of returns)
76643:
$5,910
State:
$9,058
(% of AGI for various income ranges: 3.3% for AGIs below $10k, 3.9% for AGIs $10k-25k, 6.8% for AGIs $25k-50k, 8.6% for AGIs $50k-75k, 10.6% for AGIs $75k-100k, 16.5% for AGIs over 100k)
Earned income credit: $1,752 (reported on 12.7% of returns)
Here:
$1,752
State:
$2,024
Percentage of individuals using paid preparers for their 2004 taxes: 44.6%
Here:
45%
State:
57%
(% for various income ranges: 37.0% for AGIs below $10k, 49.1% for AGIs $10k-25k, 45.9% for AGIs $25k-50k, 44.7% for AGIs $50k-75k, 42.5% for AGIs $75k-100k, 47.0% for AGIs over 100k)
Household received Food Stamps/SNAP in the past 12 months: 67 Household did not receive Food Stamps/SNAP in the past 12 months: 6,193
Women who had a birth in the past 12 months: 61 (62 now married, 0 unmarried) Women who did not have a birth in the past 12 months: 4,109 (2,014 now married, 2,088 unmarried)
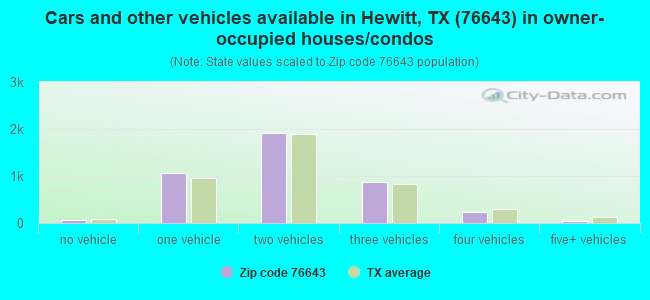
Housing units in zip code 76643 with a mortgage: 2,485 (70 second mortgage, 76 both second mortgage and home equity loan) Houses without a mortgage: 211
Median monthly owner costs for units with a mortgage: $1,663 Median monthly owner costs for units without a mortgage: $707
Residents with income below the poverty level in 2022:
This zip code:
7.3%
Whole state:
14.0%
Residents with income below 50% of the poverty level in 2022:
This zip code:
2.9%
Whole state:
7.4%
Median number of rooms in houses and condos:
Here:
6.1
State:
6.3
Median number of rooms in apartments:
Here:
4.7
State:
4.0
Notable locations in this zip code not listed on our city pages
Churches in zip code 76643 include: Church of Christ - Hewitt (A), Church of Christ - Sun Valley Boulevard (B), The Church of Jesus Christ of Latter Day Saints America Church (C). Display/hide their locations on the map
In group quarters: 85 (-1 institutionalized population)
Size of family households: 2,118 2-persons, 737 3-persons, 923 4-persons, 522 5-persons, 81 6-persons, 145 7-or-more-persons
Size of nonfamily households: 1,496 1-person, 220 2-persons, 42 4-persons
2,724 married couples with children.
822 single-parent households (105 men, 717 women).
85.9% of residents of 76643 zip code speak English at home.
9.5% of residents speak Spanish at home (46% very well, 40% well, 9% not well, 5% not at all).
1.3% of residents speak other Indo-European language at home (74% very well, 26% well).
3.3% of residents speak Asian or Pacific Island language at home (70% very well, 25% well, 3% not well, 1% not at all).
0.3% of residents speak other language at home (100% very well).
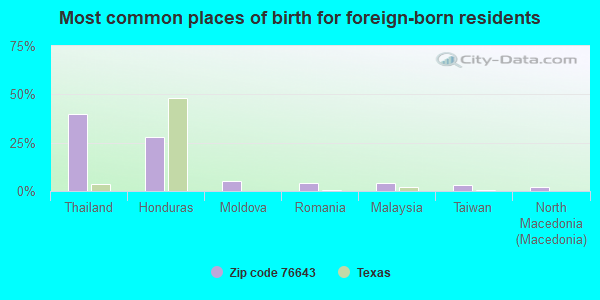
Foreign born population: 709 (4.3%) (69.3% of them are naturalized citizens)
This zip code:
4.3%
Whole state:
17.2%
40%Thailand
28%Honduras
5%Moldova
4%Romania
4%Malaysia
3%Taiwan
2%North Macedonia (Macedonia)
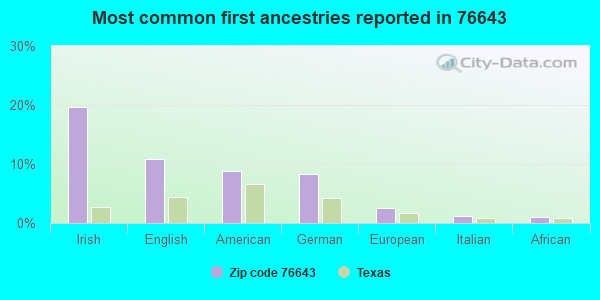
20%Irish
11%English
9%American
8%German
3%European
1%Italian
1%African
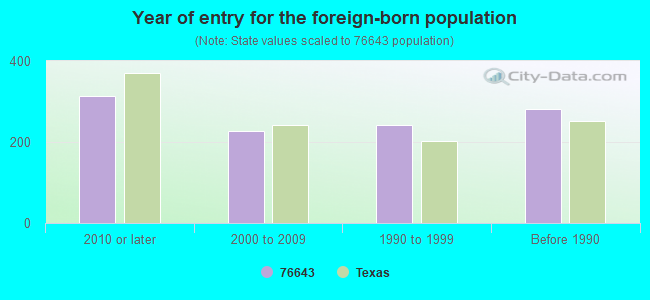
Year of entry for the foreign-born population
3132010 or later
2282000 to 2009
2421990 to 1999
282Before 1990
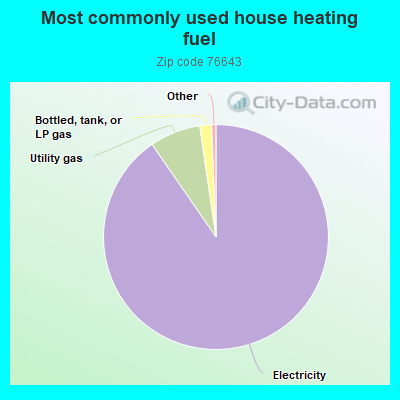
90.4%Electricity
7.3%Utility gas
1.7%Bottled, tank, or LP gas
Population in 1990: 8,487. Population change in the 1990s: +2,792 (+32.9%).
Place of birth for U.S.-born residents:
This state: 10,691
Northeast: 1,175
Midwest: 953
South: 1,128
West: 1,427
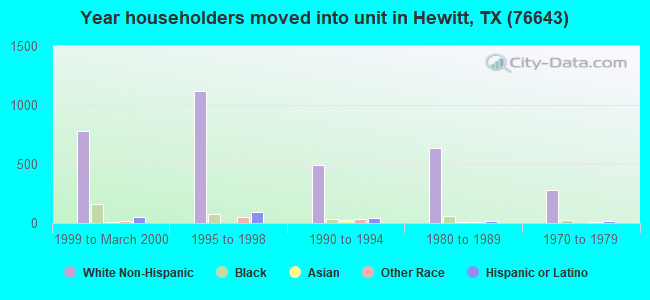
46% of the 76643 zip code residents lived in the same house 5 years ago. Out of people who lived in different houses, 53% lived in this county. Out of people who lived in different counties, 50% lived in Texas.
87% of the 76643 zip code residents lived in the same house 1 year ago. Out of people who lived in different houses, 73% moved from this county. Out of people who lived in different houses, 7% moved from different county within same state. Out of people who lived in different houses, 14% moved from different state. Out of people who lived in different houses, 2% moved from abroad.
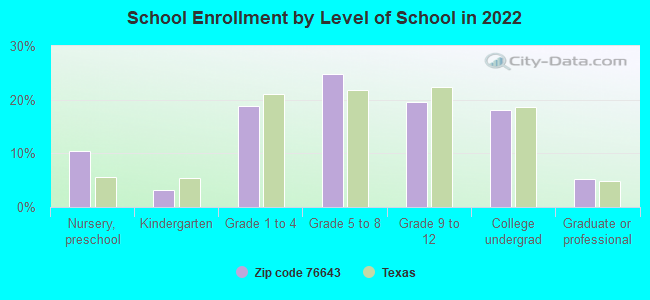
Private vs. public school enrollment:
Students in private schools in grades 1 to 8 (elementary and middle school): 140
Here:
7.2%
Texas:
8.8%
Students in private schools in grades 9 to 12 (high school): 18
Here:
2.1%
Texas:
8.0%
Students in private undergraduate colleges: 75
Here:
9.3%
Texas:
16.2%
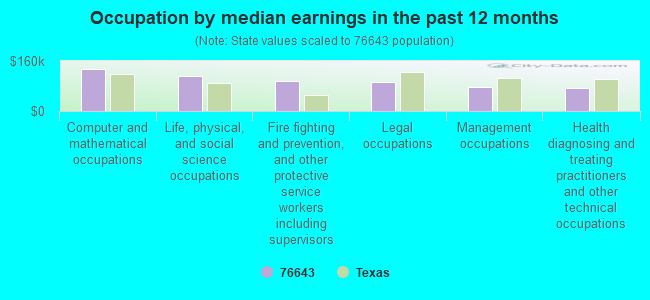
Occupation by median earnings in the past 12 months ($)
135,138Computer and mathematical occupations
113,111Life, physical, and social science occupations
96,276Fire fighting and prevention, and other protective service workers including supervisors
93,074Legal occupations
75,365Management occupations
74,641Health diagnosing and treating practitioners and other technical occupations
Companies with federal contracts located in this zip code (HEWITT, TX):
WORLD LIFT TRUCK INC (419 ENTERPRISE BLVD; small business) : $296,867 in 18 contractsfrom 2002 to 2006
Contracts for Miscellaneous Materials Handling Equipment, Lease or Rental of Equipment -- Special Industry Machinery, Lease or Rental of Equipment -- Construction, Mining, Excavating, and Highway Maintenance Equipment, Lease or Rental of Equipment -- Service and Trade Equipment, and moreby Army, U.S. Army Corps of Engineers - civil program financing only Signed by year:2000: $0; 2001: $0; 2002: $41,400; 2003: $78,145; 2004: $35,450; 2005: $135,936; 2006: $5,936.
Biggest contracts:
$82,400 with Army for Miscellaneous Materials Handling Equipment. Signed on 2005-03-02. Completion date: 2005-09-30.
$41,400 with Army for Lease or Rental of Equipment -- Special Industry Machinery. Signed on 2002-11-27. Completion date: 2003-12-05.
$40,800 with Army for Miscellaneous Materials Handling Equipment. Signed on 2005-07-07. Completion date: 2005-09-30.
$36,195 with Army for Lease or Rental of Equipment -- Construction, Mining, Excavating, and Highway Maintenance Equipment. Signed on 2003-11-04. Completion date: 2004-05-04.
ASAP INDUSTRIAL SCALE SER INC (224 W WARREN; small business) : $190,801 in 16 contractsfrom 2000 to 2006
Contracts for Trucks and Truck Tractors, Wheeled, Maintenance, Repair and Rebuilding of Equipment -- Special Industry Machinery by Army Signed by year:2000: $101,618; 2001: $4,605; 2002: $15,235; 2003: $15,143; 2004: $9,829; 2005: $25,991; 2006: $18,380.
Biggest contracts:
$73,263 with Army for Trucks and Truck Tractors, Wheeled. Signed on 2000-06-30. Completion date: 2000-07-28.
$28,355 with Army for Maintenance, Repair and Rebuilding of Equipment -- Special Industry Machinery. Signed on 2000-10-05. Completion date: 2005-09-30.
$18,380, same as above.Signed on 2006-01-31. Completion date: 2006-09-30.
$16,801, same as above.Signed on 2005-01-04. Completion date: 2005-09-30.
BEST SOURCE PROMOTIONS (926 ROLLING HILLS DR; small business) : $25,595 in 6 contractsfrom 2002 to 2005
Contracts for Office Supplies, Signs, Advertising Displays, and Identification Plates by Army Signed by year:2000: $0; 2001: $0; 2002: $9,647; 2003: $5,758; 2004: $4,763; 2005: $5,427; 2006: $0.
Biggest contracts:
$5,758 with Army for Office Supplies. Taking place in VA. Signed on 2003-09-05. Completion date: 2003-10-09.
$5,427 with Army for Office Supplies. Signed on 2005-09-21. Completion date: 2005-10-21.
$4,782 with Army for Signs, Advertising Displays, and Identification Plates. Signed on 2002-09-30. Completion date: 2002-10-28.
$4,763 with Army for Office Supplies. Signed on 2004-06-25. Completion date: 2004-07-09.
TRINITY ELECTRICAL SERVICE, IN (1600-C W SPRING VALLEY RO; small business)
$4,500 with Navy for Maintenance, Repair or Alteration of Real Property -- Other Administrative Facilities and Service Buildings. Signed on 2002-03-19. Completion date: 2002-03-27.
RDO CONSTRUCTION EQUIPMENT CO (INTERSTATE 35 S FM 2113)
$3,645 with Army for Truck and Tractor Attachments. Signed on 2004-03-31. Completion date: 2004-05-14.
JOHN M HOYT, JR (605 HEWITT DR; small business) : $1,900 in 2 contractsin 2003
$2,850 with Defense Information Systems Agency for Material Handling Equipment, Nonself-Propelled. Signed on 2003-11-06. Completion date: 2004-09-30.
-$950, same as above.Signed on 2003-12-18. Completion date: 2004-09-30.
Top industries in this zip code by the number of employees in 2005:
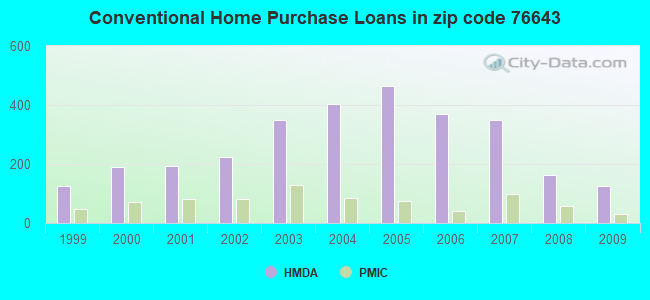
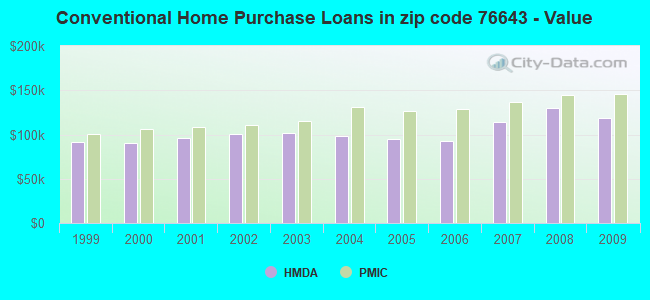
Detailed PMIC statistics for the following Tracts:0037.06
, 0037.08
2002 - 2018 National Fire Incident Reporting System (NFIRS) incidents
Based on the data from the years 2002 - 2018 the average number of fires per year is 35. The highest number of fires - 75 took place in 2005, and the least - 20 in 2009. The data has a declining trend.
When looking into fire subcategories, the most incidents belonged to: Outside Fires (50.0%), and Structure Fires (23.7%).
Fire incident types reported to NFIRS in Zip Code 76643


 Nearest zip codes: 76655, 76711, 76710, 76712, 76707, 76706.


 : $296,867 in 18 contracts from 2002 to 2006
 Based on the data from the years 2002 - 2018 the average number of fires per year is 35. The highest number of fires - 75 took place in 2005, and the least - 20 in 2009. The data has a declining trend.
 When looking into fire subcategories, the most incidents belonged to: Outside Fires (50.0%), and Structure Fires (23.7%).