Estimated zip code population in 2022: 16,960 Zip code population in 2010: 16,697 Zip code population in 2000: 17,403
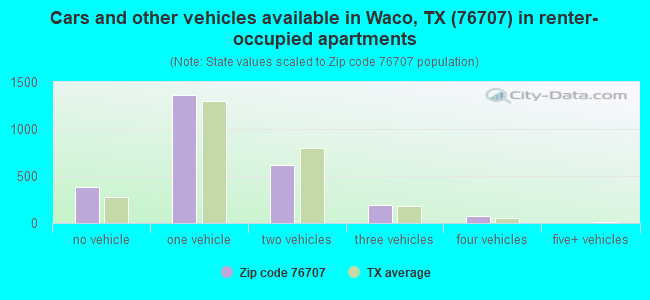
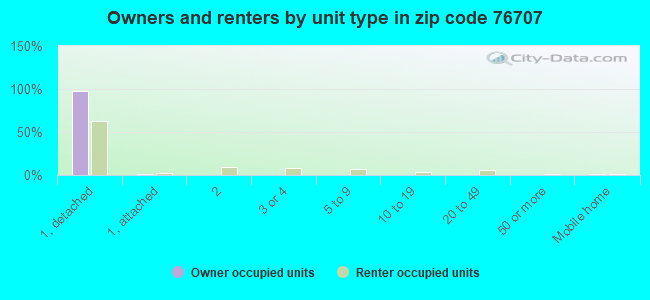
Houses and condos: 7,008 Renter-occupied apartments: 2,609
% of renters here:
44%
State:
38%
March 2022 cost of living index in zip code 76707: 84.7 (less than average, U.S. average is 100)
Land area: 3.3 sq. mi. Water area: 0.0 sq. mi.
Population density: 5,195 people per square mile
(average).
OSM Map
General Map
Google Map
MSN Map
OSM Map
General Map
Google Map
MSN Map
OSM Map
General Map
Google Map
MSN Map
OSM Map
General Map
Google Map
MSN Map
Please wait while loading the map...
Real estate property taxes paid for housing units in 2022:
This zip code:
1.7% ($1,920)
Texas:
1.5% ($4,050)
Median real estate property taxes paid for housing units with mortgages in 2022: $2,355 (1.7%) Median real estate property taxes paid for housing units with no mortgage in 2022: $1,671 (1.6%)
Averages for the 2020 tax year for zip code 76707, filed in 2021:
Average Adjusted Gross Income (AGI) in 2020: $31,788 (Individual Income Tax Returns)
Here:
$31,788
State:
$77,054
Salary/wage: $29,821 (reported on 89.3% of returns)
Here:
$29,821
State:
$62,766
(% of AGI for various income ranges: 1279.4% for AGIs below $25k, 3751.0% for AGIs $25k-50k, 6506.9% for AGIs $50k-75k, 9791.8% for AGIs $75k-100k, 16319.0% for AGIs $100k-200k)
Taxable interest for individuals: $408 (reported on 9.5% of returns)
This zip code:
$408
Texas:
$2,665
(% of AGI for various income ranges: 1.6% for AGIs below $25k, 2.1% for AGIs $25k-50k, 6.5% for AGIs $50k-75k, 25.3% for AGIs $75k-100k, 100.0% for AGIs $100k-200k)
Ordinary dividends: $2,546 (reported on 3.5% of returns)
Here:
$2,546
State:
$10,044
(% of AGI for various income ranges: 2.5% for AGIs below $25k, 2.2% for AGIs $25k-50k, 18.3% for AGIs $50k-75k, 101.2% for AGIs $75k-100k, 226.0% for AGIs $100k-200k)
Net capital gain/loss in AGI: +$9,973 (reported on 3.8% of returns)
Here:
+$9,973
State:
+$39,590
(% of AGI for various income ranges: 1.8% for AGIs below $25k, 7.0% for AGIs $25k-50k, 46.3% for AGIs $50k-75k, 187.1% for AGIs $75k-100k, 1837.0% for AGIs $100k-200k)
Profit/loss from business: +$9,716 (reported on 14.8% of returns)
Here:
+$9,716
State:
+$10,888
(% of AGI for various income ranges: 128.9% for AGIs below $25k, 124.7% for AGIs $25k-50k, 188.7% for AGIs $50k-75k, 498.2% for AGIs $75k-100k, 1944.0% for AGIs $100k-200k)
Taxable individual retirement arrangement distribution: $10,569 (reported on 2.3% of returns)
76707:
$10,569
Texas:
$24,740
(% of AGI for various income ranges: 13.2% for AGIs below $25k, 16.0% for AGIs $25k-50k, 56.5% for AGIs $50k-75k, 416.5% for AGIs $75k-100k)
Total itemized deductions: $31,957 (reported on 1.0% of returns)
Here:
$31,957
State:
$40,428
(% of AGI for various income ranges: 19.9% for AGIs below $25k, 119.6% for AGIs $50k-75k, 1041.0% for AGIs $100k-200k)
Charity contributions: $13,667 (reported on 0.9% of returns)
Here:
$13,667
State:
$18,201
(% of AGI for various income ranges: 45.4% for AGIs $50k-75k, 575.0% for AGIs $100k-200k)
Taxes paid: $5,814 (reported on 1.0% of returns)
76707:
$5,814
State:
$7,821
(% of AGI for various income ranges: 33.7% for AGIs $50k-75k, 225.0% for AGIs $100k-200k)
Earned income credit: $2,759 (reported on 36.4% of returns)
Here:
$2,759
State:
$2,584
(% of AGI for various income ranges: 170.7% for AGIs below $25k, 110.2% for AGIs $25k-50k)
Percentage of individuals using paid preparers for their 2020 taxes: 91.2%
Here:
91%
State:
92%
(% for various income ranges: 91.4% for AGIs below $25k, 91.5% for AGIs $25k-50k, 91.2% for AGIs $50k-75k, 87.5% for AGIs $75k-100k, 93.8% for AGIs $100k-200k, 66.7% for AGIs over 200k)
Averages for the 2012 tax year for zip code 76707, filed in 2013:
Average Adjusted Gross Income (AGI) in 2012: $25,050 (Individual Income Tax Returns)
Here:
$25,050
State:
$65,384
Salary/wage: $23,603 (reported on 91.1% of returns)
Here:
$23,603
State:
$52,524
(% of AGI for various income ranges: 86.9% for AGIs below $25k, 91.3% for AGIs $25k-50k, 84.8% for AGIs $50k-75k, 82.1% for AGIs $75k-100k, 63.0% for AGIs $100k-200k)
Taxable interest for individuals: $583 (reported on 8.4% of returns)
This zip code:
$583
Texas:
$2,372
(% of AGI for various income ranges: 0.2% for AGIs below $25k, 0.1% for AGIs $25k-50k, 0.3% for AGIs $50k-75k, 0.3% for AGIs $100k-200k)
Ordinary dividends: $3,642 (reported on 3.7% of returns)
Here:
$3,642
State:
$9,721
(% of AGI for various income ranges: 0.8% for AGIs below $25k, 0.4% for AGIs $25k-50k, 0.4% for AGIs $50k-75k, 1.0% for AGIs $75k-100k, 0.2% for AGIs $100k-200k)
Net capital gain/loss in AGI: +$660 (reported on 2.3% of returns)
Here:
+$660
State:
+$35,319
(% of AGI for various income ranges: 0.2% for AGIs $50k-75k)
Profit/loss from business: +$9,119 (reported on 12.0% of returns)
Here:
+$9,119
State:
+$13,732
(% of AGI for various income ranges: 7.3% for AGIs below $25k, 2.2% for AGIs $25k-50k, 2.9% for AGIs $50k-75k, 7.1% for AGIs $100k-200k)
Taxable individual retirement arrangement distribution: $8,031 (reported on 2.5% of returns)
76707:
$8,031
Texas:
$19,511
(% of AGI for various income ranges: 0.6% for AGIs below $25k, 0.5% for AGIs $25k-50k, 1.2% for AGIs $50k-75k, 3.8% for AGIs $75k-100k)
Total itemized deductions: $15,287 (24% of AGI, reported on 4.8% of returns)
Here:
$15,287
State:
$24,724
Here:
24.4% of AGI
State:
15.9% of AGI
(% of AGI for various income ranges: 1.6% for AGIs below $25k, 2.1% for AGIs $25k-50k, 5.4% for AGIs $50k-75k, 4.4% for AGIs $75k-100k, 7.0% for AGIs $100k-200k)
Charity contributions: $5,888 (reported on 3.7% of returns)
Here:
$5,888
State:
$6,808
(% of AGI for various income ranges: 0.1% for AGIs below $25k, 0.7% for AGIs $25k-50k, 1.7% for AGIs $50k-75k, 1.5% for AGIs $75k-100k, 3.0% for AGIs $100k-200k)
Taxes paid: $3,321 (reported on 4.5% of returns)
76707:
$3,321
State:
$6,921
(% of AGI for various income ranges: 0.2% for AGIs below $25k, 0.4% for AGIs $25k-50k, 1.1% for AGIs $50k-75k, 1.0% for AGIs $75k-100k, 1.8% for AGIs $100k-200k)
Earned income credit: $2,716 (reported on 45.2% of returns)
Here:
$2,716
State:
$2,570
(% of AGI for various income ranges: 11.7% for AGIs below $25k, 2.4% for AGIs $25k-50k)
Percentage of individuals using paid preparers for their 2012 taxes: 44.6%
Here:
45%
State:
51%
(% for various income ranges: 45.0% for AGIs below $25k, 44.5% for AGIs $25k-50k, 41.0% for AGIs $50k-75k, 36.4% for AGIs $75k-100k, 50.0% for AGIs $100k-200k)
Averages for the 2004 tax year for zip code 76707, filed in 2005:
Average Adjusted Gross Income (AGI) in 2004: $21,472 (Individual Income Tax Returns)
Here:
$21,472
State:
$47,881
Salary/wage: $20,194 (reported on 92.4% of returns)
Here:
$20,194
State:
$41,947
(% of AGI for various income ranges: 96.8% for AGIs below $10k, 90.4% for AGIs $10k-25k, 91.1% for AGIs $25k-50k, 83.7% for AGIs $50k-75k, 75.9% for AGIs $75k-100k, 54.6% for AGIs over 100k)
Taxable interest for individuals: $1,095 (reported on 14.0% of returns)
This zip code:
$1,095
Texas:
$2,255
(% of AGI for various income ranges: 0.9% for AGIs below $10k, 0.6% for AGIs $10k-25k, 0.5% for AGIs $25k-50k, 1.3% for AGIs $50k-75k, 2.1% for AGIs $75k-100k, 0.2% for AGIs over 100k)
Taxable dividends: $1,143 (reported on 4.6% of returns)
Here:
$1,143
State:
$4,261
(% of AGI for various income ranges: 0.4% for AGIs below $10k, 0.2% for AGIs $10k-25k, 0.2% for AGIs $25k-50k, 0.3% for AGIs $50k-75k, 0.3% for AGIs $75k-100k, 0.4% for AGIs over 100k)
Net capital gain/loss: +$3,264 (reported on 3.4% of returns)
Here:
+$3,264
State:
+$16,110
(% of AGI for various income ranges: -0.2% for AGIs below $10k, -0.1% for AGIs $10k-25k, 0.2% for AGIs $25k-50k, 0.5% for AGIs $50k-75k, 2.8% for AGIs $75k-100k, 3.9% for AGIs over 100k)
Profit/loss from business: +$7,020 (reported on 9.4% of returns)
Here:
+$7,020
State:
+$11,013
(% of AGI for various income ranges: 6.0% for AGIs below $10k, 4.0% for AGIs $10k-25k, 2.0% for AGIs $25k-50k, 2.4% for AGIs $50k-75k, 0.5% for AGIs $75k-100k, 4.8% for AGIs over 100k)
IRA payment deduction: $2,081 (reported on 0.6% of returns)
76707:
$2,081
Texas:
$3,120
Total itemized deductions: $14,453 (25% of AGI, reported on 4.7% of returns)
Here:
$14,453
State:
$19,631
Here:
24.9% of AGI
State:
18.9% of AGI
(% of AGI for various income ranges: 1.5% for AGIs $10k-25k, 3.2% for AGIs $25k-50k, 4.8% for AGIs $50k-75k, 6.9% for AGIs $75k-100k, 7.7% for AGIs over 100k)
Charity contributions deductions: $5,789 (9% of AGI, reported on 3.7% of returns)
Here:
$5,789
State:
$4,753
Here:
9.3% of AGI
State:
4.2% of AGI
(% of AGI for various income ranges: 0.3% for AGIs $10k-25k, 0.8% for AGIs $25k-50k, 1.5% for AGIs $50k-75k, 2.6% for AGIs $75k-100k, 3.7% for AGIs over 100k)
Total tax: $2,668 (reported on 47.8% of returns)
76707:
$2,668
State:
$9,058
(% of AGI for various income ranges: 1.8% for AGIs below $10k, 2.6% for AGIs $10k-25k, 5.2% for AGIs $25k-50k, 9.2% for AGIs $50k-75k, 11.9% for AGIs $75k-100k, 18.5% for AGIs over 100k)
Earned income credit: $2,118 (reported on 47.6% of returns)
Here:
$2,118
State:
$2,024
Percentage of individuals using paid preparers for their 2004 taxes: 59.7%
Here:
60%
State:
57%
(% for various income ranges: 60.8% for AGIs below $10k, 63.3% for AGIs $10k-25k, 54.7% for AGIs $25k-50k, 49.5% for AGIs $50k-75k, 46.9% for AGIs $75k-100k, 51.1% for AGIs over 100k)
Likely homosexual households (counted as self-reported same-sex unmarried-partner households)
Lesbian couples: 0.6% of all households
Gay men: 0.4% of all households
Household received Food Stamps/SNAP in the past 12 months: 1,584 Household did not receive Food Stamps/SNAP in the past 12 months: 4,434
Women who had a birth in the past 12 months: 291 (161 now married, 128 unmarried) Women who did not have a birth in the past 12 months: 4,277 (1,236 now married, 3,061 unmarried)
Housing units in zip code 76707 with a mortgage: 1,479 (54 second mortgage, 33 both second mortgage and home equity loan) Houses without a mortgage: 44
Median monthly owner costs for units with a mortgage: $1,086 Median monthly owner costs for units without a mortgage: $506
Residents with income below the poverty level in 2022:
This zip code:
34.1%
Whole state:
14.0%
Residents with income below 50% of the poverty level in 2022:
This zip code:
23.2%
Whole state:
7.4%
Median number of rooms in houses and condos:
Here:
5.8
State:
6.3
Median number of rooms in apartments:
Here:
4.8
State:
4.0
Notable locations in this zip code not listed on our city pages
Churches in zip code 76707 include: Trinity Church (A), Brookview Church (B), Calvary Church (C), Grace Temple Church (D), Greater Mount Carmel Church (E), Highland Church (F), Lovers Leap Church (G), Saint Johns Church (H), Greater Mount Carmel Church (I). Display/hide their locations on the map
1,795 married couples with children.
2,180 single-parent households (222 men, 1,958 women).
62.4% of residents of 76707 zip code speak English at home.
36.2% of residents speak Spanish at home (22% very well, 48% well, 17% not well, 13% not at all).
0.6% of residents speak Asian or Pacific Island language at home (85% very well, 15% well).
0.1% of residents speak other language at home (100% very well).
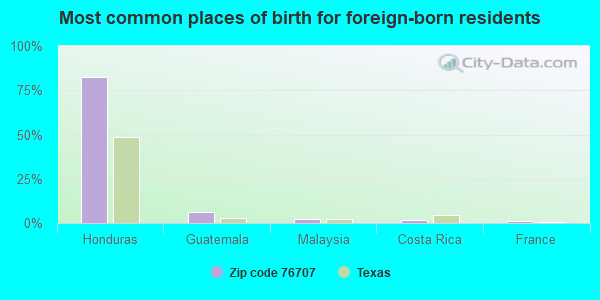
Foreign born population: 3,002 (17.7%) (15.6% of them are naturalized citizens)
Housing units lacking complete plumbing facilities: 2.9% Housing units lacking complete kitchen facilities: 4.9%
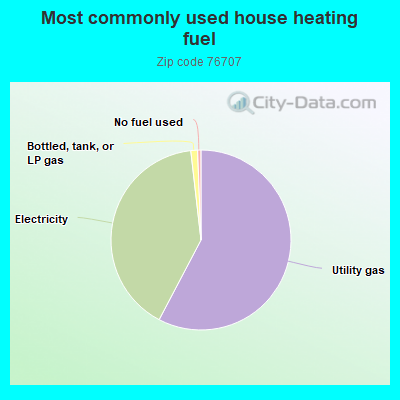
57.7%Utility gas
40.5%Electricity
1.2%Bottled, tank, or LP gas
0.6%No fuel used
Population in 1990: 15,905. Population change in the 1990s: +1,498 (+9.4%).
Place of birth for U.S.-born residents:
This state: 12,033
Northeast: 174
Midwest: 514
South: 433
West: 451
48% of the 76707 zip code residents lived in the same house 5 years ago. Out of people who lived in different houses, 72% lived in this county. Out of people who lived in different counties, 50% lived in Texas.
90% of the 76707 zip code residents lived in the same house 1 year ago. Out of people who lived in different houses, 74% moved from this county. Out of people who lived in different houses, 15% moved from different county within same state. Out of people who lived in different houses, 5% moved from different state. Out of people who lived in different houses, 3% moved from abroad.
Private vs. public school enrollment:
Students in private schools in grades 1 to 8 (elementary and middle school): 59
Here:
3.0%
Texas:
8.8%
Students in private schools in grades 9 to 12 (high school): 23
Here:
2.0%
Texas:
8.0%
Students in private undergraduate colleges: 80
Here:
12.0%
Texas:
16.2%
Occupation by median earnings in the past 12 months ($)
57,808Health diagnosing and treating practitioners and other technical occupations
47,351Business and financial operations occupations
42,306Computer and mathematical occupations
41,719Management occupations
38,918Installation, maintenance, and repair occupations
35,494Transportation occupations
Top industries in this zip code by the number of employees in 2005:
Health Care and Social Assistance: Offices of Physicians (except Mental Health Specialists) (250-499 employees: 1 establishment)
Other Services (except Public Administration): Religious Organizations (50-99: 3, 20-49: 1, 10-19: 1, 5-9: 2, 1-4: 6)
Real Estate and Rental and Leasing: Lessors of Nonfinancial Intangible Assets (except Copyrighted Works) (100-249: 1, 10-19: 2)
Health Care and Social Assistance: Nursing Care Facilities (100-249: 1)
Wholesale Trade: Women's, Children's, and Infants' Clothing and Accessories Merchant Wholesalers (100-249: 1)
Other Services (except Public Administration): Civic and Social Organizations (20-49: 2, 10-19: 2, 1-4: 5)
Health Care and Social Assistance: Other Individual and Family Services (20-49: 3)
Administrative and Support and Waste Management and Remediation Services: Temporary Help Services (50-99: 1)
People in group quarters in 2010:
161 people in nursing facilities/skilled-nursing facilities
24 people in other noninstitutional facilities
7 people in group homes intended for adults
7 people in residential treatment centers for adults
7 people in workers' group living quarters and job corps centers
People in group quarters in 2000:
201 people in orthopedic wards and institutions for the physically handicapped
194 people in nursing homes
39 people in other noninstitutional group quarters
10 people in homes for the mentally ill
9 people in hospitals/wards and hospices for chronically ill
9 people in hospices or homes for chronically ill
Fatal accident statistics in 2014:
Fatal accident count: 1
Vehicles involved in fatal accidents: 1
Fatal accidents caused by drunken drivers: 0
Fatalities: 1
Persons involved in fatal accidents: 2
Pedestrians involved in fatal accidents: 0
Fatal accident statistics in 2012:
Fatal accident count: 1
Vehicles involved in fatal accidents: 2
Fatal accidents caused by drunken drivers: 0
Fatalities: 1
Persons involved in fatal accidents: 2
Pedestrians involved in fatal accidents: 0
Home Mortgage Disclosure Act Aggregated Statistics For Year 2009 (Based on 1 full and 12 partial tracts)
A) FHA, FSA/RHS & VA Home Purchase Loans
B) Conventional Home Purchase Loans
C) Refinancings
D) Home Improvement Loans
F) Non-occupant Loans on < 5 Family Dwellings (A B C & D)
Number
Average Value
Number
Average Value
Number
Average Value
Number
Average Value
Number
Average Value
LOANS ORIGINATED
55
$81,862
90
$61,335
96
$60,121
21
$25,763
86
$49,813
APPLICATIONS APPROVED, NOT ACCEPTED
3
$108,167
4
$35,632
9
$52,321
2
$13,655
1
$34,000
APPLICATIONS DENIED
8
$96,034
14
$58,302
51
$67,472
34
$20,595
5
$33,886
APPLICATIONS WITHDRAWN
12
$92,772
6
$72,890
31
$85,956
7
$29,297
1
$29,330
FILES CLOSED FOR INCOMPLETENESS
1
$79,000
0
$0
8
$75,765
0
$0
0
$0
Aggregated Statistics For Year 2008 (Based on 1 full and 12 partial tracts)
A) FHA, FSA/RHS & VA Home Purchase Loans
B) Conventional Home Purchase Loans
C) Refinancings
D) Home Improvement Loans
E) Loans on Dwellings For 5+ Families
F) Non-occupant Loans on < 5 Family Dwellings (A B C & D)
G) Loans On Manufactured Home Dwelling (A B C & D)
Number
Average Value
Number
Average Value
Number
Average Value
Number
Average Value
Number
Average Value
Number
Average Value
Number
Average Value
LOANS ORIGINATED
74
$67,870
121
$55,024
100
$55,829
37
$25,841
5
$129,760
116
$40,559
1
$50,170
APPLICATIONS APPROVED, NOT ACCEPTED
2
$52,095
5
$79,100
17
$58,000
3
$13,863
0
$0
4
$75,990
0
$0
APPLICATIONS DENIED
6
$92,812
19
$45,073
120
$54,994
62
$29,742
0
$0
19
$42,625
0
$0
APPLICATIONS WITHDRAWN
11
$68,933
7
$119,844
38
$68,709
17
$40,694
0
$0
8
$63,919
0
$0
FILES CLOSED FOR INCOMPLETENESS
0
$0
4
$75,745
4
$109,020
3
$10,387
0
$0
1
$162,130
0
$0
Aggregated Statistics For Year 2007 (Based on 1 full and 12 partial tracts)
A) FHA, FSA/RHS & VA Home Purchase Loans
B) Conventional Home Purchase Loans
C) Refinancings
D) Home Improvement Loans
E) Loans on Dwellings For 5+ Families
F) Non-occupant Loans on < 5 Family Dwellings (A B C & D)
G) Loans On Manufactured Home Dwelling (A B C & D)
Number
Average Value
Number
Average Value
Number
Average Value
Number
Average Value
Number
Average Value
Number
Average Value
Number
Average Value
LOANS ORIGINATED
54
$68,968
160
$53,267
115
$74,313
38
$31,040
3
$123,660
117
$60,334
0
$0
APPLICATIONS APPROVED, NOT ACCEPTED
1
$73,000
25
$47,103
35
$55,381
9
$21,722
0
$0
13
$49,503
1
$38,820
APPLICATIONS DENIED
7
$73,777
60
$64,351
154
$64,027
110
$29,289
0
$0
40
$66,650
5
$55,014
APPLICATIONS WITHDRAWN
4
$88,698
20
$86,342
81
$69,313
10
$34,911
0
$0
20
$67,202
0
$0
FILES CLOSED FOR INCOMPLETENESS
1
$71,770
3
$95,053
12
$83,812
0
$0
0
$0
2
$87,405
0
$0
Aggregated Statistics For Year 2006 (Based on 1 full and 12 partial tracts)
A) FHA, FSA/RHS & VA Home Purchase Loans
B) Conventional Home Purchase Loans
C) Refinancings
D) Home Improvement Loans
E) Loans on Dwellings For 5+ Families
F) Non-occupant Loans on < 5 Family Dwellings (A B C & D)
G) Loans On Manufactured Home Dwelling (A B C & D)
Number
Average Value
Number
Average Value
Number
Average Value
Number
Average Value
Number
Average Value
Number
Average Value
Number
Average Value
LOANS ORIGINATED
47
$69,710
295
$57,772
146
$53,845
71
$31,588
2
$315,930
176
$46,865
1
$30,100
APPLICATIONS APPROVED, NOT ACCEPTED
2
$36,840
35
$56,902
21
$48,912
5
$40,898
0
$0
6
$44,405
3
$35,473
APPLICATIONS DENIED
8
$60,560
124
$55,293
169
$57,546
114
$36,084
0
$0
53
$48,491
8
$45,110
APPLICATIONS WITHDRAWN
2
$59,105
43
$57,975
102
$64,394
17
$37,542
0
$0
17
$44,042
2
$15,350
FILES CLOSED FOR INCOMPLETENESS
1
$8,490
12
$80,528
18
$72,694
0
$0
0
$0
2
$17,365
0
$0
Aggregated Statistics For Year 2005 (Based on 1 full and 12 partial tracts)
A) FHA, FSA/RHS & VA Home Purchase Loans
B) Conventional Home Purchase Loans
C) Refinancings
D) Home Improvement Loans
E) Loans on Dwellings For 5+ Families
F) Non-occupant Loans on < 5 Family Dwellings (A B C & D)
G) Loans On Manufactured Home Dwelling (A B C & D)
Number
Average Value
Number
Average Value
Number
Average Value
Number
Average Value
Number
Average Value
Number
Average Value
Number
Average Value
LOANS ORIGINATED
37
$74,759
304
$48,268
164
$65,763
88
$47,661
1
$40,300
180
$55,764
0
$0
APPLICATIONS APPROVED, NOT ACCEPTED
3
$77,353
22
$50,406
33
$56,019
5
$18,570
0
$0
9
$56,994
0
$0
APPLICATIONS DENIED
5
$74,238
90
$50,489
196
$54,450
91
$29,013
0
$0
53
$44,914
9
$38,752
APPLICATIONS WITHDRAWN
5
$68,812
25
$76,269
111
$70,690
45
$136,186
0
$0
18
$55,299
2
$61,180
FILES CLOSED FOR INCOMPLETENESS
3
$51,203
5
$85,414
44
$63,077
4
$26,405
0
$0
5
$78,962
0
$0
Aggregated Statistics For Year 2004 (Based on 1 full and 12 partial tracts)
A) FHA, FSA/RHS & VA Home Purchase Loans
B) Conventional Home Purchase Loans
C) Refinancings
D) Home Improvement Loans
E) Loans on Dwellings For 5+ Families
F) Non-occupant Loans on < 5 Family Dwellings (A B C & D)
G) Loans On Manufactured Home Dwelling (A B C & D)
Number
Average Value
Number
Average Value
Number
Average Value
Number
Average Value
Number
Average Value
Number
Average Value
Number
Average Value
LOANS ORIGINATED
43
$67,383
228
$54,620
201
$54,338
57
$34,252
1
$148,480
150
$57,796
3
$36,053
APPLICATIONS APPROVED, NOT ACCEPTED
2
$37,045
27
$54,314
31
$43,192
5
$11,146
0
$0
7
$49,094
7
$52,960
APPLICATIONS DENIED
3
$56,947
64
$51,263
238
$48,085
69
$21,269
1
$91,600
39
$41,726
9
$59,543
APPLICATIONS WITHDRAWN
9
$50,842
22
$56,231
131
$50,751
11
$40,217
1
$45,000
9
$56,008
0
$0
FILES CLOSED FOR INCOMPLETENESS
1
$98,930
6
$66,958
45
$72,382
0
$0
0
$0
4
$68,480
0
$0
Aggregated Statistics For Year 2003 (Based on 1 full and 12 partial tracts)
A) FHA, FSA/RHS & VA Home Purchase Loans
B) Conventional Home Purchase Loans
C) Refinancings
D) Home Improvement Loans
E) Loans on Dwellings For 5+ Families
F) Non-occupant Loans on < 5 Family Dwellings (A B C & D)
Number
Average Value
Number
Average Value
Number
Average Value
Number
Average Value
Number
Average Value
Number
Average Value
LOANS ORIGINATED
64
$62,327
159
$53,122
253
$58,146
44
$22,908
2
$448,655
129
$37,871
APPLICATIONS APPROVED, NOT ACCEPTED
4
$56,455
7
$42,256
35
$47,174
5
$28,316
0
$0
10
$49,265
APPLICATIONS DENIED
9
$60,481
48
$54,604
285
$50,383
40
$23,666
1
$113,580
45
$40,153
APPLICATIONS WITHDRAWN
9
$54,733
16
$59,121
104
$60,231
1
$34,410
1
$236,170
14
$45,812
FILES CLOSED FOR INCOMPLETENESS
2
$101,185
3
$76,917
11
$52,033
2
$31,645
0
$0
3
$35,283
Aggregated Statistics For Year 2002 (Based on 1 full and 12 partial tracts)
A) FHA, FSA/RHS & VA Home Purchase Loans
B) Conventional Home Purchase Loans
C) Refinancings
D) Home Improvement Loans
E) Loans on Dwellings For 5+ Families
F) Non-occupant Loans on < 5 Family Dwellings (A B C & D)
Number
Average Value
Number
Average Value
Number
Average Value
Number
Average Value
Number
Average Value
Number
Average Value
LOANS ORIGINATED
57
$54,794
172
$43,027
103
$46,448
32
$16,023
3
$60,727
119
$33,981
APPLICATIONS APPROVED, NOT ACCEPTED
1
$48,620
13
$74,919
13
$34,838
3
$23,770
0
$0
8
$30,275
APPLICATIONS DENIED
9
$50,816
42
$53,562
117
$35,519
29
$18,033
0
$0
17
$40,504
APPLICATIONS WITHDRAWN
8
$52,989
7
$57,691
81
$46,775
3
$11,673
0
$0
8
$39,765
FILES CLOSED FOR INCOMPLETENESS
2
$46,210
8
$44,655
3
$65,973
0
$0
0
$0
1
$23,150
Aggregated Statistics For Year 2001 (Based on 1 full and 12 partial tracts)
A) FHA, FSA/RHS & VA Home Purchase Loans
B) Conventional Home Purchase Loans
C) Refinancings
D) Home Improvement Loans
F) Non-occupant Loans on < 5 Family Dwellings (A B C & D)
Number
Average Value
Number
Average Value
Number
Average Value
Number
Average Value
Number
Average Value
LOANS ORIGINATED
73
$49,434
202
$42,489
93
$38,627
34
$13,025
98
$31,109
APPLICATIONS APPROVED, NOT ACCEPTED
2
$49,590
8
$55,230
11
$32,788
4
$8,498
4
$20,935
APPLICATIONS DENIED
4
$55,245
71
$41,440
86
$31,744
40
$9,938
16
$23,979
APPLICATIONS WITHDRAWN
10
$48,272
17
$45,427
47
$35,592
10
$20,776
7
$33,833
FILES CLOSED FOR INCOMPLETENESS
2
$35,715
6
$39,180
6
$55,293
0
$0
2
$38,470
Aggregated Statistics For Year 2000 (Based on 1 full and 12 partial tracts)
A) FHA, FSA/RHS & VA Home Purchase Loans
B) Conventional Home Purchase Loans
C) Refinancings
D) Home Improvement Loans
E) Loans on Dwellings For 5+ Families
F) Non-occupant Loans on < 5 Family Dwellings (A B C & D)
Number
Average Value
Number
Average Value
Number
Average Value
Number
Average Value
Number
Average Value
Number
Average Value
LOANS ORIGINATED
55
$53,838
196
$37,863
51
$32,947
25
$12,872
2
$2,174,385
80
$30,702
APPLICATIONS APPROVED, NOT ACCEPTED
5
$63,740
32
$41,095
16
$30,519
4
$12,792
0
$0
7
$37,193
APPLICATIONS DENIED
5
$64,394
93
$37,842
55
$27,726
39
$12,332
0
$0
16
$25,819
APPLICATIONS WITHDRAWN
8
$52,010
13
$63,072
51
$34,209
1
$9,160
0
$0
10
$29,963
FILES CLOSED FOR INCOMPLETENESS
0
$0
7
$46,441
26
$42,510
0
$0
0
$0
1
$17,750
Aggregated Statistics For Year 1999 (Based on 2 full and 5 partial tracts)
A) FHA, FSA/RHS & VA Home Purchase Loans
B) Conventional Home Purchase Loans
C) Refinancings
D) Home Improvement Loans
F) Non-occupant Loans on < 5 Family Dwellings (A B C & D)
2003 - 2018 National Fire Incident Reporting System (NFIRS) incidents
Based on the data from the years 2003 - 2018 the average number of fire incidents per year is 86. The highest number of reported fire incidents - 108 took place in 2018, and the least - 57 in 2009. The data has an increasing trend.
When looking into fire subcategories, the most incidents belonged to: Structure Fires (40.4%), and Outside Fires (39.1%).
Fire incident types reported to NFIRS in Zip Code 76707


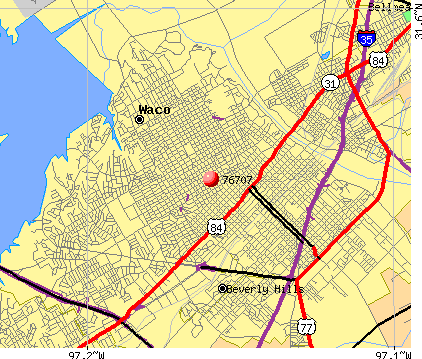 Nearest zip codes: 76701, 76704, 76710, 76798, 76711, 76705.


 Based on the data from the years 2003 - 2018 the average number of fire incidents per year is 86. The highest number of reported fire incidents - 108 took place in 2018, and the least - 57 in 2009. The data has an increasing trend.
 When looking into fire subcategories, the most incidents belonged to: Structure Fires (40.4%), and Outside Fires (39.1%).