Estimated zip code population in 2022: 32,844 Zip code population in 2010: 29,155 Zip code population in 2000: 27,843
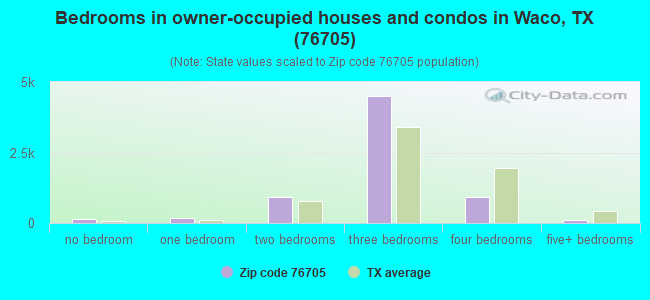
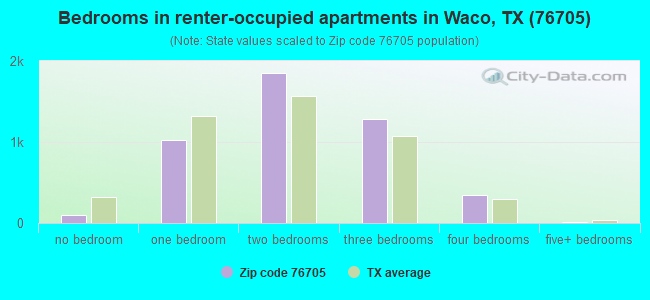
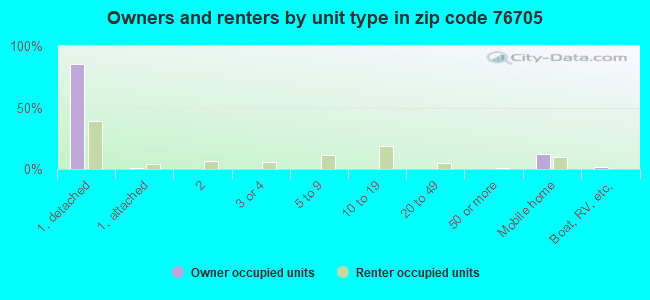
Houses and condos: 12,682 Renter-occupied apartments: 4,669
% of renters here:
41%
State:
38%
March 2022 cost of living index in zip code 76705: 84.3 (less than average, U.S. average is 100)
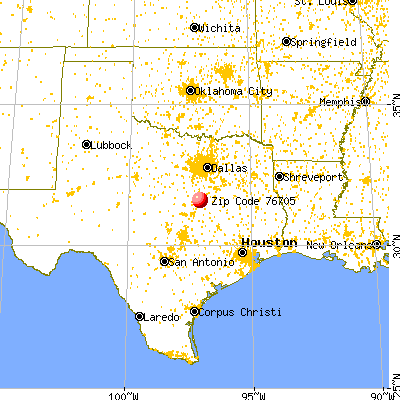
Land area: 114.3 sq. mi. Water area: 4.2 sq. mi.
Population density: 287 people per square mile
(very low).
OSM Map
General Map
Google Map
MSN Map
OSM Map
General Map
Google Map
MSN Map
OSM Map
General Map
Google Map
MSN Map
OSM Map
General Map
Google Map
MSN Map
Please wait while loading the map...
Real estate property taxes paid for housing units in 2022:
This zip code:
1.3% ($2,200)
Texas:
1.5% ($4,050)
Median real estate property taxes paid for housing units with mortgages in 2022: $2,673 (1.4%) Median real estate property taxes paid for housing units with no mortgage in 2022: $1,685 (1.1%)
Averages for the 2020 tax year for zip code 76705, filed in 2021:
Average Adjusted Gross Income (AGI) in 2020: $42,326 (Individual Income Tax Returns)
Here:
$42,326
State:
$77,054
Salary/wage: $36,759 (reported on 85.4% of returns)
Here:
$36,759
State:
$62,766
(% of AGI for various income ranges: 1213.6% for AGIs below $25k, 3540.4% for AGIs $25k-50k, 6344.0% for AGIs $50k-75k, 9352.4% for AGIs $75k-100k, 15761.5% for AGIs $100k-200k, 64253.3% for AGIs over 200k)
Taxable interest for individuals: $1,024 (reported on 16.7% of returns)
This zip code:
$1,024
Texas:
$2,665
(% of AGI for various income ranges: 8.3% for AGIs below $25k, 7.9% for AGIs $25k-50k, 22.5% for AGIs $50k-75k, 52.7% for AGIs $75k-100k, 69.4% for AGIs $100k-200k, 2130.0% for AGIs over 200k)
Ordinary dividends: $3,269 (reported on 5.7% of returns)
Here:
$3,269
State:
$10,044
(% of AGI for various income ranges: 5.8% for AGIs below $25k, 8.2% for AGIs $25k-50k, 19.1% for AGIs $50k-75k, 43.5% for AGIs $75k-100k, 82.5% for AGIs $100k-200k, 3330.0% for AGIs over 200k)
Net capital gain/loss in AGI: +$16,760 (reported on 5.9% of returns)
Here:
+$16,760
State:
+$39,590
(% of AGI for various income ranges: 4.6% for AGIs below $25k, 11.7% for AGIs $25k-50k, 56.4% for AGIs $50k-75k, 127.1% for AGIs $75k-100k, 665.4% for AGIs $100k-200k, 25296.7% for AGIs over 200k)
Profit/loss from business: +$9,599 (reported on 14.9% of returns)
Here:
+$9,599
State:
+$10,888
(% of AGI for various income ranges: 91.0% for AGIs below $25k, 144.0% for AGIs $25k-50k, 157.1% for AGIs $50k-75k, 442.1% for AGIs $75k-100k, 553.3% for AGIs $100k-200k, 7653.3% for AGIs over 200k)
Taxable individual retirement arrangement distribution: $13,744 (reported on 4.8% of returns)
76705:
$13,744
Texas:
$24,740
(% of AGI for various income ranges: 23.1% for AGIs below $25k, 48.2% for AGIs $25k-50k, 99.9% for AGIs $50k-75k, 251.1% for AGIs $75k-100k, 652.9% for AGIs $100k-200k)
Total itemized deductions: $32,857 (reported on 2.3% of returns)
Here:
$32,857
State:
$40,428
(% of AGI for various income ranges: 49.9% for AGIs $25k-50k, 84.0% for AGIs $50k-75k, 180.0% for AGIs $75k-100k, 609.4% for AGIs $100k-200k, 10126.7% for AGIs over 200k)
Charity contributions: $15,452 (reported on 1.9% of returns)
Here:
$15,452
State:
$18,201
(% of AGI for various income ranges: 9.9% for AGIs $25k-50k, 24.1% for AGIs $50k-75k, 33.9% for AGIs $75k-100k, 218.8% for AGIs $100k-200k, 6520.0% for AGIs over 200k)
Taxes paid: $5,955 (reported on 2.2% of returns)
76705:
$5,955
State:
$7,821
(% of AGI for various income ranges: 9.5% for AGIs $25k-50k, 16.4% for AGIs $50k-75k, 39.2% for AGIs $75k-100k, 120.6% for AGIs $100k-200k, 1236.7% for AGIs over 200k)
Earned income credit: $2,620 (reported on 27.7% of returns)
Here:
$2,620
State:
$2,584
(% of AGI for various income ranges: 132.9% for AGIs below $25k, 102.1% for AGIs $25k-50k, 1.6% for AGIs $50k-75k)
Percentage of individuals using paid preparers for their 2020 taxes: 92.1%
Here:
92%
State:
92%
(% for various income ranges: 91.7% for AGIs below $25k, 93.1% for AGIs $25k-50k, 91.6% for AGIs $50k-75k, 90.9% for AGIs $75k-100k, 91.2% for AGIs $100k-200k, 100.0% for AGIs over 200k)
Averages for the 2012 tax year for zip code 76705, filed in 2013:
Average Adjusted Gross Income (AGI) in 2012: $33,895 (Individual Income Tax Returns)
Here:
$33,895
State:
$65,384
Salary/wage: $30,284 (reported on 88.7% of returns)
Here:
$30,284
State:
$52,524
(% of AGI for various income ranges: 84.6% for AGIs below $25k, 86.0% for AGIs $25k-50k, 79.5% for AGIs $50k-75k, 78.4% for AGIs $75k-100k, 73.0% for AGIs $100k-200k, 44.9% for AGIs over 200k)
Taxable interest for individuals: $912 (reported on 18.9% of returns)
This zip code:
$912
Texas:
$2,372
(% of AGI for various income ranges: 0.5% for AGIs below $25k, 0.3% for AGIs $25k-50k, 0.5% for AGIs $50k-75k, 0.4% for AGIs $75k-100k, 0.6% for AGIs $100k-200k, 1.1% for AGIs over 200k)
Ordinary dividends: $4,000 (reported on 6.3% of returns)
Here:
$4,000
State:
$9,721
(% of AGI for various income ranges: 0.6% for AGIs below $25k, 0.3% for AGIs $25k-50k, 0.3% for AGIs $50k-75k, 0.5% for AGIs $75k-100k, 0.5% for AGIs $100k-200k, 5.5% for AGIs over 200k)
Net capital gain/loss in AGI: +$11,446 (reported on 4.4% of returns)
Here:
+$11,446
State:
+$35,319
(% of AGI for various income ranges: 0.2% for AGIs below $25k, 0.1% for AGIs $25k-50k, 0.6% for AGIs $50k-75k, 1.1% for AGIs $75k-100k, 0.7% for AGIs $100k-200k, 17.0% for AGIs over 200k)
Profit/loss from business: +$8,007 (reported on 12.9% of returns)
Here:
+$8,007
State:
+$13,732
(% of AGI for various income ranges: 5.2% for AGIs below $25k, 2.0% for AGIs $25k-50k, 2.8% for AGIs $50k-75k, 1.9% for AGIs $75k-100k, 5.0% for AGIs $100k-200k)
Taxable individual retirement arrangement distribution: $10,287 (reported on 5.7% of returns)
76705:
$10,287
Texas:
$19,511
(% of AGI for various income ranges: 1.6% for AGIs below $25k, 1.1% for AGIs $25k-50k, 2.0% for AGIs $50k-75k, 2.0% for AGIs $75k-100k, 3.4% for AGIs $100k-200k)
Total itemized deductions: $18,129 (23% of AGI, reported on 9.5% of returns)
Here:
$18,129
State:
$24,724
Here:
22.8% of AGI
State:
15.9% of AGI
(% of AGI for various income ranges: 2.5% for AGIs below $25k, 4.1% for AGIs $25k-50k, 5.7% for AGIs $50k-75k, 6.8% for AGIs $75k-100k, 8.1% for AGIs $100k-200k, 6.0% for AGIs over 200k)
Charity contributions: $6,365 (reported on 6.7% of returns)
Here:
$6,365
State:
$6,808
(% of AGI for various income ranges: 0.3% for AGIs below $25k, 0.7% for AGIs $25k-50k, 1.2% for AGIs $50k-75k, 1.9% for AGIs $75k-100k, 2.7% for AGIs $100k-200k, 2.6% for AGIs over 200k)
Taxes paid: $3,906 (reported on 9.0% of returns)
76705:
$3,906
State:
$6,921
(% of AGI for various income ranges: 0.4% for AGIs below $25k, 0.8% for AGIs $25k-50k, 1.1% for AGIs $50k-75k, 1.4% for AGIs $75k-100k, 1.9% for AGIs $100k-200k, 1.5% for AGIs over 200k)
Earned income credit: $2,538 (reported on 33.3% of returns)
Here:
$2,538
State:
$2,570
(% of AGI for various income ranges: 9.7% for AGIs below $25k, 1.9% for AGIs $25k-50k)
Percentage of individuals using paid preparers for their 2012 taxes: 45.1%
Here:
45%
State:
51%
(% for various income ranges: 43.4% for AGIs below $25k, 44.5% for AGIs $25k-50k, 50.0% for AGIs $50k-75k, 48.3% for AGIs $75k-100k, 51.2% for AGIs $100k-200k, 83.3% for AGIs over 200k)
Averages for the 2004 tax year for zip code 76705, filed in 2005:
Average Adjusted Gross Income (AGI) in 2004: $28,654 (Individual Income Tax Returns)
Here:
$28,654
State:
$47,881
Salary/wage: $26,520 (reported on 88.9% of returns)
Here:
$26,520
State:
$41,947
(% of AGI for various income ranges: 105.7% for AGIs below $10k, 85.3% for AGIs $10k-25k, 86.6% for AGIs $25k-50k, 83.4% for AGIs $50k-75k, 80.5% for AGIs $75k-100k, 57.1% for AGIs over 100k)
Taxable interest for individuals: $1,121 (reported on 26.4% of returns)
This zip code:
$1,121
Texas:
$2,255
(% of AGI for various income ranges: 2.0% for AGIs below $10k, 1.1% for AGIs $10k-25k, 0.6% for AGIs $25k-50k, 0.7% for AGIs $50k-75k, 1.3% for AGIs $75k-100k, 2.2% for AGIs over 100k)
Taxable dividends: $2,318 (reported on 8.3% of returns)
Here:
$2,318
State:
$4,261
(% of AGI for various income ranges: 0.9% for AGIs below $10k, 0.7% for AGIs $10k-25k, 0.9% for AGIs $25k-50k, 0.3% for AGIs $50k-75k, 0.3% for AGIs $75k-100k, 0.8% for AGIs over 100k)
Net capital gain/loss: +$4,323 (reported on 6.5% of returns)
Here:
+$4,323
State:
+$16,110
(% of AGI for various income ranges: -0.2% for AGIs below $10k, 0.2% for AGIs $10k-25k, 0.3% for AGIs $25k-50k, 0.4% for AGIs $50k-75k, 1.5% for AGIs $75k-100k, 5.4% for AGIs over 100k)
Profit/loss from business: +$5,872 (reported on 12.5% of returns)
Here:
+$5,872
State:
+$11,013
(% of AGI for various income ranges: 2.6% for AGIs below $10k, 3.5% for AGIs $10k-25k, 2.2% for AGIs $25k-50k, 2.3% for AGIs $50k-75k, 1.7% for AGIs $75k-100k, 3.1% for AGIs over 100k)
IRA payment deduction: $2,733 (reported on 1.1% of returns)
76705:
$2,733
Texas:
$3,120
(% of AGI for various income ranges: 0.1% for AGIs $10k-25k, 0.1% for AGIs $25k-50k, 0.1% for AGIs $50k-75k, 0.2% for AGIs $75k-100k)
Self-employed pension: $4,438 (reported on 0.1% of returns)
Here:
$4,438
Texas:
$16,401
Total itemized deductions: $16,995 (26% of AGI, reported on 10.3% of returns)
Here:
$16,995
State:
$19,631
Here:
26.3% of AGI
State:
18.9% of AGI
(% of AGI for various income ranges: 3.1% for AGIs below $10k, 2.5% for AGIs $10k-25k, 4.7% for AGIs $25k-50k, 6.1% for AGIs $50k-75k, 8.6% for AGIs $75k-100k, 14.4% for AGIs over 100k)
Charity contributions deductions: $4,933 (7% of AGI, reported on 8.2% of returns)
Here:
$4,933
State:
$4,753
Here:
7.3% of AGI
State:
4.2% of AGI
(% of AGI for various income ranges: 0.2% for AGIs below $10k, 0.4% for AGIs $10k-25k, 0.9% for AGIs $25k-50k, 1.5% for AGIs $50k-75k, 2.5% for AGIs $75k-100k, 3.5% for AGIs over 100k)
Total tax: $3,611 (reported on 61.0% of returns)
76705:
$3,611
State:
$9,058
(% of AGI for various income ranges: 2.1% for AGIs below $10k, 3.1% for AGIs $10k-25k, 5.8% for AGIs $25k-50k, 8.9% for AGIs $50k-75k, 11.0% for AGIs $75k-100k, 17.1% for AGIs over 100k)
Earned income credit: $1,968 (reported on 31.5% of returns)
Here:
$1,968
State:
$2,024
Percentage of individuals using paid preparers for their 2004 taxes: 54.2%
Here:
54%
State:
57%
(% for various income ranges: 51.3% for AGIs below $10k, 58.3% for AGIs $10k-25k, 52.7% for AGIs $25k-50k, 50.0% for AGIs $50k-75k, 53.4% for AGIs $75k-100k, 62.9% for AGIs over 100k)
Likely homosexual households (counted as self-reported same-sex unmarried-partner households)
Lesbian couples: 0.1% of all households
Gay men: 0.0% of all households
Household received Food Stamps/SNAP in the past 12 months: 1,925 Household did not receive Food Stamps/SNAP in the past 12 months: 9,526
Women who had a birth in the past 12 months: 425 (147 now married, 269 unmarried) Women who did not have a birth in the past 12 months: 7,731 (3,061 now married, 4,679 unmarried)
Housing units in zip code 76705 with a mortgage: 3,391 (27 second mortgage, 25 both second mortgage and home equity loan) Houses without a mortgage: 44
Median monthly owner costs for units with a mortgage: $1,244 Median monthly owner costs for units without a mortgage: $540
Residents with income below the poverty level in 2022:
This zip code:
21.6%
Whole state:
14.0%
Residents with income below 50% of the poverty level in 2022:
This zip code:
9.7%
Whole state:
7.4%
Median number of rooms in houses and condos:
Here:
5.9
State:
6.3
Median number of rooms in apartments:
Here:
4.3
State:
4.0
Notable locations in this zip code not listed on our city pages
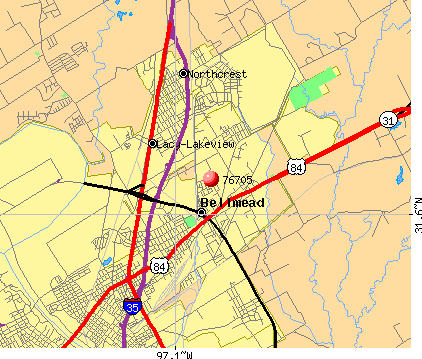
Notable locations in zip code 76705: Texas Highway Department (A), Warden Locomotive Shop (B), Bellmead Fire Department (C), Lacy Lakeview Fire Department Substation (D), Lacy Lakeview Fire Department (E), Chalk Bluff Volunteer Fire Department (F), Gholson Volunteer Fire Department (G), L - 3 Intergrated Systems Fire Department / First Responders (H). Display/hide their locations on the map
Churches in zip code 76705 include: Pilgrim Rest Church (A), Timbercrest Church (B), Bethlehem Church (C), Chalk Bluff Church (D), Chapel Hill Church (E), Concord Church (F), Saint Josephs Church (G), Zion Hill Church (H), Holiness Church (I). Display/hide their locations on the map
Cemeteries: Stanfield Cemetery (1), Elm Mott Cemetery (2), Miller Memorial Cemetery (3), Moore Cemetery (4), Concord Cemetery (5), Gholson Cemetery (6), Chalk Bluff Cemetery (7). Display/hide their locations on the map
Lakes and reservoirs: Browns Lake (A), Tradinghouse Creek Reservoir (B), Oak Lake (C), Lake Hall (D), Gross Lake (E), Yowell Lake (F), Lake Brazos (G), Soil Conservation Service Site 29 Reservoir (H). Display/hide their locations on the map
Streams, rivers, and creeks: Aquilla Creek (A), White Rock Creek (B), Tiger Creek (C), Williams Creek (D), Elm Creek (E), Tradinghouse Creek (F), Riggs Creek (G), Marlin Branch (H), Lucky Branch (I). Display/hide their locations on the map
3,746 married couples with children.
2,479 single-parent households (330 men, 2,149 women).
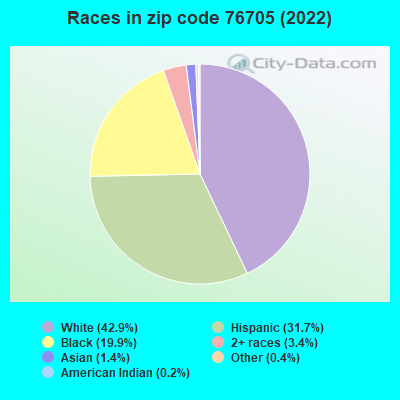
74.9% of residents of 76705 zip code speak English at home.
22.2% of residents speak Spanish at home (52% very well, 30% well, 8% not well, 9% not at all).
1.7% of residents speak other Indo-European language at home (54% very well, 46% well).
0.9% of residents speak Asian or Pacific Island language at home (70% very well, 30% well).
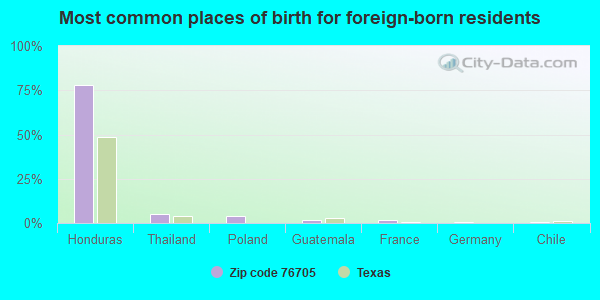
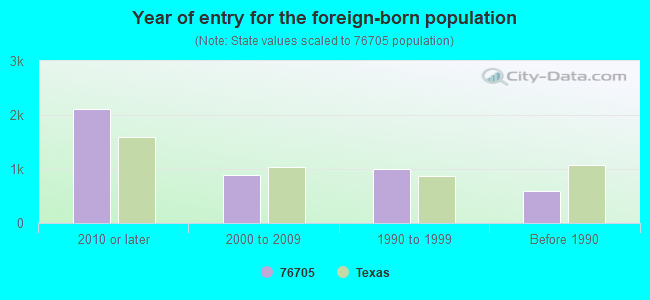
Foreign born population: 3,901 (11.9%) (16.7% of them are naturalized citizens)
Facilities with environmental interests located in this zip code:
B & B AUTO PARTS (3301 MARLIN HWY in WACO, TX)
(Integrated Compliance Information System) - ICIS-06-2000-0399, FORMAL ENFORCEMENT ACTION Business SIC classification: MOTOR VEHICLE PARTS, USED
APPLIED MACHINE TOOL TECHNOLOGY (401 S OLD DALLAS RD in WACO, TX)
(Resource Conservation and Recovery Act (tracking hazardous waste)) Business NAICS classification: MACHINE TOOL (METAL CUTTING TYPES) MANUFACTURING. Organizations: HOWARD BURRIS AND ERHARD SUDERMANN (CONTACT/OPERATOR)
Housing units lacking complete plumbing facilities: 2.1% Housing units lacking complete kitchen facilities: 2.6%
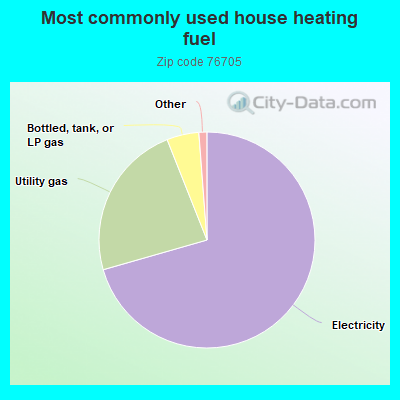
70.5%Electricity
23.4%Utility gas
4.8%Bottled, tank, or LP gas
Population in 1990: 18,763. Population change in the 1990s: +9,080 (+48.4%).
Place of birth for U.S.-born residents:
This state: 22,608
Northeast: 434
Midwest: 1,374
South: 2,094
West: 1,769
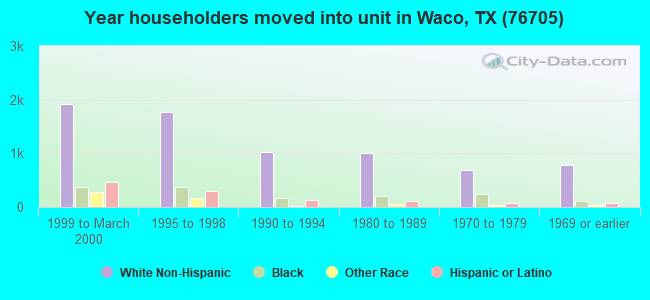
47% of the 76705 zip code residents lived in the same house 5 years ago. Out of people who lived in different houses, 58% lived in this county. Out of people who lived in different counties, 50% lived in Texas.
84% of the 76705 zip code residents lived in the same house 1 year ago. Out of people who lived in different houses, 56% moved from this county. Out of people who lived in different houses, 29% moved from different county within same state. Out of people who lived in different houses, 5% moved from different state. Out of people who lived in different houses, 7% moved from abroad.
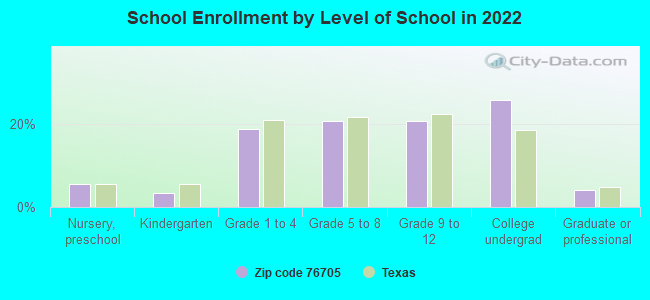
Private vs. public school enrollment:
Students in private schools in grades 1 to 8 (elementary and middle school): 222
Here:
6.1%
Texas:
8.8%
Students in private schools in grades 9 to 12 (high school): 65
Here:
3.4%
Texas:
8.0%
Students in private undergraduate colleges: 740
Here:
31.0%
Texas:
16.2%
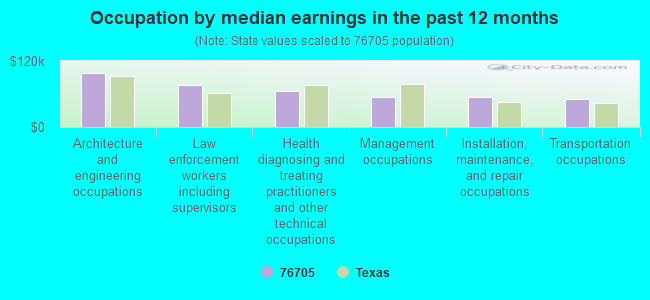
Occupation by median earnings in the past 12 months ($)
97,850Architecture and engineering occupations
76,586Law enforcement workers including supervisors
65,334Health diagnosing and treating practitioners and other technical occupations
55,007Management occupations
54,843Installation, maintenance, and repair occupations
50,615Transportation occupations
Companies with biggest federal contracts located in this zip code (WACO, TX):
TYMCO INTERNATIONAL, LTD (225 E INDUSTRIAL BLVD; small business) : $14,947,607 in 60 contractsfrom 2000 to 2006
Contracts for Fire Fighting Equipment, Road Clearing, Cleaning and Marking Equipment, Lease or Rental of Equipment -- Miscellaneous, Ground Effect Vehicles, and moreby Defense Logistics Agency, Army, Navy, Air Force, and others Signed by year:2000: $4,700,001; 2001: $1,705,812; 2002: $732,361; 2003: $594,556; 2004: $2,730,127; 2005: $4,474,211; 2006: $10,539.
Biggest contracts:
$2,932,478 with Defense Logistics Agency for Fire Fighting Equipment. Signed on 2000-04-20. Completion date: 2000-09-29.
$2,641,996 with Defense Logistics Agency for Road Clearing, Cleaning and Marking Equipment. Signed on 2005-07-27. Completion date: 2005-11-23.
$2,134,441, same as above.Signed on 2004-03-18. Completion date: 2004-07-15.
$1,586,231, same as above.Signed on 2000-01-31. Completion date: 2000-09-30.
JASIE INC (TX ST TECH COLL BLDG 6-8; small business) : $12,379,918 in 3 contractsfrom 2000 to 2003
$4,931,450 with Defense Logistics Agency for Liquid Propellants and Fuels, Petroleum Base. Taking place in PA. Signed on 2000-10-30. Completion date: 2004-03-31.
$4,931,450 with Defense Logistics Agency for Liquid Propellants and Fuels, Petroleum Base. Signed on 2001-04-01. Completion date: 2004-03-31.
$2,517,018, same as above.Signed on 2003-12-12. Completion date: 2007-03-31.
OHENRY PRODUCTIONS, INC (3859 CHAPPEL HILL RD; small business) : $285,074 in 4 contractsfrom 2004 to 2005
$133,464 with Army for Tents and Tarpaulins. Signed on 2004-10-19. Completion date: 2004-10-25.
$72,986 with Federal Emergency Management Agency for Tents and Tarpaulins. Signed on 2004-09-12. Completion date: 2004-09-12.
$63,298, same as above.Signed on 2004-09-12. Completion date: 2004-09-12.
$15,326 with Army for Tents and Tarpaulins. Signed on 2005-03-22. Completion date: 2005-04-30.
DR PEPPER-SEVEN UP BOTTLING GR (100 AVIATION PKY; small business) : $272,922 in 6 contractsfrom 2004 to 2005
Contracts for Food Items For Resale, Non-Food Items For Resale by Defense Commissary Agency Signed by year:2000: $0; 2001: $0; 2002: $0; 2003: $0; 2004: $58,493; 2005: $214,429; 2006: $0.
Biggest contracts:
$87,482 with Defense Commissary Agency for Food Items For Resale. Signed on 2005-04-01. Completion date: 2005-08-31.
$59,481 with Defense Commissary Agency for Non-Food Items For Resale. Signed on 2005-10-01. Completion date: 2005-12-31.
$50,539 with Defense Commissary Agency for Food Items For Resale. Signed on 2004-10-01. Completion date: 2005-02-28.
$36,608, same as above.Signed on 2005-01-01. Completion date: 2005-03-31.
TEXAS MACHINE-TOOL INTL LLC (3118 GHOLSON RD; small business) : $98,662 in 5 contractsfrom 2004 to 2005
Contracts for Maintenance, Repair and Rebuilding of Equipment -- Metalworking Machinery, Maintenance, Repair and Rebuilding of Equipment -- Special Industry Machinery, Drilling and Tapping Machines, Machine Shop Sets, Kits, and Outfits by Army Signed by year:2000: $0; 2001: $0; 2002: $0; 2003: $0; 2004: $30,914; 2005: $67,748; 2006: $0.
Biggest contracts:
$24,800 with Army for Maintenance, Repair and Rebuilding of Equipment -- Metalworking Machinery. Taking place in KS. Signed on 2005-12-20. Completion date: 2006-09-30.
$24,700 with Army for Maintenance, Repair and Rebuilding of Equipment -- Special Industry Machinery. Signed on 2004-05-11. Completion date: 2004-07-12.
$23,474 with Army for Drilling and Tapping Machines. Signed on 2005-08-19. Completion date: 2005-09-19.
$19,474 with Army for Machine Shop Sets, Kits, and Outfits. Signed on 2005-08-10. Completion date: 2005-09-10.
BRIDGESTONE/FIRESTONE INC (5252) : $29,499 in 2 contractsfrom 2002 to 2004
$26,536 with Army for Tires and Tubes, Pneumatic, Except Aircraft. Signed on 2002-12-06. Completion date: 2002-12-11.
$2,963, same as above.Signed on 2004-05-24. Completion date: 2004-05-18.
STEWART, GAIL (708 N RITA) : $21,910 in 4 contractsfrom 2004 to 2005
$7,350 with Army for Guard Services. Signed on 2004-03-15. Completion date: 2003-04-01.
$7,280 with U.S. Army Corps of Engineers - civil program financing only for Other Housekeeping Services. Signed on 2005-03-04. Completion date: 2005-09-30.
$7,280 with Army for Other Housekeeping Services. Signed on 2005-03-04. Completion date: 2005-09-30.
$0 with Army for Guard Services. Signed on 2004-03-15. Completion date: 2003-04-01.
CZIMSKEY, ROYCE (1639 BUSTER CHATHAM; small business) : $16,800 in 2 contractsfrom 2004 to 2006
$9,975 with Army for Guard Services. Signed on 2004-03-15. Completion date: 2004-04-01.
$6,825 with Army for Other Housekeeping Services. Signed on 2006-02-01. Completion date: 2006-09-30.
A 1 DEMOLITION (801 N LOOP DR; small business)
$12,248 with Army for Maintenance, Repair or Alteration of Real Property -- Other Non-Building Facilities. Signed on 2005-02-09. Completion date: 2005-03-15.
NANCY V MCFARLAND (3924 KENDALL LN; small business) : $5,925 in 3 contractsin 2006
$5,925 with Army for Logistics Support Services. Signed on 2006-03-06. Completion date: 2006-04-01.
$0 with Army for Other Administrative Support Services. Signed on 2006-04-13. Effective on 2006-04-06. Completion date: 2006-04-01.
$0, same as above.Signed on 2006-07-06. Effective on 2006-04-01. Completion date: 2006-04-01.
Top industries in this zip code by the number of employees in 2005:
2002 - 2018 National Fire Incident Reporting System (NFIRS) incidents
According to the data from the years 2002 - 2018 the average number of fire incidents per year is 182. The highest number of fires - 238 took place in 2005, and the least - 142 in 2004. The data has an increasing trend.
When looking into fire subcategories, the most incidents belonged to: Outside Fires (47.7%), and Structure Fires (31.8%).
Fire incident types reported to NFIRS in Zip Code 76705


 Nearest zip codes: 76704, 76798, 76701, 76640, 76707, 76708.


 According to the data from the years 2002 - 2018 the average number of fire incidents per year is 182. The highest number of fires - 238 took place in 2005, and the least - 142 in 2004. The data has an increasing trend.
 When looking into fire subcategories, the most incidents belonged to: Outside Fires (47.7%), and Structure Fires (31.8%).