Estimated zip code population in 2022: 2,382 Zip code population in 2010: 1,651 Zip code population in 2000: 1,713
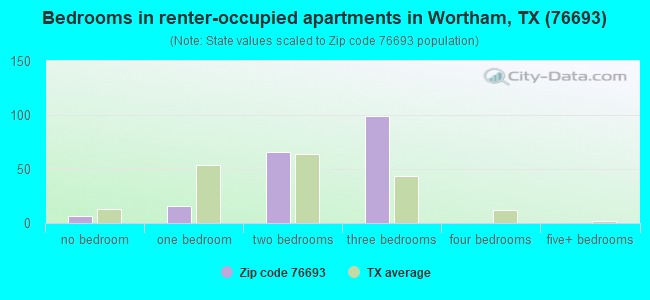
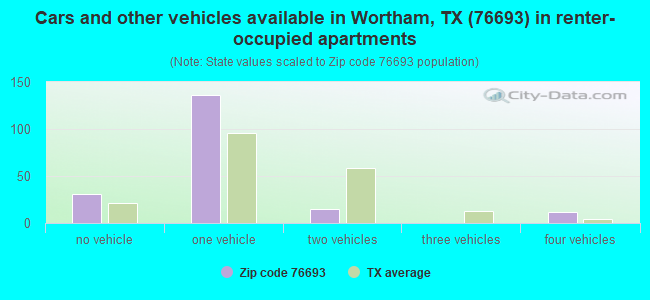
Houses and condos: 1,059 Renter-occupied apartments: 190
% of renters here:
23%
State:
38%
March 2022 cost of living index in zip code 76693: 79.1 (low, U.S. average is 100)
Land area: 77.3 sq. mi. Water area: 0.2 sq. mi.
Population density: 31 people per square mile
(very low).
OSM Map
General Map
Google Map
MSN Map
OSM Map
General Map
Google Map
MSN Map
OSM Map
General Map
Google Map
MSN Map
OSM Map
General Map
Google Map
MSN Map
Please wait while loading the map...
Real estate property taxes paid for housing units in 2022:
This zip code:
0.9% ($1,445)
Texas:
1.5% ($4,050)
Median real estate property taxes paid for housing units with mortgages in 2022: $1,272 (1.1%) Median real estate property taxes paid for housing units with no mortgage in 2022: $1,627 (0.7%)
Business Search- 14 Million verified businesses
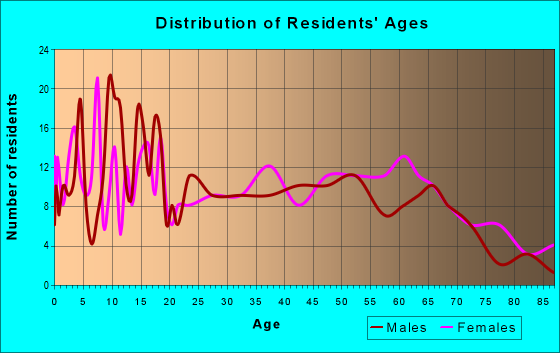
Males: 992
(41.6%)
Females: 1,390
(58.4%)
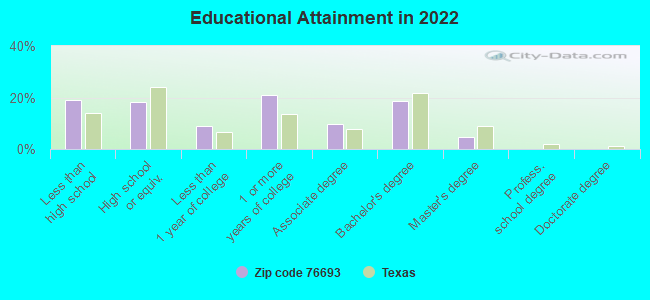
For population 25 years and over in 76693:
High school or higher: 78.6%
Bachelor's degree or higher: 22.6%
Graduate or professional degree: 4.6%
Mean travel time to work (commute): 30.6 minutes
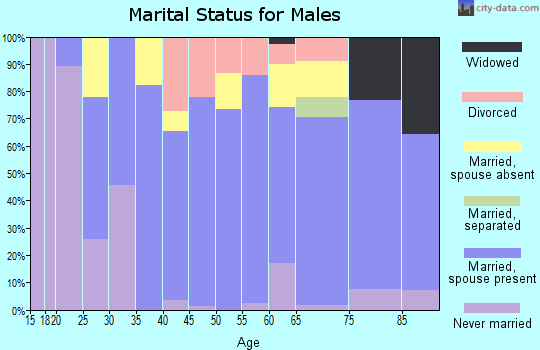
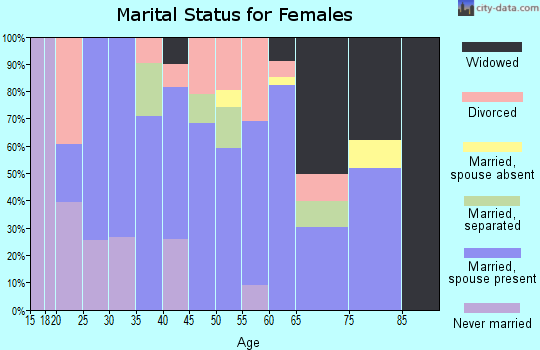
For population 15 years and over in 76693:
Never married: 33.7%
Now married: 42.4%
Separated: 2.4%
Widowed: 10.8%
Divorced: 10.7%
Zip code 76693 compared to state average:
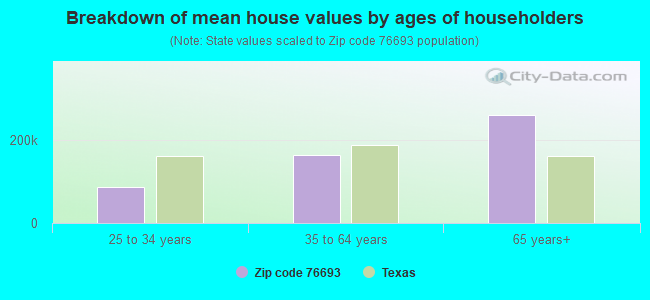
Median house value below state average.
Unemployed percentage significantly below state average.
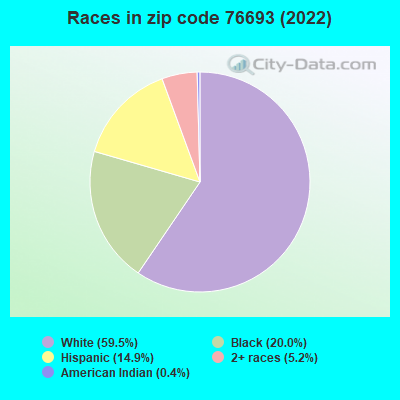
Hispanic race population percentage below state average.
Median age above state average.
Foreign-born population percentage significantly below state average.
Renting percentage below state average.
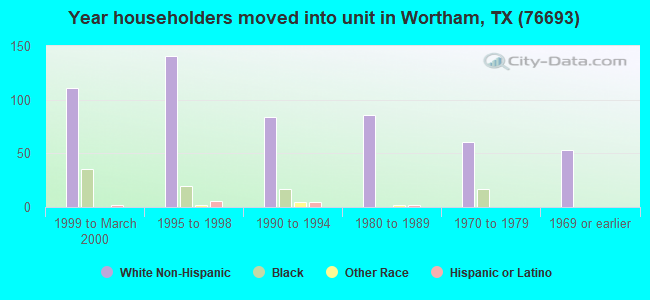
Length of stay since moving in significantly above state average.
Averages for the 2020 tax year for zip code 76693, filed in 2021:
Average Adjusted Gross Income (AGI) in 2020: $52,776 (Individual Income Tax Returns)
Here:
$52,776
State:
$77,054
Salary/wage: $47,107 (reported on 82.4% of returns)
Here:
$47,107
State:
$62,766
(% of AGI for various income ranges: 1106.4% for AGIs below $25k, 3705.0% for AGIs $25k-50k, 7290.0% for AGIs $50k-75k, 10835.0% for AGIs $75k-100k, 21872.0% for AGIs $100k-200k)
Taxable interest for individuals: $993 (reported on 20.3% of returns)
This zip code:
$993
Texas:
$2,665
(% of AGI for various income ranges: 5.0% for AGIs below $25k, 6.2% for AGIs $25k-50k, 47.1% for AGIs $50k-75k, 190.0% for AGIs $100k-200k)
Ordinary dividends: $3,125 (reported on 10.8% of returns)
Here:
$3,125
State:
$10,044
(% of AGI for various income ranges: 11.8% for AGIs below $25k, 51.4% for AGIs $50k-75k, 376.0% for AGIs $100k-200k)
Net capital gain/loss in AGI: +$7,650 (reported on 10.8% of returns)
Here:
+$7,650
State:
+$39,590
(% of AGI for various income ranges: 0.6% for AGIs $25k-50k, 1222.0% for AGIs $100k-200k)
Profit/loss from business: +$7,480 (reported on 20.3% of returns)
Here:
+$7,480
State:
+$10,888
(% of AGI for various income ranges: 201.4% for AGIs below $25k, 118.1% for AGIs $25k-50k, 181.4% for AGIs $50k-75k, 726.0% for AGIs $100k-200k)
Taxable individual retirement arrangement distribution: $16,200 (reported on 9.5% of returns)
76693:
$16,200
Texas:
$24,740
(% of AGI for various income ranges: 181.2% for AGIs $25k-50k, 2110.0% for AGIs $75k-100k)
Earned income credit: $2,689 (reported on 24.3% of returns)
Here:
$2,689
State:
$2,584
(% of AGI for various income ranges: 140.9% for AGIs below $25k, 108.7% for AGIs $25k-50k)
Percentage of individuals using paid preparers for their 2020 taxes: 91.9%
Here:
92%
State:
92%
(% for various income ranges: 89.7% for AGIs below $25k, 94.7% for AGIs $25k-50k, 90.0% for AGIs $50k-75k, 100.0% for AGIs $75k-100k, 90.0% for AGIs $100k-200k)
Averages for the 2012 tax year for zip code 76693, filed in 2013:
Average Adjusted Gross Income (AGI) in 2012: $45,800 (Individual Income Tax Returns)
Here:
$45,800
State:
$65,384
Salary/wage: $41,608 (reported on 81.9% of returns)
Here:
$41,608
State:
$52,524
(% of AGI for various income ranges: 73.5% for AGIs below $25k, 84.0% for AGIs $25k-50k, 83.0% for AGIs $50k-75k, 82.8% for AGIs $75k-100k, 62.2% for AGIs $100k-200k)
Taxable interest for individuals: $527 (reported on 20.8% of returns)
This zip code:
$527
Texas:
$2,372
(% of AGI for various income ranges: 0.3% for AGIs below $25k, 0.3% for AGIs $25k-50k, 0.2% for AGIs $75k-100k, 0.3% for AGIs $100k-200k)
Ordinary dividends: $2,000 (reported on 11.1% of returns)
Here:
$2,000
State:
$9,721
Net capital gain/loss in AGI: +$771 (reported on 9.7% of returns)
Here:
+$771
State:
+$35,319
Profit/loss from business: +$8,838 (reported on 18.1% of returns)
Here:
+$8,838
State:
+$13,732
(% of AGI for various income ranges: 12.0% for AGIs below $25k, 5.1% for AGIs $25k-50k, 5.8% for AGIs $75k-100k)
Taxable individual retirement arrangement distribution: $12,440 (reported on 6.9% of returns)
76693:
$12,440
Texas:
$19,511
Total itemized deductions: $20,138 (22% of AGI, reported on 11.1% of returns)
Here:
$20,138
State:
$24,724
Here:
22.3% of AGI
State:
15.9% of AGI
(% of AGI for various income ranges: 5.9% for AGIs $25k-50k, 10.7% for AGIs $50k-75k, 6.1% for AGIs $100k-200k)
Charity contributions: $5,640 (reported on 6.9% of returns)
Here:
$5,640
State:
$6,808
Taxes paid: $3,925 (reported on 11.1% of returns)
76693:
$3,925
State:
$6,921
(% of AGI for various income ranges: 0.9% for AGIs $25k-50k, 1.9% for AGIs $50k-75k, 1.4% for AGIs $100k-200k)
Earned income credit: $2,706 (reported on 25.0% of returns)
Here:
$2,706
State:
$2,570
(% of AGI for various income ranges: 10.1% for AGIs below $25k, 1.5% for AGIs $25k-50k)
Percentage of individuals using paid preparers for their 2012 taxes: 65.3%
Here:
65%
State:
51%
(% for various income ranges: 60.0% for AGIs below $25k, 70.0% for AGIs $25k-50k, 57.1% for AGIs $50k-75k, 71.4% for AGIs $75k-100k, 75.0% for AGIs $100k-200k)
Averages for the 2004 tax year for zip code 76693, filed in 2005:
Average Adjusted Gross Income (AGI) in 2004: $30,409 (Individual Income Tax Returns)
Here:
$30,409
State:
$47,881
Salary/wage: $31,038 (reported on 81.9% of returns)
Here:
$31,038
State:
$41,947
(% of AGI for various income ranges: 121.6% for AGIs below $10k, 79.8% for AGIs $10k-25k, 88.3% for AGIs $25k-50k, 87.2% for AGIs $50k-75k, 86.6% for AGIs $75k-100k, 56.4% for AGIs over 100k)
Taxable interest for individuals: $958 (reported on 30.0% of returns)
This zip code:
$958
Texas:
$2,255
(% of AGI for various income ranges: 7.4% for AGIs below $10k, 1.4% for AGIs $10k-25k, 0.5% for AGIs $25k-50k, 0.2% for AGIs $50k-75k, 0.4% for AGIs $75k-100k, 2.2% for AGIs over 100k)
Taxable dividends: $1,112 (reported on 13.9% of returns)
Here:
$1,112
State:
$4,261
(% of AGI for various income ranges: 5.0% for AGIs below $10k, 0.6% for AGIs $10k-25k, 0.5% for AGIs $25k-50k, 0.1% for AGIs $50k-75k, 0.5% for AGIs $75k-100k)
Net capital gain/loss: +$4,899 (reported on 14.0% of returns)
Here:
+$4,899
State:
+$16,110
(% of AGI for various income ranges: 0.9% for AGIs below $10k, -0.2% for AGIs $10k-25k, 0.0% for AGIs $25k-50k, 0.3% for AGIs $50k-75k, 0.2% for AGIs $75k-100k, 19.5% for AGIs over 100k)
Profit/loss from business: +$5,299 (reported on 18.0% of returns)
Here:
+$5,299
State:
+$11,013
(% of AGI for various income ranges: 20.5% for AGIs below $10k, 5.8% for AGIs $10k-25k, 3.0% for AGIs $25k-50k, 2.4% for AGIs $50k-75k, 1.0% for AGIs $75k-100k)
Total itemized deductions: $14,541 (26% of AGI, reported on 12.0% of returns)
Here:
$14,541
State:
$19,631
Here:
25.9% of AGI
State:
18.9% of AGI
(% of AGI for various income ranges: 6.2% for AGIs $10k-25k, 6.1% for AGIs $25k-50k, 4.6% for AGIs $50k-75k, 6.1% for AGIs $75k-100k, 7.3% for AGIs over 100k)
Charity contributions deductions: $4,077 (7% of AGI, reported on 9.2% of returns)
Here:
$4,077
State:
$4,753
Here:
6.9% of AGI
State:
4.2% of AGI
(% of AGI for various income ranges: 7.7% for AGIs below $10k, 1.2% for AGIs $25k-50k, 1.1% for AGIs $50k-75k, 2.5% for AGIs $75k-100k)
Total tax: $3,509 (reported on 67.8% of returns)
76693:
$3,509
State:
$9,058
(% of AGI for various income ranges: 4.5% for AGIs below $10k, 3.7% for AGIs $10k-25k, 6.1% for AGIs $25k-50k, 8.0% for AGIs $50k-75k, 11.4% for AGIs $75k-100k, 13.7% for AGIs over 100k)
Earned income credit: $2,057 (reported on 27.3% of returns)
Here:
$2,057
State:
$2,024
Percentage of individuals using paid preparers for their 2004 taxes: 67.1%
Here:
67%
State:
57%
(% for various income ranges: 67.9% for AGIs below $10k, 70.1% for AGIs $10k-25k, 60.5% for AGIs $25k-50k, 64.5% for AGIs $50k-75k, 75.6% for AGIs $75k-100k, 78.9% for AGIs over 100k)
Household received Food Stamps/SNAP in the past 12 months: 235 Household did not receive Food Stamps/SNAP in the past 12 months: 616
Women who had a birth in the past 12 months: 18 (18 now married, 0 unmarried) Women who did not have a birth in the past 12 months: 547 (215 now married, 333 unmarried)
Housing units in zip code 76693 with a mortgage: 202 (3 second mortgage, 4 both second mortgage and home equity loan) Median monthly owner costs for units with a mortgage: $1,402 Median monthly owner costs for units without a mortgage: $487
Residents with income below the poverty level in 2022:
This zip code:
11.2%
Whole state:
14.0%
Residents with income below 50% of the poverty level in 2022:
This zip code:
6.6%
Whole state:
7.4%
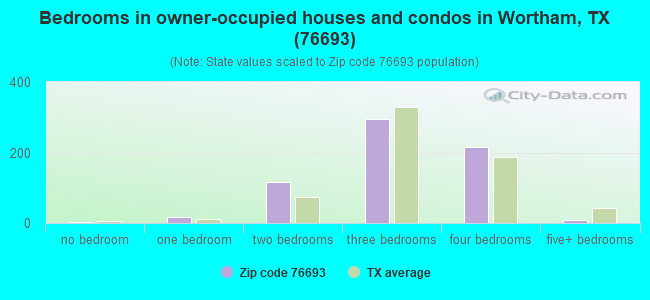
Median number of rooms in houses and condos:
Here:
6.1
State:
6.3
Median number of rooms in apartments:
Here:
4.7
State:
4.0
Notable locations in this zip code not listed on our city pages
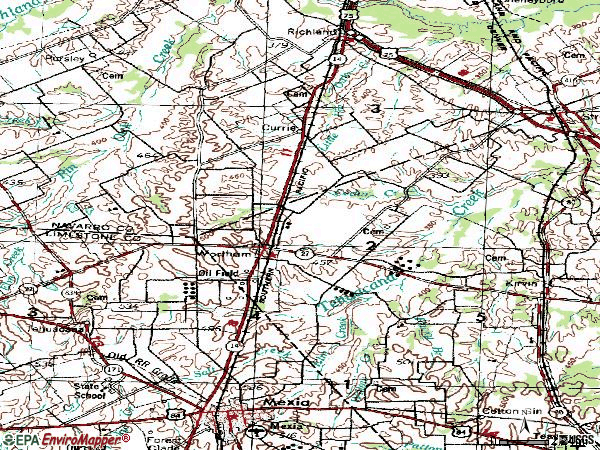
Cemeteries: Miller Cemetery (1), Long Bottom Cemetery (2), Woodland Cemetery (3), Webb-Branch Cemetery (4), Red Cemetery (5). Display/hide their locations on the map
Streams, rivers, and creeks: Wolf Creek (A), Willow Creek (B), Rocky Branch (C), Jackson Branch (D), Little Tehuacana Creek (E), Elm Creek (F), Cedar Creek (G). Display/hide their locations on the map
In group quarters: 34 (-1 institutionalized population)
Size of family households: 278 2-persons, 53 3-persons, 100 4-persons, 41 5-persons, 60 6-persons, 11 7-or-more-persons
Size of nonfamily households: 279 1-person, 20 2-persons
382 married couples with children.
109 single-parent households (9 men, 100 women).
93.1% of residents of 76693 zip code speak English at home.
6.8% of residents speak Spanish at home (74% very well, 10% well, 3% not well, 13% not at all).
0.1% of residents speak other Indo-European language at home (100% very well).
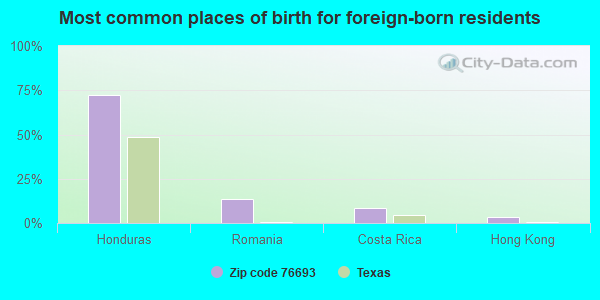
Foreign born population: 93 (3.9%) (39.9% of them are naturalized citizens)
This zip code:
3.9%
Whole state:
17.2%
72%Honduras
14%Romania
9%Costa Rica
3%Hong Kong
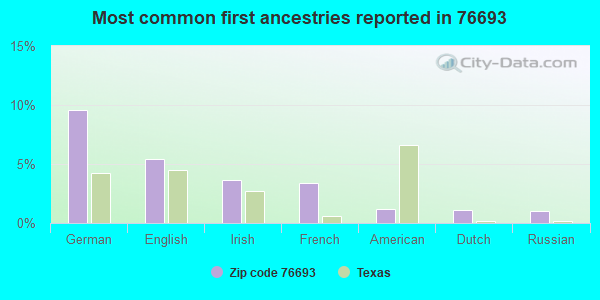
10%German
5%English
4%Irish
3%French
1%American
1%Dutch
1%Russian
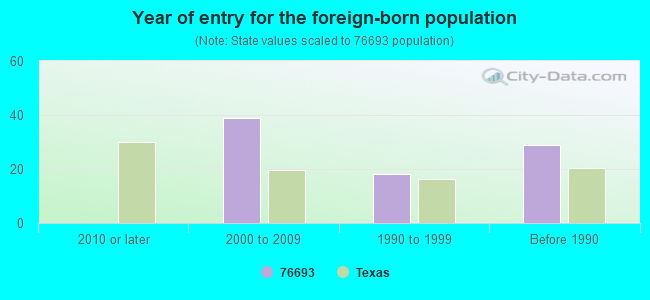
Year of entry for the foreign-born population
02010 or later
392000 to 2009
181990 to 1999
29Before 1990
Housing units lacking complete plumbing facilities: 7.3% Housing units lacking complete kitchen facilities: 6.0%
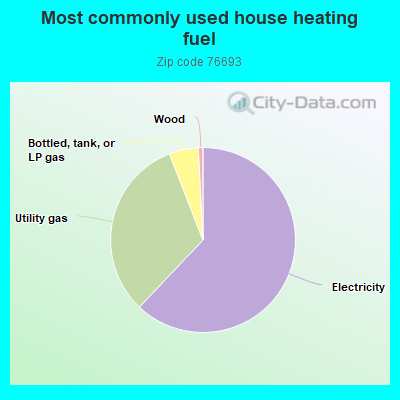
62.2%Electricity
32.1%Utility gas
5.1%Bottled, tank, or LP gas
0.8%Wood
Population in 1990: 1,602. Population change in the 1990s: +111 (+6.9%).
Place of birth for U.S.-born residents:
This state: 1,968
Northeast: 47
Midwest: 102
South: 43
West: 106
59% of the 76693 zip code residents lived in the same house 5 years ago. Out of people who lived in different houses, 39% lived in this county. Out of people who lived in different counties, 50% lived in Texas.
95% of the 76693 zip code residents lived in the same house 1 year ago. Out of people who lived in different houses, 24% moved from this county. Out of people who lived in different houses, 80% moved from different county within same state.
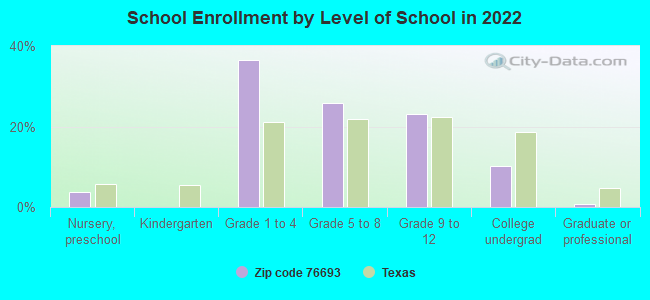
Private vs. public school enrollment:
Students in private schools in grades 1 to 8 (elementary and middle school): 11
Here:
3.4%
Texas:
8.8%
Students in private schools in grades 9 to 12 (high school):
Here:
0.0%
Texas:
8.0%
Students in private undergraduate colleges:
Here:
0.0%
Texas:
16.2%
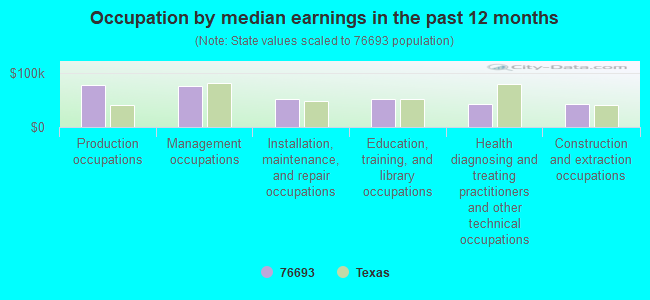
Occupation by median earnings in the past 12 months ($)
78,237Production occupations
75,207Management occupations
51,187Installation, maintenance, and repair occupations
51,139Education, training, and library occupations
43,232Health diagnosing and treating practitioners and other technical occupations
42,795Construction and extraction occupations
Top industries in this zip code by the number of employees in 2005:
Administrative and Support and Waste Management and Remediation Services: Janitorial Services (10-19 employees: 1 establishment, 1-4 employees: 2 establishments)
Other Services (except Public Administration): Religious Organizations (5-9: 1, 1-4: 1)
Construction: Plumbing, Heating, and Air-Conditioning Contractors (5-9: 1, 1-4: 1)
Construction: Site Preparation Contractors (5-9: 1)
Wholesale Trade: Sporting and Recreational Goods and Supplies Merchant Wholesalers (5-9: 1)
Health Care and Social Assistance: Offices of Physicians (except Mental Health Specialists) (5-9: 1)
People in group quarters in 2010:
31 people in nursing facilities/skilled-nursing facilities
7 people in group homes intended for adults
People in group quarters in 2000:
34 people in nursing homes
Fatal accident statistics in 2013:
Fatal accident count: 1
Vehicles involved in fatal accidents: 1
Fatal accidents caused by drunken drivers: 0
Fatalities: 1
Persons involved in fatal accidents: 1
Pedestrians involved in fatal accidents: 0
2003 - 2018 National Fire Incident Reporting System (NFIRS) incidents
According to the data from the years 2003 - 2018 the average number of fire incidents per year is 15. The highest number of reported fire incidents - 37 took place in 2011, and the least - 1 in 2004. The data has an increasing trend.
When looking into fire subcategories, the most incidents belonged to: Outside Fires (59.6%), and Structure Fires (24.5%).
Fire incident types reported to NFIRS in Zip Code 76693


 Nearest zip codes: 75848, 76681, 76667, 76686, 75859, 76679.
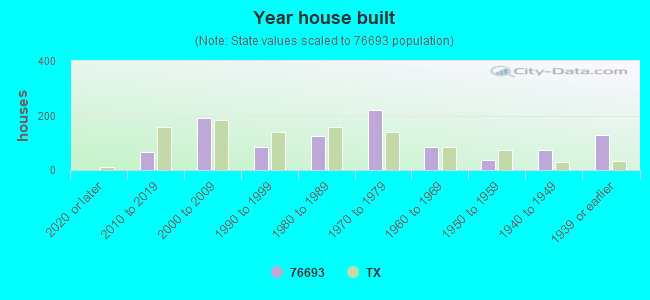


 According to the data from the years 2003 - 2018 the average number of fire incidents per year is 15. The highest number of reported fire incidents - 37 took place in 2011, and the least - 1 in 2004. The data has an increasing trend.
 When looking into fire subcategories, the most incidents belonged to: Outside Fires (59.6%), and Structure Fires (24.5%).