Limestone County, Texas (TX)
County owner-occupied free and clear houses and condos in 2010: 3,296
County owner-occupied houses and condos in 2000: 5,922
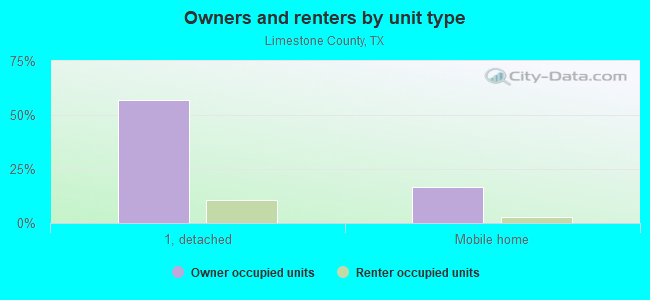
Renter-occupied apartments: 2,268 (it was 1,984 in 2000)
| % of renters here: | 25% |
| State: | 36% |
Land area: 909 sq. mi.
Water area: 24.3 sq. mi.
Population density: 25 people per square mile (low).
Industries providing employment: Educational, health and social services (26.4%), Construction (12.7%), Manufacturing (10.7%), Retail trade (10.7%).
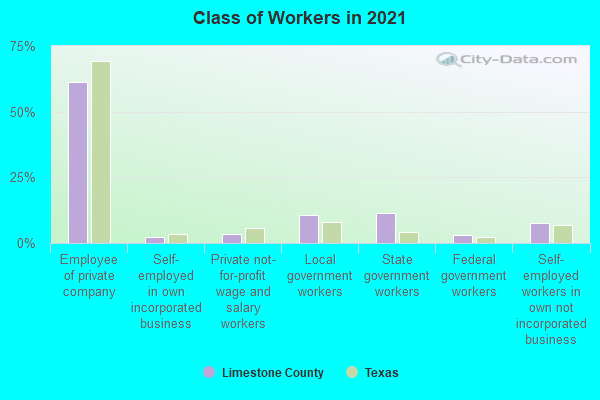
Type of workers:
- Private wage or salary: 68%
- Government: 23%
- Self-employed, not incorporated: 9%
- Unpaid family work: 0%
- OSM Map
- General Map
- Google Map
- MSN Map

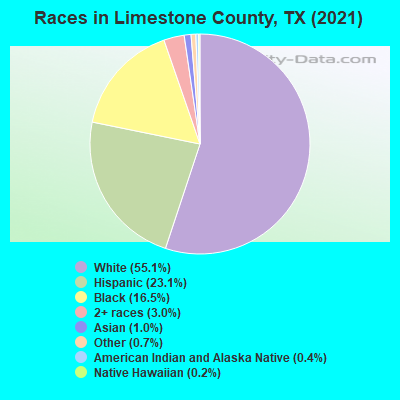
- 12,37854.8%White Non-Hispanic Alone
- 5,26923.3%Hispanic or Latino
- 3,80716.8%Black Non-Hispanic Alone
- 7183.2%Two or more races
- 2511.1%Asian alone
- 760.3%American Indian and Alaska Native alone
- 660.3%Some other race alone
- 410.2%Native Hawaiian and Other
Pacific Islander alone
| Median resident age: | 42.5 years |
| Texas median age: | 35.6 years |
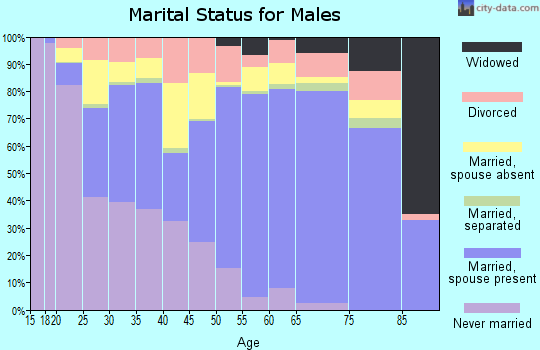
| Males: 11,621 | |
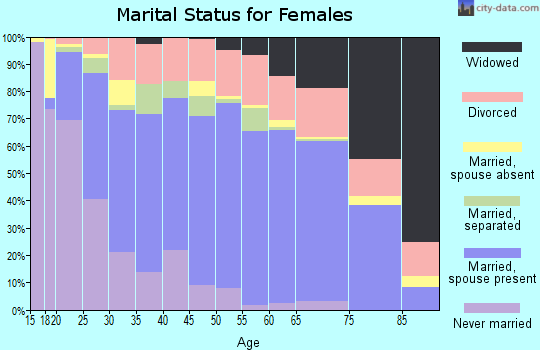
| Females: 11,198 |


| Limestone County: | 2.0 people |
| Texas: | 3 people |
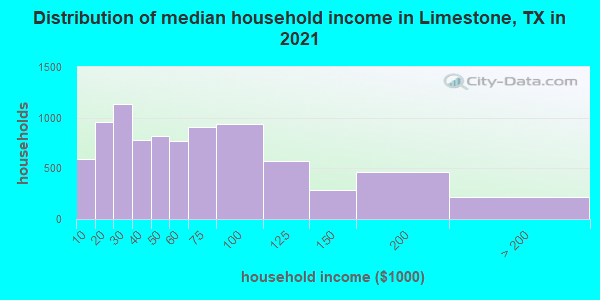
Estimated median household income in 2022: $52,555 ($29,366 in 1999)
| This county: | $52,555 |
| Texas: | $72,284 |
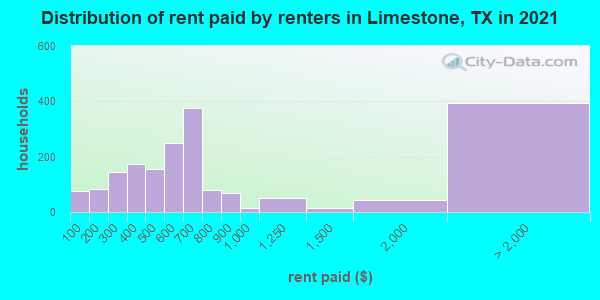
Median contract rent in 2022 for apartments: $597 (lower quartile is $382, upper quartile is $742)
| This county: | $597 |
| State: | $1117 |
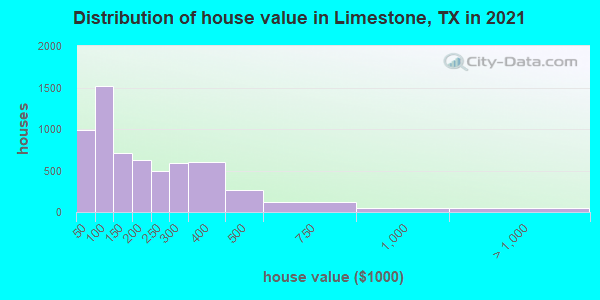
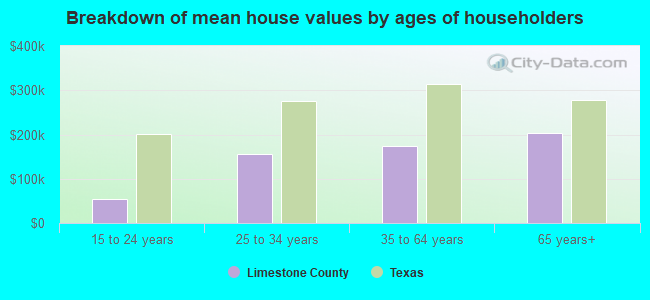
Estimated median house or condo value in 2022: $156,677 (it was $46,600 in 2000)
| Limestone: | $156,677 |
| Texas: | $275,400 |
Median monthly housing costs for homes and condos with a mortgage: $1,329
Median monthly housing costs for units without a mortgage: $559
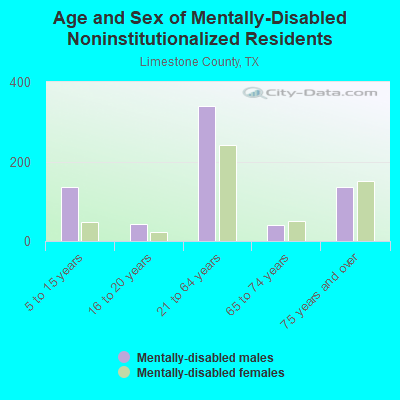
Institutionalized population: 1,542
Crime in 2021 (reported by the sheriff's office or county police, not the county total):
- Murders: 0
- Rapes: 12
- Robberies: 0
- Assaults: 24
- Burglaries: 44
- Thefts: 48
- Auto thefts: 12
Crime in 2020 (reported by the sheriff's office or county police, not the county total):
- Murders: 0
- Rapes: 1
- Robberies: 0
- Assaults: 11
- Burglaries: 34
- Thefts: 1
- Auto thefts: 2
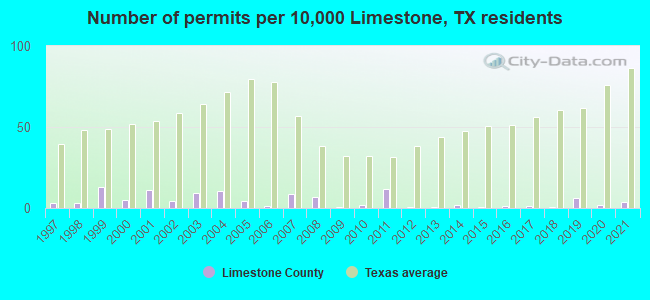
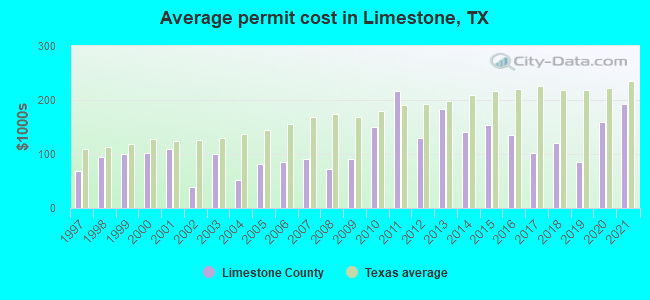
Single-family new house construction building permits:
- 2022: 12 buildings, average cost: $253,200
- 2021: 8 buildings, average cost: $191,900
- 2020: 4 buildings, average cost: $159,300
- 2019: 14 buildings, average cost: $85,500
- 2018: 2 buildings, average cost: $120,000
- 2017: 3 buildings, average cost: $100,500
- 2016: 3 buildings, average cost: $135,000
- 2015: 2 buildings, average cost: $152,600
- 2014: 4 buildings, average cost: $140,000
- 2013: 2 buildings, average cost: $184,000
- 2012: 1 building, cost: $130,000
- 2011: 26 buildings, average cost: $215,500
- 2010: 4 buildings, average cost: $149,700
- 2009: 2 buildings, average cost: $90,000
- 2008: 15 buildings, average cost: $72,800
- 2007: 19 buildings, average cost: $89,800
- 2006: 3 buildings, average cost: $84,700
- 2005: 9 buildings, average cost: $80,900
- 2004: 23 buildings, average cost: $52,000
- 2003: 21 buildings, average cost: $99,500
- 2002: 10 buildings, average cost: $38,700
- 2001: 24 buildings, average cost: $109,000
- 2000: 11 buildings, average cost: $100,500
- 1999: 29 buildings, average cost: $99,900
- 1998: 7 buildings, average cost: $93,600
- 1997: 7 buildings, average cost: $68,000
Median real estate property taxes paid for housing units with mortgages in 2022: $1,959 (1.1%)
Median real estate property taxes paid for housing units with no mortgage in 2022: $1,764 (1.2%)
| Limestone County: | 21.6% |
| Texas: | 14.0% |
Median age of residents in 2022: 42.5 years old
(Males: 40.2 years old, Females: 45.3 years old)
(Median age for: White residents: 51.1 years old, Black residents: 40.8 years old, American Indian residents: 56.4 years old, Asian residents: 46.9 years old, Hispanic or Latino residents: 26.8 years old, Other race residents: 58.3 years old)
Fair market rent in 2006 for a 1-bedroom apartment in Limestone County is $438 a month.
Fair market rent for a 2-bedroom apartment is $484 a month.
Fair market rent for a 3-bedroom apartment is $620 a month.
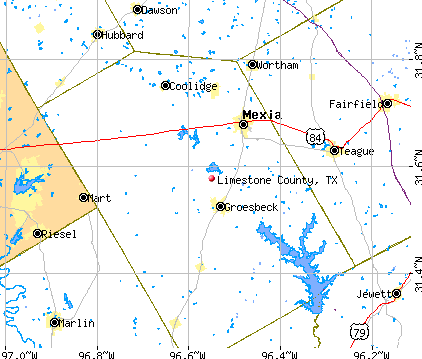
Cities in this county include: Mexia, Groesbeck, Personville, Coolidge, Prairie Hill, Thornton, Kosse, Tehuacana.
Neighboring counties: Barbour County, Alabama  , Early County, Georgia , Randolph County, Georgia , Telfair County, Georgia .
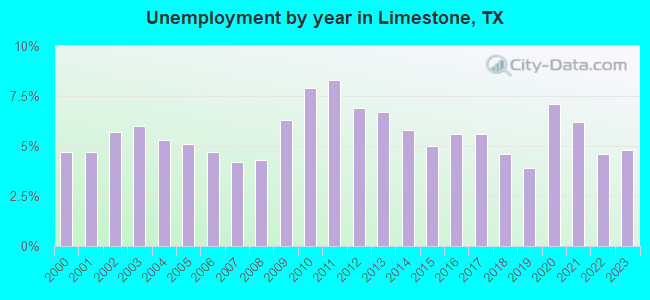
| Here: | 4.0% |
| Texas: | 3.5% |
Current college students: 785
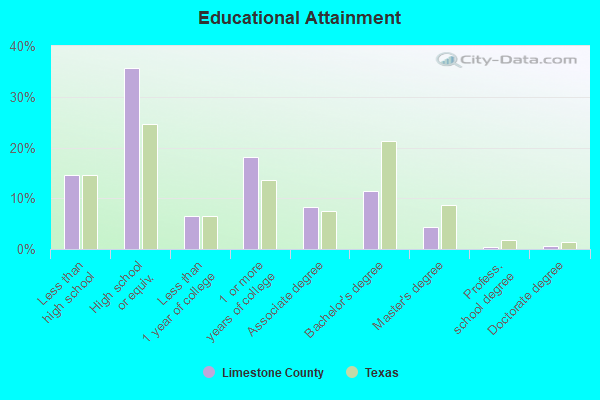
People 25 years of age or older with a high school degree or higher: 84.6%
People 25 years of age or older with a bachelor's degree or higher: 16.9%
Number of foreign born residents: 2,242 (36.8% naturalized citizens)
| Limestone County: | 9.8% |
| Whole state: | 17.2% |
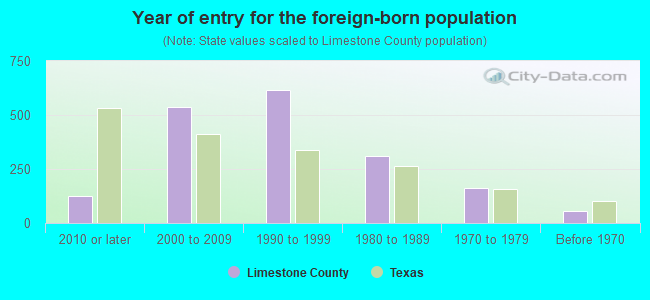
- Year of entry for the foreign-born population
- 2702010 or later
- 5642000 to 2009
- 6091990 to 1999
- 3081980 to 1989
- 1601970 to 1979
- 54Before 1970
Mean travel time to work (commute): minutes
Percentage of county residents living and working in this county: 98.9%
Housing units in structures:
- One, detached: 7,533
- One, attached: 112
- Two: 227
- 3 or 4: 354
- 5 to 9: 361
- 10 to 19: 69
- 20 to 49: 15
- 50 or more: 32
- Mobile homes: 1,990
- Boats, RVs, vans, etc.: 27
Housing units in Limestone County with a mortgage: 2,243 (75 second mortgage, 0 home equity loan, 75 both second mortgage and home equity loan)
Houses without a mortgage: 36
| Here: | 5.3% with mortgage |
| State: | 98.4% with mortgage |
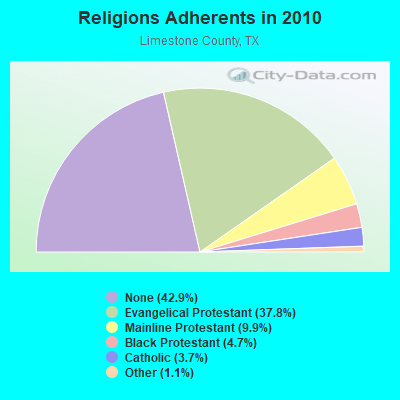
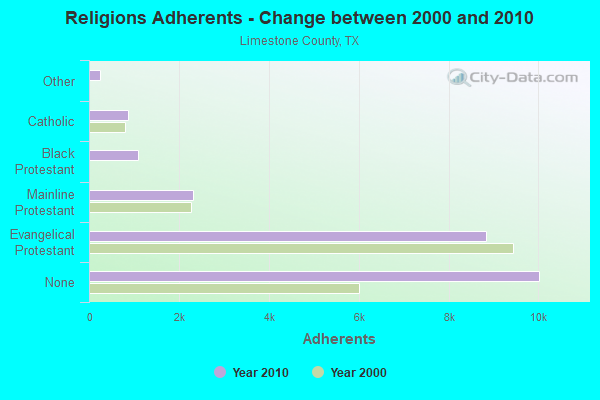
Religion statistics for Limestone County
| Religion | Adherents | Congregations |
|---|---|---|
| Evangelical Protestant | 8,830 | 52 |
| Mainline Protestant | 2,314 | 13 |
| Black Protestant | 1,098 | 7 |
| Catholic | 865 | 1 |
| Other | 254 | 2 |
| None | 10,023 | - |
Source: Clifford Grammich, Kirk Hadaway, Richard Houseal, Dale E.Jones, Alexei Krindatch, Richie Stanley and Richard H.Taylor. 2012. 2010 U.S.Religion Census: Religious Congregations & Membership Study. Association of Statisticians of American Religious Bodies. Jones, Dale E., et al. 2002. Congregations and Membership in the United States 2000. Nashville, TN: Glenmary Research Center.
Food Environment Statistics:
| Limestone County: | 2.69 / 10,000 pop. |
| State: | 1.47 / 10,000 pop. |
| Here: | 0.45 / 10,000 pop. |
| Texas: | 0.14 / 10,000 pop. |
| This county: | 1.34 / 10,000 pop. |
| Texas: | 1.11 / 10,000 pop. |
| Limestone County: | 9.41 / 10,000 pop. |
| Texas: | 3.95 / 10,000 pop. |
| This county: | 8.52 / 10,000 pop. |
| State: | 6.13 / 10,000 pop. |
| Limestone County: | 10.3% |
| Texas: | 8.9% |
| Limestone County: | 28.3% |
| State: | 26.6% |
| Here: | 13.5% |
| State: | 15.7% |
Agriculture in Limestone County:
Average size of farms: 371 acresAverage value of agricultural products sold per farm: $22,922
Average value of crops sold per acre for harvested cropland: $68.84
The value of nursery, greenhouse, floriculture, and sod as a percentage of the total market value of agricultural products sold: 0.22%
The value of livestock, poultry, and their products as a percentage of the total market value of agricultural products sold: 87.36%
Average total farm production expenses per farm: $23,868
Harvested cropland as a percentage of land in farms: 11.35%
Irrigated harvested cropland as a percentage of land in farms: 0.51%
Average market value of all machinery and equipment per farm: $33,592
The percentage of farms operated by a family or individual: 95.45%
Average age of principal farm operators: 58 years
Average number of cattle and calves per 100 acres of all land in farms: 22.13
Milk cows as a percentage of all cattle and calves: 0.20%
Corn for grain: 11786 harvested acres
All wheat for grain: 1037 harvested acres
Upland cotton: 1467 harvested acres
Vegetables: 286 harvested acres
Land in orchards: 736 acres
Earthquake activity:
Limestone County-area historical earthquake activity is significantly above Texas state average. It is 329% greater than the overall U.S. average.On 11/6/2011 at 03:53:10, a magnitude 5.7 (5.7 MW, Depth: 3.2 mi, Class: Moderate, Intensity: VI - VII) earthquake occurred 273.9 miles away from Limestone County center
On 5/17/2012 at 08:12:00, a magnitude 4.8 (4.8 MW, Depth: 3.1 mi, Class: Light, Intensity: IV - V) earthquake occurred 130.6 miles away from the county center
On 9/3/2016 at 12:02:44, a magnitude 5.8 (5.8 MW, Depth: 3.5 mi) earthquake occurred 336.1 miles away from the county center
On 6/16/1978 at 11:46:54, a magnitude 5.3 (4.4 MB, 4.6 UK, 5.3 ML) earthquake occurred 266.1 miles away from the county center
On 10/20/2011 at 12:24:41, a magnitude 4.8 (4.8 MW, Depth: 3.1 mi) earthquake occurred 208.5 miles away from Limestone County center
On 9/2/2013 at 23:51:15, a magnitude 4.3 (4.3 MW, Depth: 2.9 mi) earthquake occurred 127.0 miles away from the county center
Magnitude types: body-wave magnitude (MB), local magnitude (ML), moment magnitude (MW)
Most recent natural disasters:
- Texas Covid-19 Pandemic, Incident Period: January 20, 2020, FEMA Id: 4485, Natural disaster type: Other
- Texas Severe Storms, Tornadoes, and Flooding, Incident Period: March 07, 2016 to March 29, 2016, Major Disaster (Presidential) Declared DR-4266: March 19, 2016, FEMA Id: 4266, Natural disaster type: Storm, Tornado, Flood
- Texas Wildfires, Incident Period: March 14, 2008 to September 01, 2008, Emergency Declared EM-3284: March 14, 2008, FEMA Id: 3284, Natural disaster type: Fire
- Texas Hurricane Rita, Incident Period: September 23, 2005 to October 14, 2005, Major Disaster (Presidential) Declared DR-1606: September 24, 2005, FEMA Id: 1606, Natural disaster type: Hurricane
- Texas Hurricane Rita, Incident Period: September 20, 2005 to October 14, 2005, Emergency Declared EM-3261: September 21, 2005, FEMA Id: 3261, Natural disaster type: Hurricane
- Texas Hurricane Katrina, Incident Period: August 29, 2005 to October 01, 2005, Emergency Declared EM-3216: September 02, 2005, FEMA Id: 3216, Natural disaster type: Hurricane
- Texas Loss of the Space Shuttle Columbia, Incident Period: February 01, 2003, Emergency Declared EM-3171: February 01, 2003, FEMA Id: 3171, Natural disaster type: Other
- Texas Extreme Fire Hazards, Incident Period: August 01, 1999 to December 10, 1999, Emergency Declared EM-3142: September 01, 1999, FEMA Id: 3142, Natural disaster type: Fire
- Texas Extreme Fire Hazard, Incident Period: August 30, 1993 to November 15, 1993, Emergency Declared EM-3113: September 10, 1993, FEMA Id: 3113, Natural disaster type: Fire
- Texas Severe Storm, Thunderstorms, Incident Period: December 20, 1991 to January 14, 1992, Major Disaster (Presidential) Declared DR-930: December 26, 1991, FEMA Id: 930, Natural disaster type: Storm
- 3 other natural disasters have been reported since 1953.
The number of natural disasters in Limestone County (13) is near the US average (15).
Major Disasters (Presidential) Declared: 6
Emergencies Declared: 6
Causes of natural disasters: Floods: 4, Storms: 4, Tornadoes: 4, Fires: 3, Hurricanes: 3, Wind: 1, Other: 2 (Note: some incidents may be assigned to more than one category).
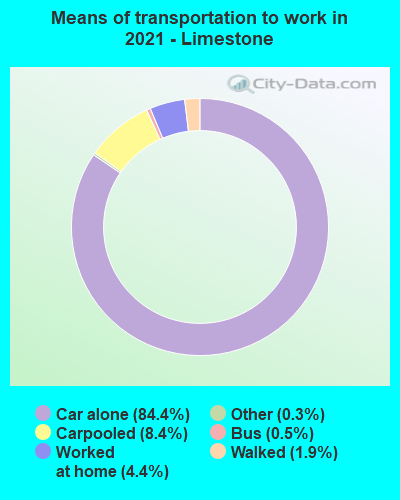
Means of transportation to work:
- Drove a car alone: 6,055 (80.2%)
- Carpooled: 491 (6.5%)
- Bus: 7 (0.1%)
- Taxicab, motorcycle, or other means: 33 (0.4%)
- Walked: 193 (2.6%)
- Worked at home: 601 (8.0%)
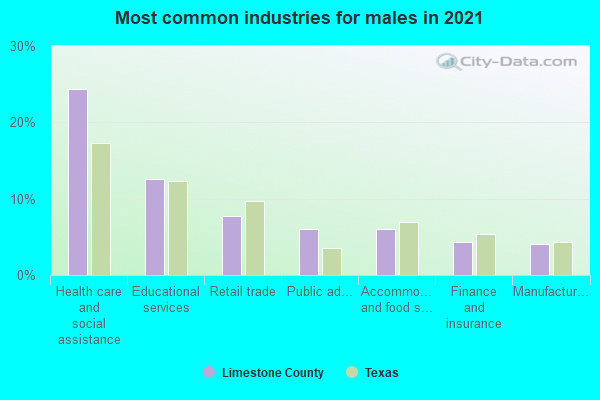
- Health care and social assistance (24%)
- Educational services (12%)
- Retail trade (10%)
- Finance and insurance (6%)
- Public administration (6%)
- Manufacturing (5%)
- Accommodation and food services (4%)
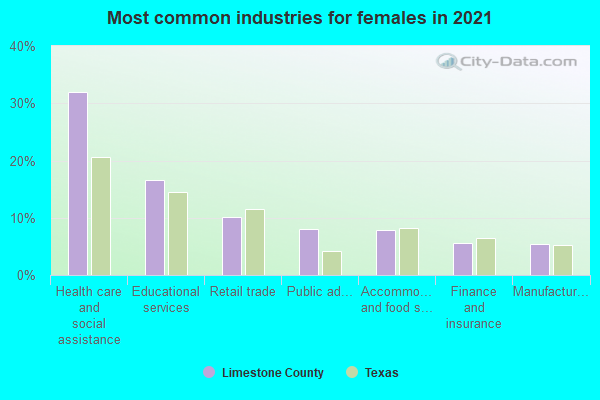
- Health care and social assistance (30%)
- Educational services (15%)
- Retail trade (12%)
- Finance and insurance (7%)
- Public administration (7%)
- Manufacturing (6%)
- Accommodation and food services (5%)
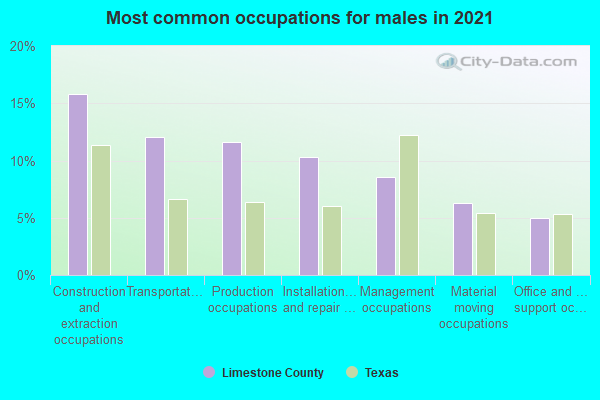
- Construction and extraction occupations (14%)
- Production occupations (14%)
- Transportation occupations (11%)
- Installation, maintenance, and repair occupations (11%)
- Management occupations (8%)
- Office and administrative support occupations (5%)
- Building and grounds cleaning and maintenance occupations (5%)
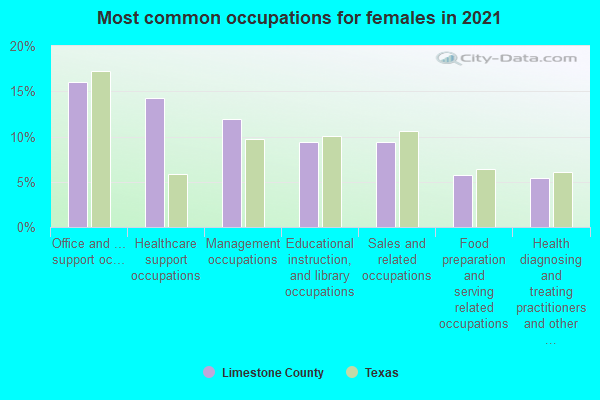
- Office and administrative support occupations (16%)
- Healthcare support occupations (13%)
- Management occupations (12%)
- Sales and related occupations (9%)
- Educational instruction, and library occupations (8%)
- Health diagnosing and treating practitioners and other technical occupations (6%)
- Building and grounds cleaning and maintenance occupations (5%)
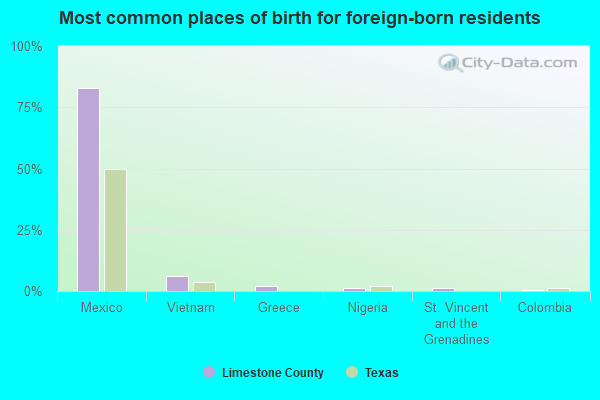
- Mexico (79%)
- Vietnam (7%)
- Guatemala (2%)
- Venezuela (2%)
- Greece (1%)
- Nigeria (1%)
- Panama (1%)
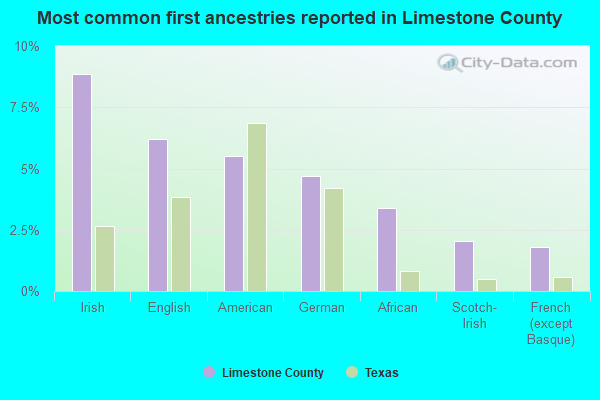
- Irish (8%)
- American (7%)
- English (6%)
- German (5%)
- African (3%)
- Scotch-Irish (3%)
- French (except Basque) (2%)
People in group quarters in Limestone County, Texas in 2010:
- 863 people in local jails and other municipal confinement facilities
- 442 people in state prisons
- 237 people in nursing facilities/skilled-nursing facilities
- 25 people in group homes intended for adults
- 17 people in residential treatment centers for adults
- 8 people in workers' group living quarters and job corps centers
People in group quarters in Limestone County, Texas in 2000:
- 902 people in local jails and other confinement facilities (including police lockups)
- 591 people in schools, hospitals, or wards for the intellectually disabled
- 335 people in nursing homes
- 18 people in homes for the mentally retarded
- 5 people in short-term care, detention or diagnostic centers for delinquent children
- 4 people in homes or halfway houses for drug/alcohol abuse
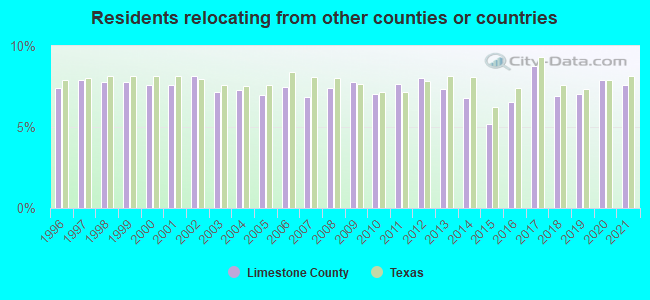
7.61% of this county's 2021 resident taxpayers lived in other counties in 2020 ($47,608 average adjusted gross income)
| Here: | 7.61% |
| Texas average: | 8.12% |
10 or fewer of this county's residents moved from foreign countries.
6.78% relocated from other counties in Texas ($42,750 average AGI)
0.83% relocated from other states ($4,858 average AGI)
Limestone County: 0.83% Texas average: 2.83%
Top counties from which taxpayers relocated into this county between 2020 and 2021:
| from McLennan County, TX | |
| from Freestone County, TX | |
| from Dallas County, TX | |
| from Harris County, TX | |
| from Tarrant County, TX | |
| from Navarro County, TX | |
| from Leon County, TX |
7.01% of this county's 2020 resident taxpayers moved to other counties in 2021 ($37,855 average adjusted gross income)
| Here: | 7.01% |
| Texas average: | 7.40% |
10 or fewer of this county's residents moved to foreign countries.
6.17% relocated to other counties in Texas ($33,919 average AGI)
0.83% relocated to other states ($3,936 average AGI)
Limestone County: 0.83% Texas average: 2.08%

Top counties to which taxpayers relocated from this county between 2020 and 2021:
| to McLennan County, TX | |
| to Freestone County, TX | |
| to Dallas County, TX | |
| to Navarro County, TX |
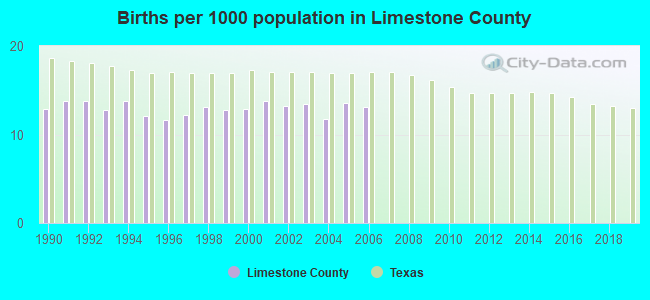
Births per 1000 population from 1990 to 1999: 12.9
Births per 1000 population from 2000 to 2006: 13.1
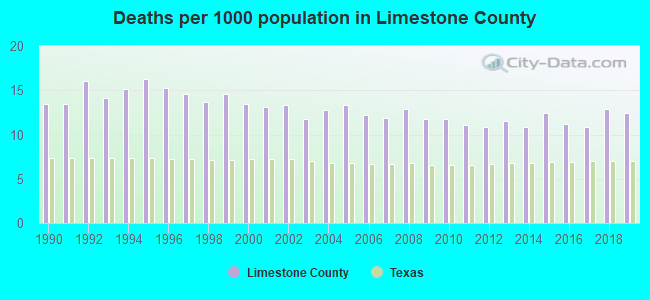
Deaths per 1000 population from 1990 to 1999: 14.7
Deaths per 1000 population from 2000 to 2009: 12.7
Deaths per 1000 population from 2010 to 2020: 11.9
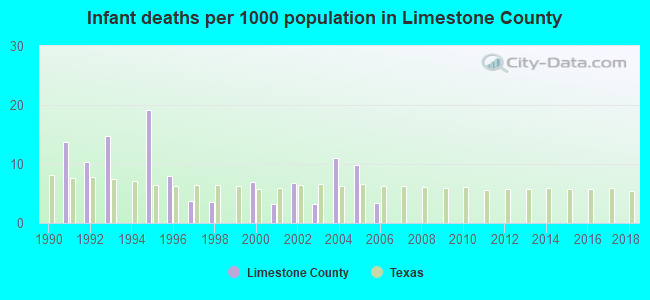
Infant deaths per 1000 live births from 1990 to 1999: 7.3
Infant deaths per 1000 live births from 2000 to 2006: 6.4
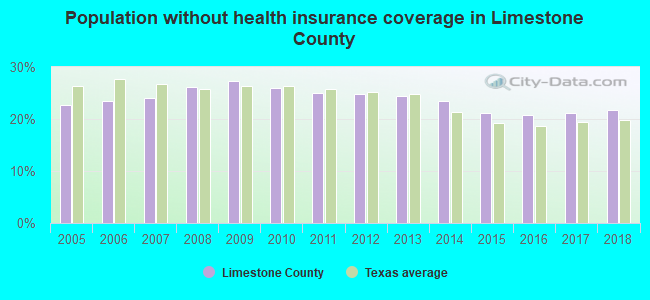
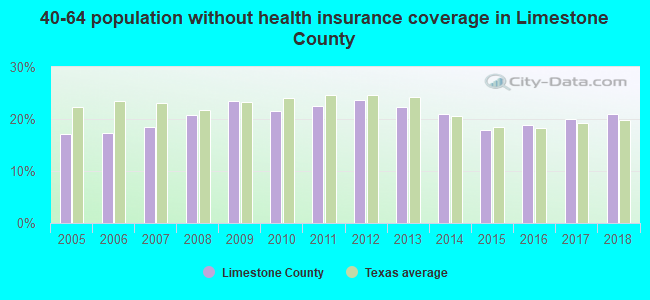
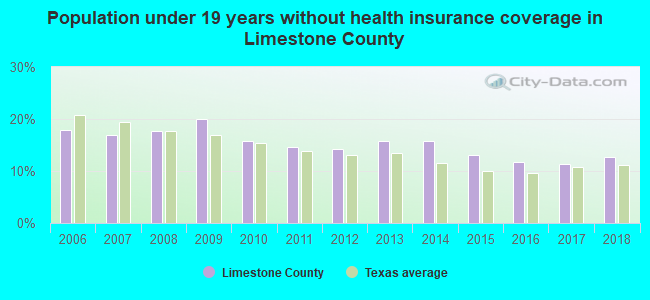
Persons under 19 years old without health insurance coverage in 2018: 12.6%
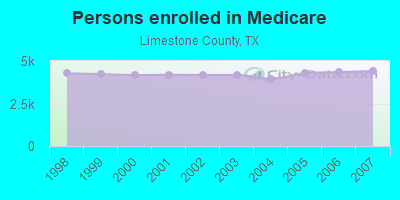
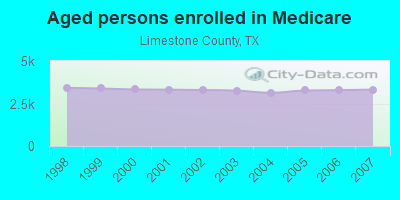
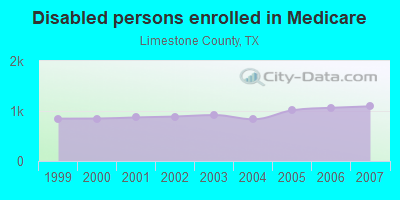
Persons enrolled in hospital insurance and/or supplemental medical insurance (Medicare) in July 1, 2007: 4,411 (3,317 aged, 1,094 disabled)
Children under 18 without health insurance coverage in 2007: 834 (16%)
Most common underlying causes of death in Limestone County, Texas in 1999 - 2019:
- Acute myocardial infarction, unspecified (550)
- Bronchus or lung, unspecified - Malignant neoplasms (339)
- Chronic obstructive pulmonary disease, unspecified (280)
- Stroke, not specified as haemorrhage or infarction (178)
- Congestive heart failure (125)
- Bacterial pneumonia, unspecified (122)
- Alzheimer disease, unspecified (121)
- Atherosclerotic heart disease (64)
- Colon, unspecified - Malignant neoplasms (12)
- Septicaemia, unspecified (11)
Population without health insurance coverage in 2000: 21%
Children under 18 without health insurance coverage in 2000: 20%
Short term general hospital admissions per 100,000 population in 2004: 13,772
Short term general hospital beds per 100,000 population in 2004: 329
Emergency room visits per 100,000 population in 2004: 73,514
General practice office based MDs per 100,000 population in 2005: 1,151
Medical specialist MDs per 100,000 population in 2005: 1,199
Dentists per 100,000 population in 1998: 4
Total births per 100,000 population, July 2005 - July 2006 : 14
Total deaths per 100,000 population, July 2005 - July 2006: 57
Limited-service eating places per 100,000 population in 2005 : 4
Crimes per 100,000 population in 1996: 1
Household type by relationship:
Households: 22,819- Male householders: 4,265 (1,272 living alone), Female householders: 4,396 (1,300 living alone)
3,823 spouses (3,797 opposite-sex spouses), 429 unmarried partners, (328 opposite-sex unmarried partners), 5,879 children (5,263 natural, 116 adopted, 501 stepchildren), 1,690 grandchildren, 374 brothers or sisters, 226 parents, 59 foster children, 383 other relatives, 392 non-relatives
- In group quarters: 928
Size of family households: 2,597 2-persons, 1,357 3-persons, 735 4-persons, 541 5-persons, 403 6-persons, 197 7-or-more-persons.
Size of nonfamily households: 2,573 1-person, 223 2-persons, 44 3-persons.
2,256 married couples with children.
1,503 single-parent households (368 men, 1,135 women).
80.9% of residents of Limestone speak English at home.
17.9% of residents speak Spanish at home (69% speak English very well, 17% speak English well, 6% speak English not well, 8% don't speak English at all).
0.4% of residents speak other Indo-European language at home (32% speak English very well, 29% speak English well, 39% speak English not well).
0.8% of residents speak Asian or Pacific Island language at home (24% speak English very well, 57% speak English well, 12% speak English not well, 8% don't speak English at all).
0.1% of residents speak other language at home (100% speak English well).
In fiscal year 2004:
Federal Government expenditure: $137,791,000 ($6,053 per capita)
Department of Defense expenditure: $3,935,000
Federal direct payments to individuals for retirement and disability: $59,451,000
Federal other direct payments to individuals: $32,030,000
Federal direct payments not to individuals: $1,545,000
Federal grants: $38,331,000
Federal procurement contracts: $2,655,000 ($1,554,000 Department of Defense)
Federal salaries and wages: $3,780,000 ($180,000 Department of Defense)
Federal Government direct loans: $159,000
Federal guaranteed/insured loans: $3,863,000
Federal Government insurance: $7,945,000
Population change from April 1, 2000 to July 1, 2005:
Births: 1,579| Here: | 69 per 1000 residents |
| State: | 85 per 1000 residents |
Deaths: 1,455
| Here: | 64 per 1000 residents |
| State: | 35 per 1000 residents |
Net international migration: +369
| Here: | +16 per 1000 residents |
| State: | +29 per 1000 residents |
Net internal migration: +252
| Here: | +11 per 1000 residents |
| State: | +10 per 1000 residents |
Total withdrawal of fresh water for public supply: 3.72 millions of gallons per day (77% from ground, 23% from surface)
| Here: | 5.7 |
| State: | 6.3 |
| Here: | 4.1 |
| State: | 4.0 |
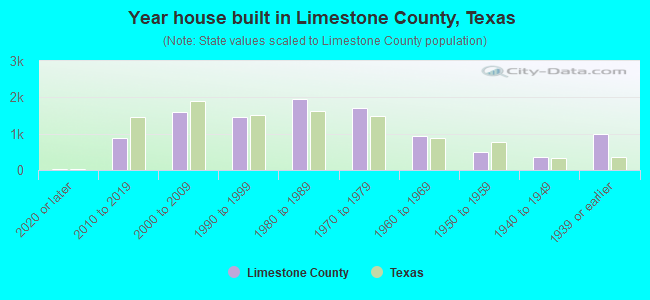
- Year house built in Limestone County, Texas
- 292020 or later
- 1,0412010 to 2019
- 1,6452000 to 2009
- 1,3031990 to 1999
- 2,0341980 to 1989
- 1,5521970 to 1979
- 8921960 to 1969
- 6011950 to 1959
- 4401940 to 1949
- 8151939 or earlier
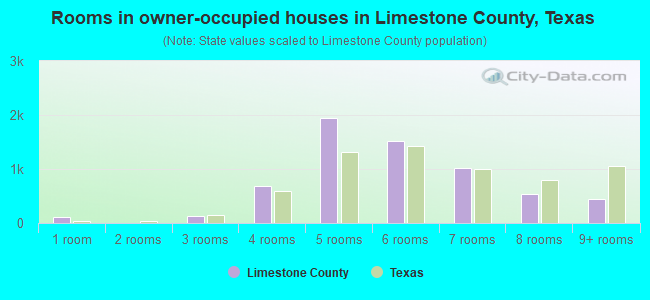
- Rooms in owner-occupied houses in Limestone County, Texas
- 1091 room
- 392 rooms
- 1593 rooms
- 7374 rooms
- 1,9495 rooms
- 1,4476 rooms
- 1,0007 rooms
- 5418 rooms
- 4949+ rooms
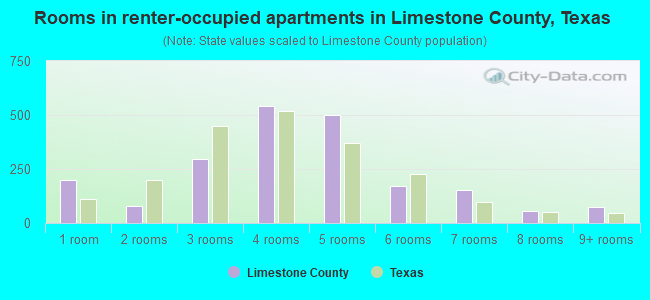
- Rooms in renter-occupied apartments in Limestone County, Texas
- 2321 room
- 512 rooms
- 3773 rooms
- 6504 rooms
- 4675 rooms
- 1346 rooms
- 1377 rooms
- 418 rooms
- 909+ rooms
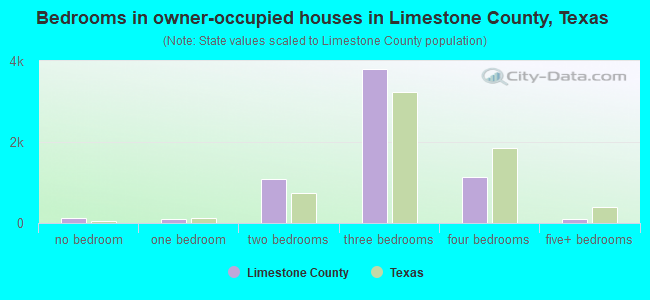
- Bedrooms in owner-occupied houses in Limestone County, Texas
- 134no bedroom
- 1361 bedroom
- 1,2802 bedrooms
- 3,7383 bedrooms
- 1,0924 bedrooms
- 845+ bedrooms
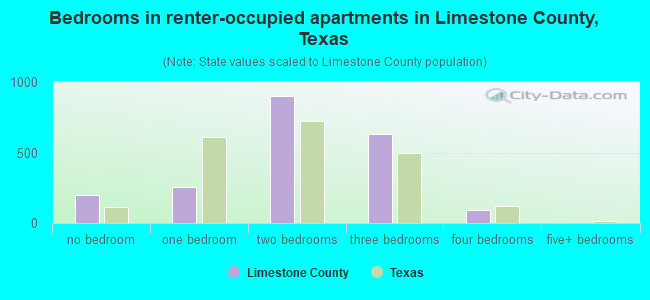
- Bedrooms in renter-occupied apartments in Limestone County, Texas
- 231no bedroom
- 2651 bedroom
- 1,0112 bedrooms
- 5633 bedrooms
- 1134 bedrooms
- 95+ bedrooms
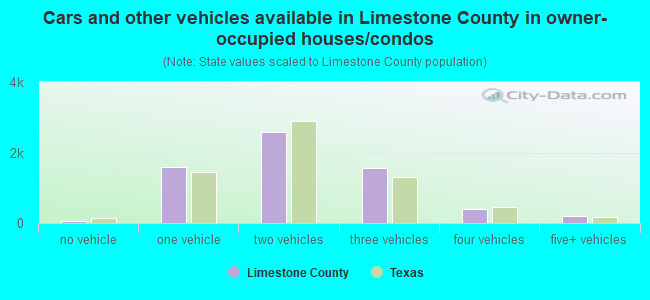
- Cars and other vehicles available in Limestone County in owner-occupied houses/condos
- 57no vehicle
- 1,5821 vehicle
- 2,7942 vehicles
- 1,5743 vehicles
- 3344 vehicles
- 1375+ vehicles
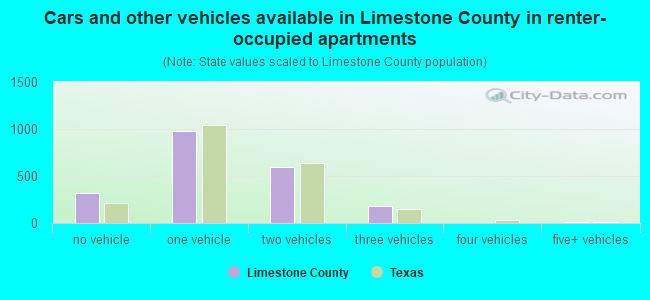
- Cars and other vehicles available in Limestone County in renter-occupied apartments
- 291no vehicle
- 1,1371 vehicle
- 5482 vehicles
- 1723 vehicles
- 274 vehicles
- 85+ vehicles
89.8% of Limestone County residents lived in the same house 1 years ago.
Out of people who lived in different houses, 32% lived in this county.
Out of people who lived in different counties, 73% lived in Texas.
| Limestone County: | 89.8% |
| State average: | 85.7% |
Place of birth for U.S.-born residents:
- This state: 17,096
- Other state: 3,158
- Northeast: 284
- Midwest: 848
- South: 1,158
- West: 867

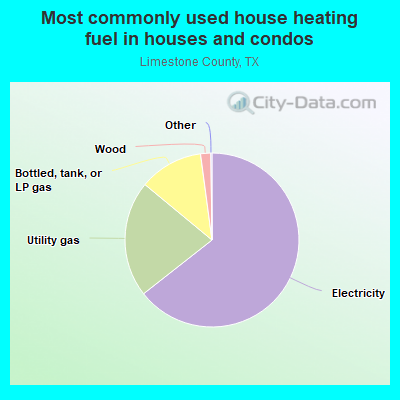
- 65.4%Electricity
- 21.0%Utility gas
- 11.7%Bottled, tank, or LP gas
- 1.8%Wood
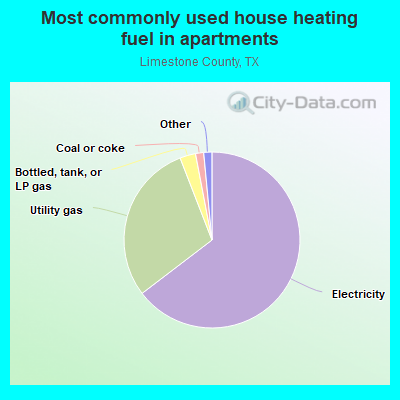
- 63.6%Electricity
- 30.9%Utility gas
- 2.3%Bottled, tank, or LP gas
- 1.4%Wood
- 1.3%Coal or coke
- 0.3%Other fuel
- 0.3%No fuel used
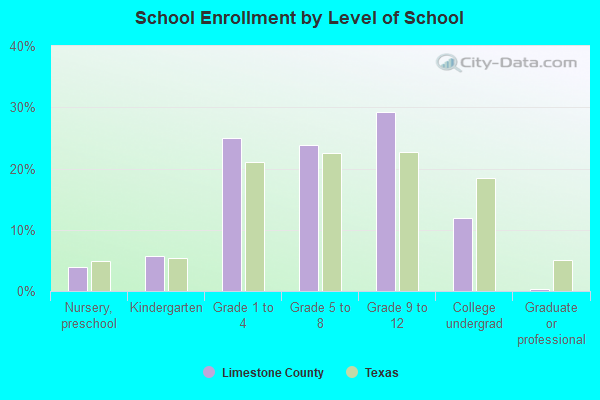
Private vs. public school enrollment:
| Here: | 3.9% |
| Texas: | 8.8% |
| Here: | 5.0% |
| Texas: | 8.0% |
| Here: | 21.4% |
| Texas: | 16.2% |
Limestone County government finances - Expenditure in 2017:
- Charges - Other: $1,308,000
Miscellaneous Commercial Activities: $764,000
Regular Highways: $261,000
Parks and Recreation: $26,000
- Current Operations - Police Protection: $5,620,000
Regular Highways: $3,065,000
Corrections - Other: $1,982,000
Judicial and Legal Services: $1,599,000
Central Staff Services: $1,392,000
Correctional Institutions: $997,000
Financial Administration: $811,000
General - Other: $733,000
General Public Buildings: $539,000
Air Transportation: $300,000
Public Welfare - Other: $297,000
Public Welfare, Vendor Payments for Medical Care: $150,000
Natural Resources - Other: $101,000
- Federal Intergovernmental - Public Welfare: $10,000
- General - Interest on Debt: $581,000
- Intergovernmental to Local - Other - Local Fire Protection: $214,000
Other - Public Welfare - Other: $60,000
Other - Health - Other: $58,000
Other - Parks and Recreation: $27,000
Other - Natural Resources - Other: $21,000
Other - Libraries: $16,000
Other - Solid Waste Management: $6,000
- Local Intergovernmental - General Local Government Support: $150,000
Public Welfare: $43,000
- Long Term Debt - Beginning Outstanding - Unspecified Public Purpose: $14,535,000
Outstanding Unspecified Public Purpose: $14,040,000
Retired Unspecified Public Purpose: $495,000
- Miscellaneous - Fines and Forfeits: $185,000
General Revenue - Other: $125,000
Interest Earnings: $43,000
Rents: $4,000
- Other Capital Outlay - Regular Highways: $348,000
Police Protection: $50,000
General Public Building: $47,000
- Other Funds - Cash and Securities: $13,055,000
- Sinking Funds - Cash and Securities: $2,091,000
- State Intergovernmental - General Local Government Support: $662,000
Highways: $277,000
Public Welfare: $158,000
Other: $35,000
- Tax - Property: $15,339,000
Motor Vehicle License: $365,000
Alcoholic Beverage License: $8,000
- Total Salaries and Wages: $8,198,000
Limestone County government finances - Revenue in 2017:
- Charges - Other: $1,308,000
Miscellaneous Commercial Activities: $764,000
Regular Highways: $261,000
Parks and Recreation: $26,000
- Current Operations - Police Protection: $5,620,000
Regular Highways: $3,065,000
Corrections - Other: $1,982,000
Judicial and Legal Services: $1,599,000
Central Staff Services: $1,392,000
Correctional Institutions: $997,000
Financial Administration: $811,000
General - Other: $733,000
General Public Buildings: $539,000
Air Transportation: $300,000
Public Welfare - Other: $297,000
Public Welfare, Vendor Payments for Medical Care: $150,000
Natural Resources - Other: $101,000
- Federal Intergovernmental - Public Welfare: $10,000
- General - Interest on Debt: $581,000
- Intergovernmental to Local - Other - Local Fire Protection: $214,000
Other - Public Welfare - Other: $60,000
Other - Health - Other: $58,000
Other - Parks and Recreation: $27,000
Other - Natural Resources - Other: $21,000
Other - Libraries: $16,000
Other - Solid Waste Management: $6,000
- Local Intergovernmental - General Local Government Support: $150,000
Public Welfare: $43,000
- Long Term Debt - Beginning Outstanding - Unspecified Public Purpose: $14,535,000
Outstanding Unspecified Public Purpose: $14,040,000
Retired Unspecified Public Purpose: $495,000
- Miscellaneous - Fines and Forfeits: $185,000
General Revenue - Other: $125,000
Interest Earnings: $43,000
Rents: $4,000
- Other Capital Outlay - Regular Highways: $348,000
Police Protection: $50,000
General Public Building: $47,000
- Other Funds - Cash and Securities: $13,055,000
- Sinking Funds - Cash and Securities: $2,091,000
- State Intergovernmental - General Local Government Support: $662,000
Highways: $277,000
Public Welfare: $158,000
Other: $35,000
- Tax - Property: $15,339,000
Motor Vehicle License: $365,000
Alcoholic Beverage License: $8,000
- Total Salaries and Wages: $8,198,000
Limestone County government finances - Debt in 2017:
- Charges - Other: $1,308,000
Miscellaneous Commercial Activities: $764,000
Regular Highways: $261,000
Parks and Recreation: $26,000
- Current Operations - Police Protection: $5,620,000
Regular Highways: $3,065,000
Corrections - Other: $1,982,000
Judicial and Legal Services: $1,599,000
Central Staff Services: $1,392,000
Correctional Institutions: $997,000
Financial Administration: $811,000
General - Other: $733,000
General Public Buildings: $539,000
Air Transportation: $300,000
Public Welfare - Other: $297,000
Public Welfare, Vendor Payments for Medical Care: $150,000
Natural Resources - Other: $101,000
- Federal Intergovernmental - Public Welfare: $10,000
- General - Interest on Debt: $581,000
- Intergovernmental to Local - Other - Local Fire Protection: $214,000
Other - Public Welfare - Other: $60,000
Other - Health - Other: $58,000
Other - Parks and Recreation: $27,000
Other - Natural Resources - Other: $21,000
Other - Libraries: $16,000
Other - Solid Waste Management: $6,000
- Local Intergovernmental - General Local Government Support: $150,000
Public Welfare: $43,000
- Long Term Debt - Beginning Outstanding - Unspecified Public Purpose: $14,535,000
Outstanding Unspecified Public Purpose: $14,040,000
Retired Unspecified Public Purpose: $495,000
- Miscellaneous - Fines and Forfeits: $185,000
General Revenue - Other: $125,000
Interest Earnings: $43,000
Rents: $4,000
- Other Capital Outlay - Regular Highways: $348,000
Police Protection: $50,000
General Public Building: $47,000
- Other Funds - Cash and Securities: $13,055,000
- Sinking Funds - Cash and Securities: $2,091,000
- State Intergovernmental - General Local Government Support: $662,000
Highways: $277,000
Public Welfare: $158,000
Other: $35,000
- Tax - Property: $15,339,000
Motor Vehicle License: $365,000
Alcoholic Beverage License: $8,000
- Total Salaries and Wages: $8,198,000
Limestone County government finances - Cash and Securities in 2017:
- Charges - Other: $1,308,000
Miscellaneous Commercial Activities: $764,000
Regular Highways: $261,000
Parks and Recreation: $26,000
- Current Operations - Police Protection: $5,620,000
Regular Highways: $3,065,000
Corrections - Other: $1,982,000
Judicial and Legal Services: $1,599,000
Central Staff Services: $1,392,000
Correctional Institutions: $997,000
Financial Administration: $811,000
General - Other: $733,000
General Public Buildings: $539,000
Air Transportation: $300,000
Public Welfare - Other: $297,000
Public Welfare, Vendor Payments for Medical Care: $150,000
Natural Resources - Other: $101,000
- Federal Intergovernmental - Public Welfare: $10,000
- General - Interest on Debt: $581,000
- Intergovernmental to Local - Other - Local Fire Protection: $214,000
Other - Public Welfare - Other: $60,000
Other - Health - Other: $58,000
Other - Parks and Recreation: $27,000
Other - Natural Resources - Other: $21,000
Other - Libraries: $16,000
Other - Solid Waste Management: $6,000
- Local Intergovernmental - General Local Government Support: $150,000
Public Welfare: $43,000
- Long Term Debt - Beginning Outstanding - Unspecified Public Purpose: $14,535,000
Outstanding Unspecified Public Purpose: $14,040,000
Retired Unspecified Public Purpose: $495,000
- Miscellaneous - Fines and Forfeits: $185,000
General Revenue - Other: $125,000
Interest Earnings: $43,000
Rents: $4,000
- Other Capital Outlay - Regular Highways: $348,000
Police Protection: $50,000
General Public Building: $47,000
- Other Funds - Cash and Securities: $13,055,000
- Sinking Funds - Cash and Securities: $2,091,000
- State Intergovernmental - General Local Government Support: $662,000
Highways: $277,000
Public Welfare: $158,000
Other: $35,000
- Tax - Property: $15,339,000
Motor Vehicle License: $365,000
Alcoholic Beverage License: $8,000
- Total Salaries and Wages: $8,198,000
Supplemental Security Income (SSI) in 2006:
- Total number of recipients: 797
- Number of aged recipients: 83
- Number of blind and disabled recipients: 714
- Number of recipients under 18: 149
- Number of recipients between 18 and 64: 490
- Number of recipients older than 64: 158
- Number of recipients also receiving OASDI: 271
- Amount of payments (thousands of dollars): 264
| Most common first names in Limestone County, TX among deceased individuals | ||
| Name | Count | Lived (average) |
|---|---|---|
| James | 246 | 73.0 years |
| Mary | 238 | 79.2 years |
| William | 220 | 74.5 years |
| John | 212 | 76.4 years |
| Willie | 124 | 76.0 years |
| George | 119 | 75.7 years |
| Robert | 116 | 73.4 years |
| Ruby | 99 | 79.6 years |
| Thomas | 86 | 74.3 years |
| Joe | 78 | 69.1 years |
| Most common last names in Limestone County, TX among deceased individuals | ||
| Last name | Count | Lived (average) |
|---|---|---|
| Smith | 137 | 75.2 years |
| Jones | 127 | 75.6 years |
| Johnson | 113 | 74.4 years |
| Williams | 94 | 75.6 years |
| Jackson | 82 | 77.8 years |
| Davis | 79 | 75.4 years |
| Thompson | 69 | 80.8 years |
| Carter | 66 | 75.3 years |
| Wilson | 65 | 75.8 years |
| Brown | 59 | 71.3 years |
| Businesses in Limestone County, TX | ||||
| Name | Count | Name | Count | |
|---|---|---|---|---|
| AT&T | 1 | Lane Furniture | 1 | |
| AutoZone | 1 | McDonald's | 1 | |
| Best Western | 2 | Nike | 3 | |
| CVS | 1 | Pizza Hut | 1 | |
| Chevrolet | 1 | RadioShack | 1 | |
| ColorTyme | 1 | SONIC Drive-In | 2 | |
| Curves | 1 | Sears | 1 | |
| Dairy Queen | 1 | Subway | 3 | |
| Days Inn | 1 | Taco Bell | 1 | |
| FedEx | 2 | True Value | 1 | |
| Ford | 1 | U-Haul | 3 | |
| H&R Block | 2 | UPS | 1 | |
| Holiday Inn | 1 | Walmart | 1 | |
| La-Z-Boy | 1 | |||