Estimated zip code population in 2022: 25,721 Zip code population in 2010: 25,552 Zip code population in 2000: 25,632
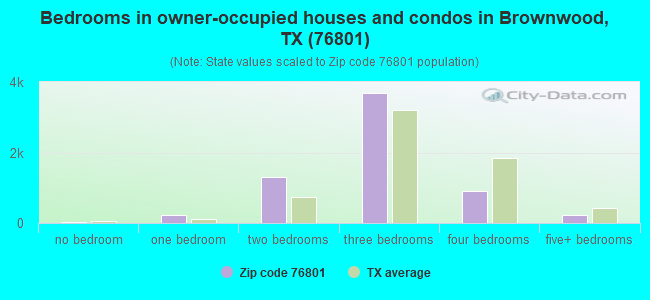
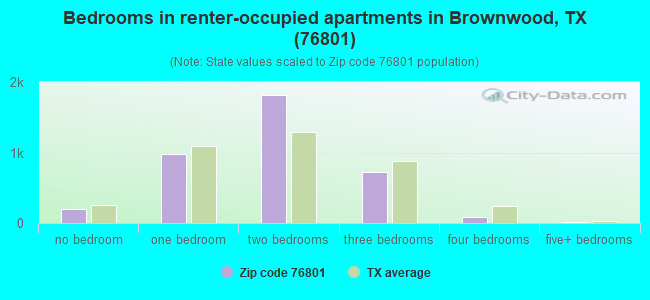
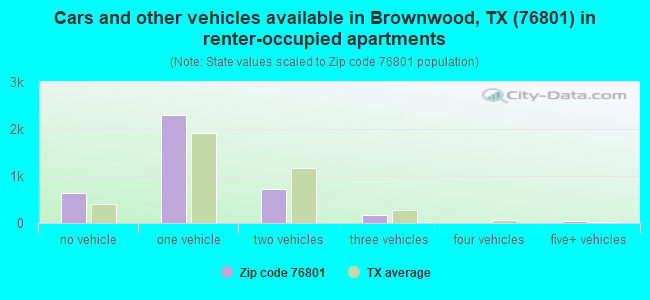
Houses and condos: 12,376 Renter-occupied apartments: 3,824
% of renters here:
37%
State:
38%
March 2022 cost of living index in zip code 76801: 78.0 (low, U.S. average is 100)
Land area: 381.9 sq. mi. Water area: 9.6 sq. mi.
Population density: 67 people per square mile
(very low).
OSM Map
General Map
Google Map
MSN Map
OSM Map
General Map
Google Map
MSN Map
OSM Map
General Map
Google Map
MSN Map
OSM Map
General Map
Google Map
MSN Map
Please wait while loading the map...
Real estate property taxes paid for housing units in 2022:
This zip code:
1.2% ($1,778)
Texas:
1.5% ($4,050)
Median real estate property taxes paid for housing units with mortgages in 2022: $2,534 (1.5%) Median real estate property taxes paid for housing units with no mortgage in 2022: $1,253 (1.0%)
Business Search- 14 Million verified businesses
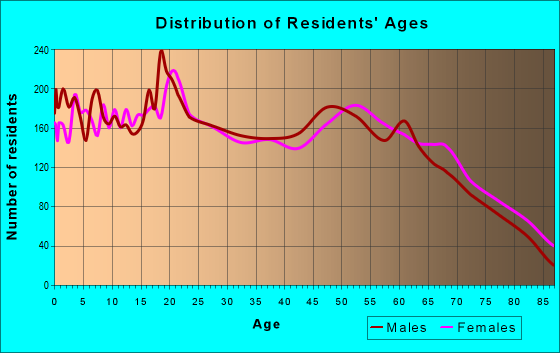
Males: 12,943
(50.3%)
Females: 12,777
(49.7%)
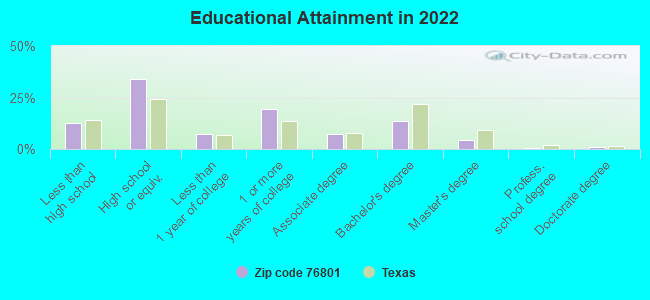
For population 25 years and over in 76801:
High school or higher: 86.2%
Bachelor's degree or higher: 19.4%
Graduate or professional degree: 5.8%
Unemployed: 3.1%
Mean travel time to work (commute): 16.3 minutes
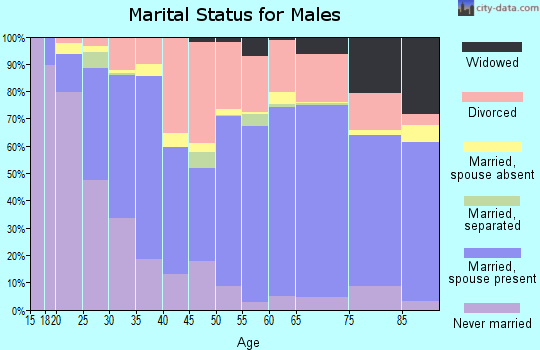
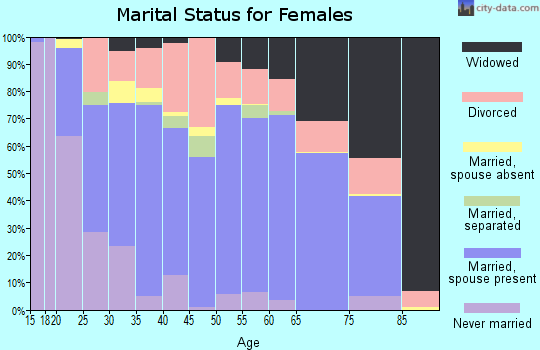
For population 15 years and over in 76801:
Never married: 30.6%
Now married: 46.2%
Separated: 2.5%
Widowed: 7.4%
Divorced: 13.4%
Zip code 76801 compared to state average:
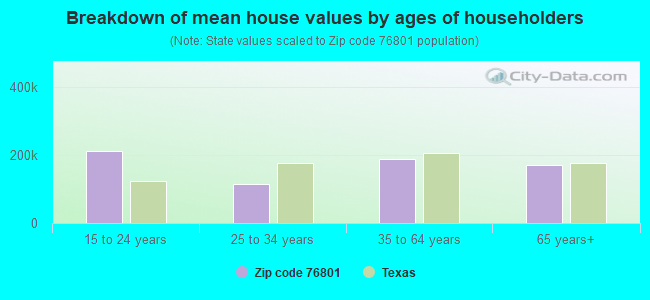
Median house value below state average.
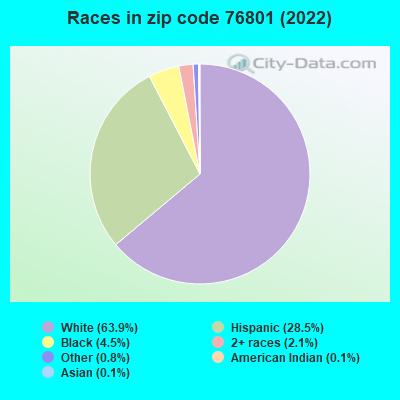
Black race population percentage below state average.
Foreign-born population percentage significantly below state average.
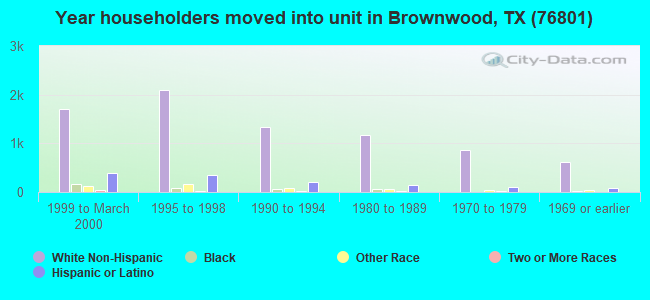
Length of stay since moving in above state average.
House age above state average.
Percentage of population with a bachelor's degree or higher below state average.
Averages for the 2020 tax year for zip code 76801, filed in 2021:
Average Adjusted Gross Income (AGI) in 2020: $54,091 (Individual Income Tax Returns)
Here:
$54,091
State:
$77,054
Salary/wage: $43,381 (reported on 82.2% of returns)
Here:
$43,381
State:
$62,766
(% of AGI for various income ranges: 1158.3% for AGIs below $25k, 3401.8% for AGIs $25k-50k, 6051.1% for AGIs $50k-75k, 8852.2% for AGIs $75k-100k, 15074.6% for AGIs $100k-200k, 74036.7% for AGIs over 200k)
Taxable interest for individuals: $1,470 (reported on 20.9% of returns)
This zip code:
$1,470
Texas:
$2,665
(% of AGI for various income ranges: 8.0% for AGIs below $25k, 15.6% for AGIs $25k-50k, 34.7% for AGIs $50k-75k, 68.7% for AGIs $75k-100k, 110.7% for AGIs $100k-200k, 1836.7% for AGIs over 200k)
Ordinary dividends: $7,842 (reported on 11.2% of returns)
Here:
$7,842
State:
$10,044
(% of AGI for various income ranges: 10.8% for AGIs below $25k, 18.4% for AGIs $25k-50k, 43.1% for AGIs $50k-75k, 90.3% for AGIs $75k-100k, 270.4% for AGIs $100k-200k, 9481.7% for AGIs over 200k)
Net capital gain/loss in AGI: +$19,668 (reported on 10.7% of returns)
Here:
+$19,668
State:
+$39,590
(% of AGI for various income ranges: 4.5% for AGIs below $25k, 22.5% for AGIs $25k-50k, 75.9% for AGIs $50k-75k, 124.8% for AGIs $75k-100k, 629.3% for AGIs $100k-200k, 26308.3% for AGIs over 200k)
Profit/loss from business: +$14,028 (reported on 14.8% of returns)
Here:
+$14,028
State:
+$10,888
(% of AGI for various income ranges: 109.1% for AGIs below $25k, 111.9% for AGIs $25k-50k, 161.4% for AGIs $50k-75k, 263.0% for AGIs $75k-100k, 1035.6% for AGIs $100k-200k, 10045.0% for AGIs over 200k)
Taxable individual retirement arrangement distribution: $20,965 (reported on 7.7% of returns)
76801:
$20,965
Texas:
$24,740
(% of AGI for various income ranges: 42.5% for AGIs below $25k, 80.4% for AGIs $25k-50k, 169.6% for AGIs $50k-75k, 354.3% for AGIs $75k-100k, 939.6% for AGIs $100k-200k, 6650.0% for AGIs over 200k)
Self-employed (Keogh) retirement plans: $26,550 (reported on 0.2% of returns)
76801:
$26,550
Texas:
$29,298
(% of AGI for various income ranges: 93.2% for AGIs $100k-200k)
Total itemized deductions: $35,784 (reported on 3.1% of returns)
Here:
$35,784
State:
$40,428
(% of AGI for various income ranges: 12.9% for AGIs below $25k, 42.4% for AGIs $25k-50k, 121.8% for AGIs $50k-75k, 231.2% for AGIs $75k-100k, 558.6% for AGIs $100k-200k, 6881.7% for AGIs over 200k)
Charity contributions: $17,369 (reported on 2.5% of returns)
Here:
$17,369
State:
$18,201
(% of AGI for various income ranges: 7.4% for AGIs $25k-50k, 32.5% for AGIs $50k-75k, 48.0% for AGIs $75k-100k, 198.4% for AGIs $100k-200k, 4266.7% for AGIs over 200k)
Taxes paid: $6,100 (reported on 2.9% of returns)
76801:
$6,100
State:
$7,821
(% of AGI for various income ranges: 2.1% for AGIs below $25k, 7.0% for AGIs $25k-50k, 17.5% for AGIs $50k-75k, 28.0% for AGIs $75k-100k, 102.5% for AGIs $100k-200k, 1091.7% for AGIs over 200k)
Earned income credit: $2,522 (reported on 23.9% of returns)
Here:
$2,522
State:
$2,584
(% of AGI for various income ranges: 128.9% for AGIs below $25k, 92.0% for AGIs $25k-50k, 2.2% for AGIs $50k-75k)
Percentage of individuals using paid preparers for their 2020 taxes: 94.6%
Here:
95%
State:
92%
(% for various income ranges: 94.5% for AGIs below $25k, 95.2% for AGIs $25k-50k, 94.6% for AGIs $50k-75k, 94.1% for AGIs $75k-100k, 93.9% for AGIs $100k-200k, 95.8% for AGIs over 200k)
Averages for the 2012 tax year for zip code 76801, filed in 2013:
Average Adjusted Gross Income (AGI) in 2012: $41,715 (Individual Income Tax Returns)
Here:
$41,715
State:
$65,384
Salary/wage: $35,164 (reported on 84.8% of returns)
Here:
$35,164
State:
$52,524
(% of AGI for various income ranges: 79.8% for AGIs below $25k, 81.7% for AGIs $25k-50k, 78.2% for AGIs $50k-75k, 73.6% for AGIs $75k-100k, 63.4% for AGIs $100k-200k, 42.3% for AGIs over 200k)
Taxable interest for individuals: $1,259 (reported on 21.8% of returns)
This zip code:
$1,259
Texas:
$2,372
(% of AGI for various income ranges: 0.8% for AGIs below $25k, 0.4% for AGIs $25k-50k, 0.6% for AGIs $50k-75k, 0.4% for AGIs $75k-100k, 0.8% for AGIs $100k-200k, 1.0% for AGIs over 200k)
Ordinary dividends: $4,709 (reported on 11.2% of returns)
Here:
$4,709
State:
$9,721
(% of AGI for various income ranges: 1.1% for AGIs below $25k, 0.8% for AGIs $25k-50k, 0.5% for AGIs $50k-75k, 0.8% for AGIs $75k-100k, 1.7% for AGIs $100k-200k, 3.4% for AGIs over 200k)
Net capital gain/loss in AGI: +$7,430 (reported on 9.3% of returns)
Here:
+$7,430
State:
+$35,319
(% of AGI for various income ranges: 0.4% for AGIs $25k-50k, 0.7% for AGIs $50k-75k, 0.5% for AGIs $75k-100k, 3.5% for AGIs $100k-200k, 6.1% for AGIs over 200k)
Profit/loss from business: +$14,147 (reported on 15.2% of returns)
Here:
+$14,147
State:
+$13,732
(% of AGI for various income ranges: 6.4% for AGIs below $25k, 3.2% for AGIs $25k-50k, 2.0% for AGIs $50k-75k, 3.4% for AGIs $75k-100k, 6.8% for AGIs $100k-200k, 11.9% for AGIs over 200k)
Taxable individual retirement arrangement distribution: $15,028 (reported on 7.7% of returns)
76801:
$15,028
Texas:
$19,511
(% of AGI for various income ranges: 1.8% for AGIs below $25k, 2.4% for AGIs $25k-50k, 2.2% for AGIs $50k-75k, 2.4% for AGIs $75k-100k, 4.7% for AGIs $100k-200k, 3.3% for AGIs over 200k)
Self-employment retirement plans: $15,033 (reported on 0.3% of returns)
76801:
$15,033
Texas:
$23,938
Total itemized deductions: $20,765 (21% of AGI, reported on 13.2% of returns)
Here:
$20,765
State:
$24,724
Here:
20.9% of AGI
State:
15.9% of AGI
(% of AGI for various income ranges: 3.7% for AGIs below $25k, 4.7% for AGIs $25k-50k, 6.1% for AGIs $50k-75k, 7.2% for AGIs $75k-100k, 10.3% for AGIs $100k-200k, 8.0% for AGIs over 200k)
Charity contributions: $7,253 (reported on 9.9% of returns)
Here:
$7,253
State:
$6,808
(% of AGI for various income ranges: 0.5% for AGIs below $25k, 0.7% for AGIs $25k-50k, 1.2% for AGIs $50k-75k, 2.1% for AGIs $75k-100k, 3.2% for AGIs $100k-200k, 3.3% for AGIs over 200k)
Taxes paid: $4,637 (reported on 12.7% of returns)
76801:
$4,637
State:
$6,921
(% of AGI for various income ranges: 0.7% for AGIs below $25k, 0.8% for AGIs $25k-50k, 1.2% for AGIs $50k-75k, 1.5% for AGIs $75k-100k, 2.5% for AGIs $100k-200k, 2.0% for AGIs over 200k)
Earned income credit: $2,372 (reported on 29.0% of returns)
Here:
$2,372
State:
$2,570
(% of AGI for various income ranges: 9.3% for AGIs below $25k, 1.6% for AGIs $25k-50k)
Percentage of individuals using paid preparers for their 2012 taxes: 51.7%
Here:
52%
State:
51%
(% for various income ranges: 46.8% for AGIs below $25k, 53.6% for AGIs $25k-50k, 52.8% for AGIs $50k-75k, 57.7% for AGIs $75k-100k, 64.7% for AGIs $100k-200k, 85.7% for AGIs over 200k)
Averages for the 2004 tax year for zip code 76801, filed in 2005:
Average Adjusted Gross Income (AGI) in 2004: $33,318 (Individual Income Tax Returns)
Here:
$33,318
State:
$47,881
Salary/wage: $29,666 (reported on 84.4% of returns)
Here:
$29,666
State:
$41,947
(% of AGI for various income ranges: 124.2% for AGIs below $10k, 78.6% for AGIs $10k-25k, 82.5% for AGIs $25k-50k, 80.6% for AGIs $50k-75k, 75.3% for AGIs $75k-100k, 51.7% for AGIs over 100k)
Taxable interest for individuals: $2,026 (reported on 29.2% of returns)
This zip code:
$2,026
Texas:
$2,255
(% of AGI for various income ranges: 5.5% for AGIs below $10k, 1.9% for AGIs $10k-25k, 1.3% for AGIs $25k-50k, 1.2% for AGIs $50k-75k, 1.8% for AGIs $75k-100k, 2.5% for AGIs over 100k)
Taxable dividends: $2,424 (reported on 14.2% of returns)
Here:
$2,424
State:
$4,261
(% of AGI for various income ranges: 1.6% for AGIs below $10k, 0.8% for AGIs $10k-25k, 0.6% for AGIs $25k-50k, 0.6% for AGIs $50k-75k, 0.7% for AGIs $75k-100k, 2.4% for AGIs over 100k)
Net capital gain/loss: +$5,272 (reported on 13.3% of returns)
Here:
+$5,272
State:
+$16,110
(% of AGI for various income ranges: -1.2% for AGIs below $10k, 0.3% for AGIs $10k-25k, 0.8% for AGIs $25k-50k, 0.9% for AGIs $50k-75k, 1.5% for AGIs $75k-100k, 7.0% for AGIs over 100k)
Profit/loss from business: +$10,178 (reported on 15.1% of returns)
Here:
+$10,178
State:
+$11,013
(% of AGI for various income ranges: 5.9% for AGIs below $10k, 5.1% for AGIs $10k-25k, 2.2% for AGIs $25k-50k, 2.4% for AGIs $50k-75k, 3.9% for AGIs $75k-100k, 10.0% for AGIs over 100k)
IRA payment deduction: $2,987 (reported on 1.6% of returns)
76801:
$2,987
Texas:
$3,120
(% of AGI for various income ranges: 0.2% for AGIs $10k-25k, 0.1% for AGIs $25k-50k, 0.2% for AGIs $50k-75k, 0.1% for AGIs $75k-100k, 0.1% for AGIs over 100k)
Self-employed pension: $12,186 (reported on 0.5% of returns)
Here:
$12,186
Texas:
$16,401
Total itemized deductions: $17,252 (22% of AGI, reported on 11.9% of returns)
Here:
$17,252
State:
$19,631
Here:
21.5% of AGI
State:
18.9% of AGI
(% of AGI for various income ranges: 5.1% for AGIs below $10k, 4.1% for AGIs $10k-25k, 4.4% for AGIs $25k-50k, 5.7% for AGIs $50k-75k, 8.3% for AGIs $75k-100k, 9.1% for AGIs over 100k)
Charity contributions deductions: $5,727 (7% of AGI, reported on 9.9% of returns)
Here:
$5,727
State:
$4,753
Here:
6.8% of AGI
State:
4.2% of AGI
(% of AGI for various income ranges: 0.4% for AGIs below $10k, 0.6% for AGIs $10k-25k, 1.0% for AGIs $25k-50k, 1.4% for AGIs $50k-75k, 2.4% for AGIs $75k-100k, 3.5% for AGIs over 100k)
Total tax: $4,918 (reported on 65.5% of returns)
76801:
$4,918
State:
$9,058
(% of AGI for various income ranges: 3.4% for AGIs below $10k, 3.5% for AGIs $10k-25k, 5.9% for AGIs $25k-50k, 8.8% for AGIs $50k-75k, 11.3% for AGIs $75k-100k, 19.6% for AGIs over 100k)
Earned income credit: $1,860 (reported on 26.6% of returns)
Here:
$1,860
State:
$2,024
Percentage of individuals using paid preparers for their 2004 taxes: 59.6%
Here:
60%
State:
57%
(% for various income ranges: 53.2% for AGIs below $10k, 60.4% for AGIs $10k-25k, 60.5% for AGIs $25k-50k, 61.3% for AGIs $50k-75k, 63.0% for AGIs $75k-100k, 77.0% for AGIs over 100k)
Household received Food Stamps/SNAP in the past 12 months: 1,400 Household did not receive Food Stamps/SNAP in the past 12 months: 8,817
Women who had a birth in the past 12 months: 197 (144 now married, 53 unmarried) Women who did not have a birth in the past 12 months: 5,910 (2,252 now married, 3,669 unmarried)
Housing units in zip code 76801 with a mortgage: 2,881 (45 second mortgage, 48 both second mortgage and home equity loan) Houses without a mortgage: 36
Median monthly owner costs for units with a mortgage: $1,357 Median monthly owner costs for units without a mortgage: $492
Residents with income below the poverty level in 2022:
This zip code:
15.3%
Whole state:
14.0%
Residents with income below 50% of the poverty level in 2022:
This zip code:
7.6%
Whole state:
7.4%
Median number of rooms in houses and condos:
Here:
5.9
State:
6.3
Median number of rooms in apartments:
Here:
4.1
State:
4.0
Notable locations in this zip code not listed on our city pages
Notable locations in zip code 76801: Gravity (A), US Agricultural Experiment (B), J A Walker House and R B Rogers House (C), Brown County Court House (D), Lake Brownwood Volunteer Fire Department (E), Lake Dam Volunteer Fire Department (F), Brownwood Fire Department Station 1 (G), Brownwood Fire Marshal's Office (H), Brownwood Fire Department Station 2 (I), Douglas MacArthur Academy of Freedom Museum (J), Air Evac Lifeteam Brownwood Base (K), Guardian Emergency Medical Services (L), Brown County Jail (M). Display/hide their locations on the map
Churches in zip code 76801 include: Rocky Creek Church (A), Church of the Nazarene (B), River of Life Community Church (C), Greater Faith Community Church (D), Christ Chapel Church (E), Seventh Day Adventist Church (F), Central United Methodist Church (G), Saint Johns Episcopal Church (H), First Church of the Nazarene (I). Display/hide their locations on the map
Cemeteries: Smith Cemetery (1), Elkins Cemetery (2), Cedar Point Cemetery (3), Greenleaf Cemetery (4), Jordan Springs Cemetery (5), Ebony Cemetery (6), Indian Creek Cemetery (7). Display/hide their locations on the map
Reservoirs: Camp Bowie Reservoir (A), Brownwood Lateral Watershed Number 4A (B), Brownwood Lateral Watershed Number 4-B (C), Brownwood Lateral Watershed Number 23 (D), Soil Conservation Service Site 3 Reservoir (E), Northeast Lateral Watersheds Number Two (F), Northeast Lateral Watershed Number Five (G), Northeast Lateral Watershed Number Four (H). Display/hide their locations on the map
Streams, rivers, and creeks: Antelope Creek (A), Turner Creek (B), Turkey Creek (C), Short Creek (D), Red River (E), Pasture Branch (F), Panther Creek (G), Paint Creek (H), Mud Creek (I). Display/hide their locations on the map
Parks in zip code 76801 include: Kiwanis Park (1), Vincent Street Park (2), Sharp Park (3), Red Stone Park (4), Thomason Park (5), Stonegate Park (6), Mayes Park (7), Sportsman Park (8), Wiggins Park (9). Display/hide their locations on the map
2,523 married couples with children.
1,856 single-parent households (247 men, 1,609 women).
80.0% of residents of 76801 zip code speak English at home.
19.6% of residents speak Spanish at home (83% very well, 7% well, 10% not well, 1% not at all).
0.4% of residents speak other Indo-European language at home (49% very well, 12% well, 39% not at all).
0.1% of residents speak Asian or Pacific Island language at home (100% very well).
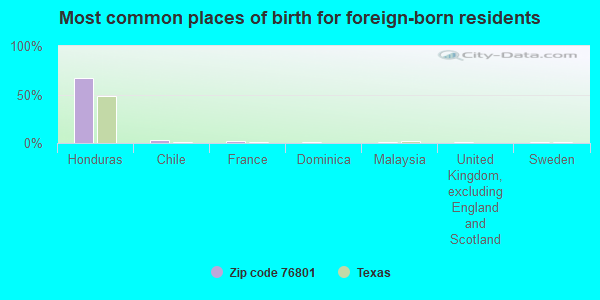
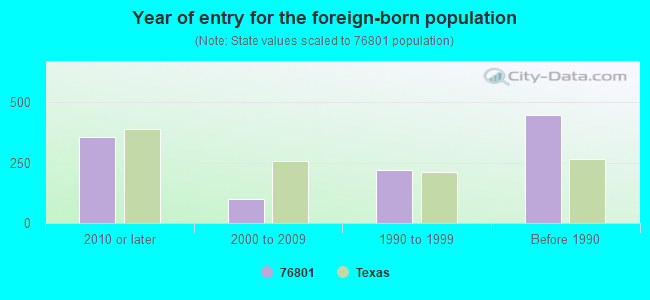
Foreign born population: 1,015 (3.9%) (37.1% of them are naturalized citizens)
This zip code:
3.9%
Whole state:
17.2%
67%Honduras
3%Chile
2%France
1%Dominica
1%Malaysia
1%United Kingdom, excluding England and Scotland
1%Sweden
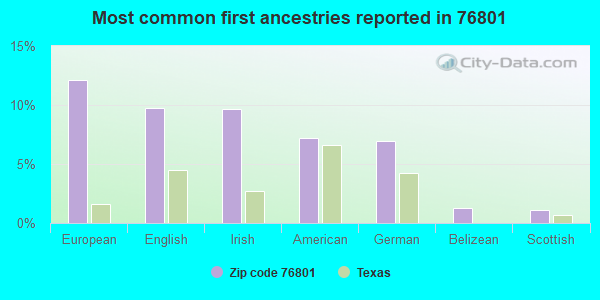
12%European
10%English
10%Irish
7%American
7%German
1%Belizean
1%Scottish
Year of entry for the foreign-born population
3582010 or later
982000 to 2009
2191990 to 1999
447Before 1990
Facilities with environmental interests located in this zip code:
3M CO BROWNWOOD (4501 HIGHWAY 377 SOUTH in BROWNWOOD, TX)
AIR MAJOR (AIRS/AFS) CRITERIA AND HAZARDOUS AIR POLLUTANT INVENTORY (Inventory of air pollution sources) PERFORMANCE TRACK (National Environmental Performance Track) HAZARDOUS WASTE BIENNIAL REPORTER (Resource Conservation and Recovery Act (tracking hazardous waste)) Large Quantity Generators, more that 1000 kg of hazardous waste/month (Resource Conservation and Recovery Act (tracking hazardous waste)) - notification TRANSPORTER (Resource Conservation and Recovery Act (tracking hazardous waste)) TSD (Resource Conservation and Recovery Act (tracking hazardous waste)) TRI REPORTER (Tracking of toxic chemicals releasing facilities) Business SIC classification: PAINTS, VARNISHES, LACQUERS, ENAMELS, AND ALLIED PRODUCTS; UNSUPPORTED PLASTICS FILM AND SHEET; PRESSED AND BLOWN GLASS AND GLASSWARE Business NAICS classification: PAINT AND COATING MANUFACTURING.; UNLAMINATED PLASTICS FILM AND SHEET (EXCEPT PACKAGING) MANUFACTURING. Organizations: 3M COMPANY (CONTACT/OPERATOR)
Alternative names: 3M CO., 3M CO. BROWNWOOD, MINNESOTA MINING & MFG., MS. SARA ZOSS, PH.D., P.O. BOX 1669
AFCO NO 10109 (209 MAIN in BROWNWOOD, TX)
Conditionally Exempt Small Quantity Generators, less than 100 kg/month of hazardous waste (Resource Conservation and Recovery Act (tracking hazardous waste)) - notification Organizations: MICOR ENERGY LLC DBA AFCO (CONTACT/OWNER)
AMERICAN LEASING, TEXAS STAR (307 W. ADAMS in BROWNWOOD, TX)
ENFORCEMENT/COMPLIANCE ACTIVITY (Integrated Compliance Information System)
Housing units lacking complete plumbing facilities: 2.9% Housing units lacking complete kitchen facilities: 4.6%
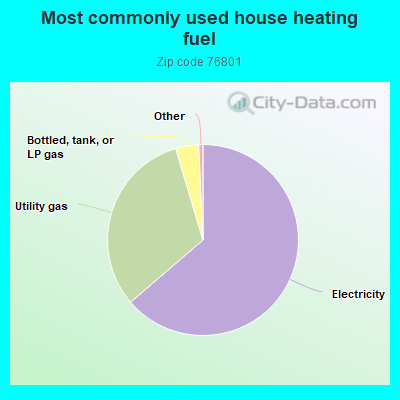
63.7%Electricity
31.7%Utility gas
3.9%Bottled, tank, or LP gas
Population in 1990: 24,634. Population change in the 1990s: +998 (+4.1%).
Place of birth for U.S.-born residents:
This state: 19,821
Northeast: 323
Midwest: 1,000
South: 1,301
West: 2,026
48% of the 76801 zip code residents lived in the same house 5 years ago. Out of people who lived in different houses, 52% lived in this county. Out of people who lived in different counties, 50% lived in Texas.
85% of the 76801 zip code residents lived in the same house 1 year ago. Out of people who lived in different houses, 53% moved from this county. Out of people who lived in different houses, 38% moved from different county within same state. Out of people who lived in different houses, 6% moved from different state. Out of people who lived in different houses, 0% moved from abroad.
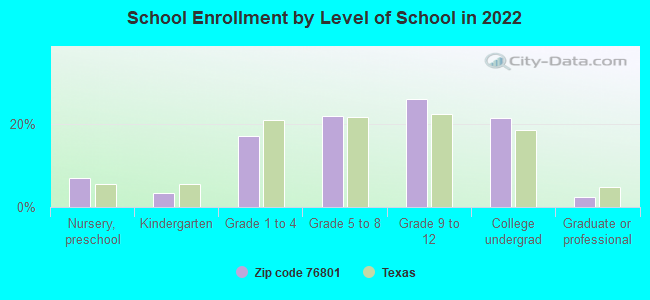
Private vs. public school enrollment:
Students in private schools in grades 1 to 8 (elementary and middle school): 57
Here:
2.6%
Texas:
8.8%
Students in private schools in grades 9 to 12 (high school): 206
Here:
14.1%
Texas:
8.0%
Students in private undergraduate colleges: 387
Here:
32.0%
Texas:
16.2%
Occupation by median earnings in the past 12 months ($)
115,996Life, physical, and social science occupations
91,208Architecture and engineering occupations
70,443Legal occupations
69,543Computer and mathematical occupations
63,173Production occupations
61,930Health diagnosing and treating practitioners and other technical occupations
Companies with biggest federal contracts located in this zip code (BROWNWOOD, TX):
HILL COUNTRY LEATHER, INC (2103 FISK STREET; small business) : $2,326,080 in 15 contractsfrom 2000 to 2006
Contracts for Miscellaneous Weapons, Guns, through 30 mm by Defense Logistics Agency, Air Force Signed by year:2000: $614,684; 2001: $151,043; 2002: $1,370,466; 2003: $86,781; 2004: $0; 2005: $85,468; 2006: $17,638.
Biggest contracts:
$844,459 with Defense Logistics Agency for Miscellaneous Weapons. Signed on 2002-01-15. Completion date: 2002-05-15.
$309,644, same as above.Signed on 2000-04-28. Completion date: 2000-08-26.
$305,040, same as above.Signed on 2000-02-10. Completion date: 2000-06-09.
$302,880, same as above.Signed on 2002-09-11. Completion date: 2003-04-09.
HOWEY ENTERPRISES INC (1314 COGGIN AVE; small business) : $202,042 in 29 contractsfrom 2002 to 2006
Contracts for Food Services, Purchase of Structures and Facilities -- Dining Facilities, Food, Oils and Fats by Army Signed by year:2000: $0; 2001: $0; 2002: $44,762; 2003: $50,355; 2004: $44,875; 2005: $44,005; 2006: $18,045.
Biggest contracts:
$26,850 with Army for Food Services. Signed on 2004-11-19. Completion date: 2005-02-04.
$24,508, same as above.Signed on 2005-11-09. Completion date: 2006-01-13.
$19,800, same as above.Signed on 2004-04-01. Completion date: 2004-05-28.
$19,720 with Army for Purchase of Structures and Facilities -- Dining Facilities. Signed on 2005-03-02. Completion date: 2005-04-22.
ENTERPRISE ANESTHESIA SERVICES (2711 GREY FOX TRAIL; small business) : $133,898 in 8 contractsfrom 2003 to 2006
Contracts for Anesthesiology Services by Army Signed by year:2000: $0; 2001: $0; 2002: $0; 2003: $107,250; 2004: $34,846; 2005: $60,988; 2006: -$69,186.
Biggest contracts:
$78,000 with Army for Anesthesiology Services. Signed on 2004-10-07. Completion date: 2003-09-30.
$78,000, same as above.Signed on 2003-10-20. Completion date: 2003-09-30.
$74,880, same as above.Signed on 2005-11-11. Completion date: 2003-09-30.
$29,250, same as above.Signed on 2003-03-05. Completion date: 2003-09-30.
LEMONS BAR BQ (3202 COGGIN AVE; small business) : $66,101 in 3 contractsfrom 2002 to 2005
$40,400 with Army for Condiments and Related Products. Signed on 2005-07-29. Completion date: 2005-08-12.
$21,068 with Army for Food Services. Signed on 2002-04-04. Completion date: 2002-05-23.
$4,633, same as above.Signed on 2004-11-04. Completion date: 2004-11-07.
INGRAM ENTERPRISES LP (4301 DANHIL DR; small business) : $34,235 in 4 contractsfrom 2004 to 2006
$15,500 with Army for Miscellaneous Construction Materials. Signed on 2006-03-16. Completion date: 2006-03-28.
$9,755 with Army for Maintenance, Repair and Rebuilding of Equipment -- Ores, Minerals, and Their Primary Products. Signed on 2006-06-08. Completion date: 2006-06-23.
$8,680 with Army for Miscellaneous Construction Equipment. Signed on 2004-08-23. Completion date: 2004-08-25.
$300 with Army for Miscellaneous Construction Materials. Signed on 2006-04-27. Completion date: 2006-03-28.
B&W CARRIER INC (909 N FISK; small business) : $32,852 in 6 contractsfrom 2003 to 2005
Contracts for Flags and Pennants, Outerwear, Men's by Army Signed by year:2000: $0; 2001: $0; 2002: $0; 2003: $32,329; 2004: $0; 2005: $523; 2006: $0.
Biggest contracts:
$13,985 with Army for Flags and Pennants. Signed on 2003-09-21. Completion date: 2003-10-24.
$8,948, same as above.Signed on 2003-04-16. Completion date: 2003-04-29.
$7,330 with Army for Outerwear, Men's. Signed on 2003-08-19. Completion date: 2003-08-20.
$1,699 with Army for Flags and Pennants. Signed on 2003-05-05. Completion date: 2003-05-21.
SMITTY'S BAR B QUE (708 W AUSTIN AVE; small business) : $10,416 in 2 contractsfrom 2003 to 2004
$5,616 with Army for Condiments and Related Products. Signed on 2003-10-16. Completion date: 2003-10-19.
$4,800 with Army for Forage and Feed. Signed on 2004-04-23. Completion date: 2004-04-25.
CHARLES PITTS PORTABLE TOILETS (3060 CR 315; small business)
$6,180 with Army for Sewage Treatment Equipment. Signed on 2005-04-22. Completion date: 2005-06-30.
BROWNWOOD JDS INC (2514 GOOD SHEPHERD DR; small business)
$3,600 with Army for Condiments and Related Products. Signed on 2005-10-27. Completion date: 2005-10-23.
BOWMAN, INC (1500 CENTER; small business)
$3,331 with Army for Lumber and Related Basic Wood Materials. Signed on 2003-08-20. Completion date: 2003-08-28.
Top industries in this zip code by the number of employees in 2005:
Health Care and Social Assistance: General Medical and Surgical Hospitals (500-999 employees: 1 establishment)
Health Care and Social Assistance: Offices of Physicians (except Mental Health Specialists) (20-49: 4, 10-19: 10, 5-9: 9, 1-4: 13)
Educational Services: Colleges, Universities, and Professional Schools (250-499: 1)
Health Care and Social Assistance: Nursing Care Facilities (100-249: 1, 50-99: 2, 5-9: 1, 1-4: 1)
People in group quarters in 2010:
456 people in college/university student housing
421 people in state prisons
340 people in nursing facilities/skilled-nursing facilities
112 people in correctional facilities intended for juveniles
62 people in workers' group living quarters and job corps centers
52 people in other noninstitutional facilities
47 people in residential treatment centers for adults
16 people in group homes intended for adults
8 people in group homes for juveniles (non-correctional)
People in group quarters in 2000:
520 people in other types of correctional institutions
499 people in college dormitories (includes college quarters off campus)
439 people in training schools for juvenile delinquents
345 people in nursing homes
96 people in schools, hospitals, or wards for the intellectually disabled
57 people in local jails and other confinement facilities (including police lockups)
33 people in homes for the mentally retarded
19 people in homes or halfway houses for drug/alcohol abuse
18 people in other noninstitutional group quarters
Fatal accident statistics in 2014:
Fatal accident count: 1
Vehicles involved in fatal accidents: 1
Fatal accidents caused by drunken drivers: 0
Fatalities: 1
Persons involved in fatal accidents: 1
Pedestrians involved in fatal accidents: 0
Fatal accident statistics in 2013:
Fatal accident count: 1
Vehicles involved in fatal accidents: 2
Fatal accidents caused by drunken drivers: 0
Fatalities: 1
Persons involved in fatal accidents: 4
Pedestrians involved in fatal accidents: 0
2002 - 2018 National Fire Incident Reporting System (NFIRS) incidents
According to the data from the years 2002 - 2018 the average number of fire incidents per year is 143. The highest number of fire incidents - 232 took place in 2011, and the least - 24 in 2004. The data has a declining trend.
When looking into fire subcategories, the most reports belonged to: Outside Fires (59.6%), and Structure Fires (26.5%).
Fire incident types reported to NFIRS in Zip Code 76801


 Nearest zip codes: 76802, 76823, 76857, 76432, 76827, 76890.
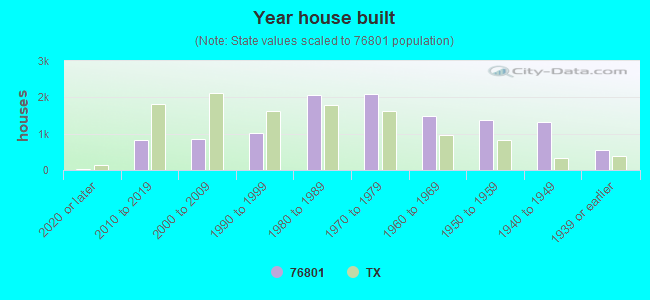


 According to the data from the years 2002 - 2018 the average number of fire incidents per year is 143. The highest number of fire incidents - 232 took place in 2011, and the least - 24 in 2004. The data has a declining trend.
 When looking into fire subcategories, the most reports belonged to: Outside Fires (59.6%), and Structure Fires (26.5%).