Estimated zip code population in 2022: 5,819 Zip code population in 2010: 5,075 Zip code population in 2000: 4,780
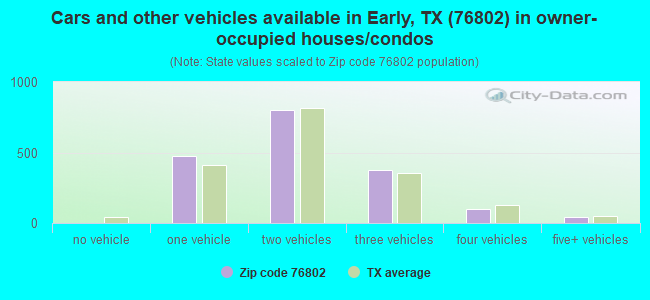
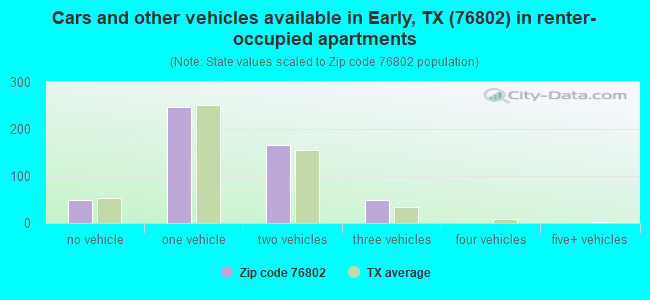
Houses and condos: 2,593 Renter-occupied apartments: 508
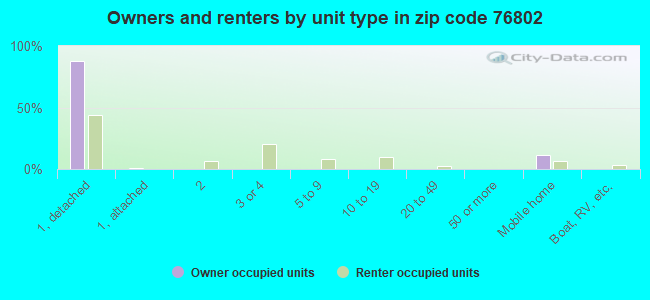
% of renters here:
22%
State:
38%
March 2022 cost of living index in zip code 76802: 80.6 (low, U.S. average is 100)
Land area: 72.3 sq. mi. Water area: 0.1 sq. mi.
Population density: 80 people per square mile
(very low).
OSM Map
General Map
Google Map
MSN Map
OSM Map
General Map
Google Map
MSN Map
OSM Map
General Map
Google Map
MSN Map
OSM Map
General Map
Google Map
MSN Map
Please wait while loading the map...
Real estate property taxes paid for housing units in 2022:
This zip code:
1.4% ($2,907)
Texas:
1.5% ($4,050)
Median real estate property taxes paid for housing units with mortgages in 2022: $3,676 (1.4%) Median real estate property taxes paid for housing units with no mortgage in 2022: $2,209 (1.4%)
Business Search- 14 Million verified businesses
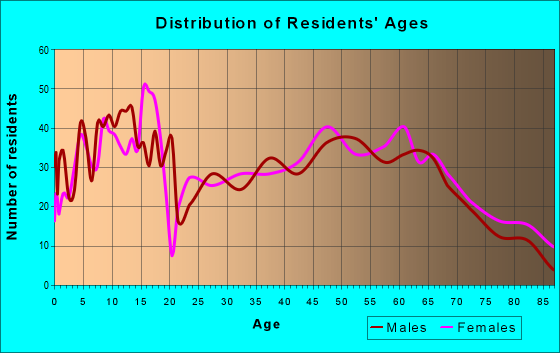
Males: 2,782
(47.8%)
Females: 3,036
(52.2%)
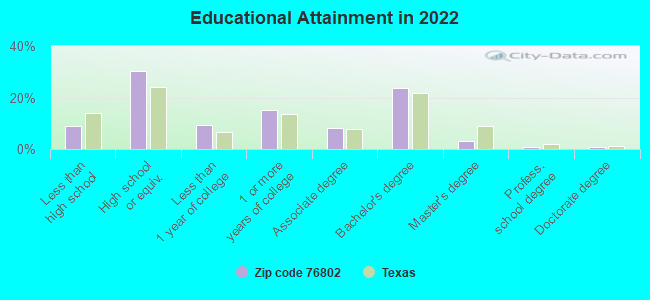
For population 25 years and over in 76802:
High school or higher: 90.8%
Bachelor's degree or higher: 27.8%
Graduate or professional degree: 4.4%
Unemployed: 3.5%
Mean travel time to work (commute): 22.8 minutes
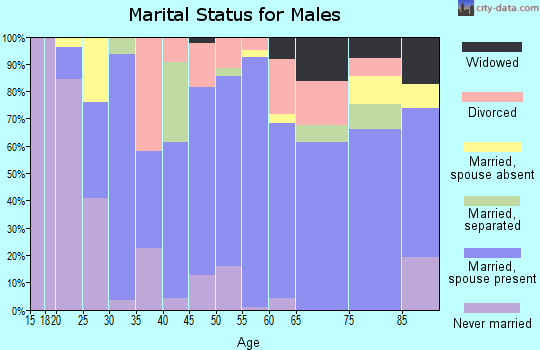
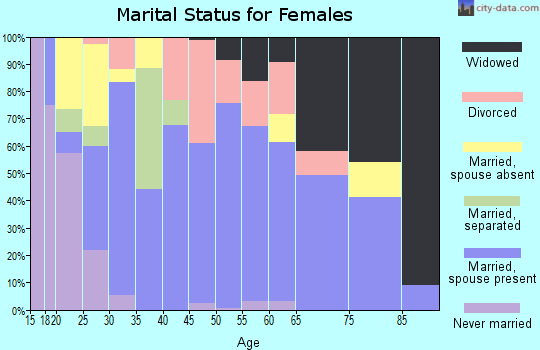
For population 15 years and over in 76802:
Never married: 19.3%
Now married: 58.5%
Separated: 3.9%
Widowed: 8.7%
Divorced: 9.6%
Zip code 76802 compared to state average:
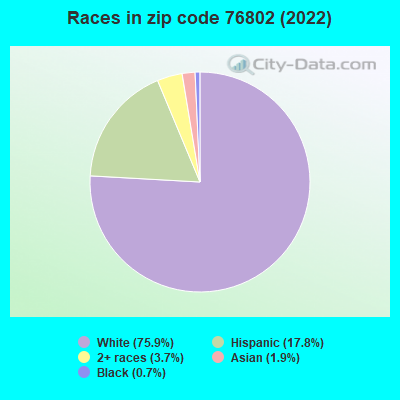
Black race population percentage significantly below state average.
Hispanic race population percentage below state average.
Median age above state average.
Foreign-born population percentage significantly below state average.
Renting percentage below state average.
Length of stay since moving in significantly above state average.
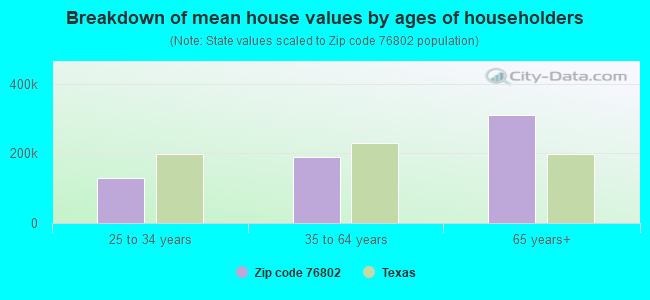
Estimated median house/condo value in 2022: $211,526
76802:
$211,526
Texas:
$275,400
According to our research of Texas and other state lists, there were 10 registered sex offenders living in 76802 zip code as of April 27, 2024. The ratio of all residents to sex offenders in zip code 76802 is 504 to 1. The ratio of registered sex offenders to all residents in this zip code is near the state average.
Median resident age:
This zip code:
42.0 years
Texas median age:
35.6 years
Average household size:
This zip code:
2.5 people
Texas:
2.6 people
Averages for the 2020 tax year for zip code 76802, filed in 2021:
Average Adjusted Gross Income (AGI) in 2020: $55,621 (Individual Income Tax Returns)
Here:
$55,621
State:
$77,054
Salary/wage: $47,581 (reported on 80.3% of returns)
Here:
$47,581
State:
$62,766
(% of AGI for various income ranges: 1061.0% for AGIs below $25k, 3194.1% for AGIs $25k-50k, 5841.1% for AGIs $50k-75k, 8874.4% for AGIs $75k-100k, 15616.3% for AGIs $100k-200k)
Taxable interest for individuals: $686 (reported on 26.4% of returns)
This zip code:
$686
Texas:
$2,665
(% of AGI for various income ranges: 7.1% for AGIs below $25k, 14.9% for AGIs $25k-50k, 34.4% for AGIs $50k-75k, 56.1% for AGIs $75k-100k, 40.5% for AGIs $100k-200k)
Ordinary dividends: $4,189 (reported on 15.1% of returns)
Here:
$4,189
State:
$10,044
(% of AGI for various income ranges: 19.2% for AGIs below $25k, 32.0% for AGIs $25k-50k, 115.2% for AGIs $50k-75k, 81.1% for AGIs $75k-100k, 174.2% for AGIs $100k-200k)
Net capital gain/loss in AGI: +$13,394 (reported on 15.1% of returns)
Here:
+$13,394
State:
+$39,590
(% of AGI for various income ranges: 3.4% for AGIs below $25k, 35.9% for AGIs $25k-50k, 129.3% for AGIs $50k-75k, 96.7% for AGIs $75k-100k, 422.6% for AGIs $100k-200k)
Profit/loss from business: +$12,817 (reported on 17.2% of returns)
Here:
+$12,817
State:
+$10,888
(% of AGI for various income ranges: 113.1% for AGIs below $25k, 210.4% for AGIs $25k-50k, 224.4% for AGIs $50k-75k, 465.6% for AGIs $75k-100k, 1094.2% for AGIs $100k-200k)
Taxable individual retirement arrangement distribution: $15,052 (reported on 9.6% of returns)
76802:
$15,052
Texas:
$24,740
(% of AGI for various income ranges: 66.0% for AGIs below $25k, 124.1% for AGIs $25k-50k, 274.1% for AGIs $50k-75k, 358.9% for AGIs $75k-100k, 557.4% for AGIs $100k-200k)
Total itemized deductions: $32,750 (reported on 3.3% of returns)
Here:
$32,750
State:
$40,428
(% of AGI for various income ranges: 379.6% for AGIs $50k-75k, 839.5% for AGIs $100k-200k)
Charity contributions: $12,800 (reported on 2.9% of returns)
Here:
$12,800
State:
$18,201
(% of AGI for various income ranges: 108.1% for AGIs $50k-75k, 317.9% for AGIs $100k-200k)
Taxes paid: $6,038 (reported on 3.3% of returns)
76802:
$6,038
State:
$7,821
(% of AGI for various income ranges: 70.7% for AGIs $50k-75k, 153.7% for AGIs $100k-200k)
Earned income credit: $2,238 (reported on 17.6% of returns)
Here:
$2,238
State:
$2,584
(% of AGI for various income ranges: 88.7% for AGIs below $25k, 79.6% for AGIs $25k-50k)
Percentage of individuals using paid preparers for their 2020 taxes: 95.0%
Here:
95%
State:
92%
(% for various income ranges: 96.2% for AGIs below $25k, 95.0% for AGIs $25k-50k, 94.6% for AGIs $50k-75k, 92.3% for AGIs $75k-100k, 96.9% for AGIs $100k-200k, 80.0% for AGIs over 200k)
Averages for the 2012 tax year for zip code 76802, filed in 2013:
Average Adjusted Gross Income (AGI) in 2012: $44,714 (Individual Income Tax Returns)
Here:
$44,714
State:
$65,384
Salary/wage: $39,953 (reported on 81.3% of returns)
Here:
$39,953
State:
$52,524
(% of AGI for various income ranges: 76.9% for AGIs below $25k, 75.2% for AGIs $25k-50k, 74.9% for AGIs $50k-75k, 75.0% for AGIs $75k-100k, 66.0% for AGIs $100k-200k)
Taxable interest for individuals: $850 (reported on 31.5% of returns)
This zip code:
$850
Texas:
$2,372
(% of AGI for various income ranges: 1.0% for AGIs below $25k, 0.7% for AGIs $25k-50k, 0.5% for AGIs $50k-75k, 0.3% for AGIs $75k-100k, 0.6% for AGIs $100k-200k)
Ordinary dividends: $3,323 (reported on 14.8% of returns)
Here:
$3,323
State:
$9,721
(% of AGI for various income ranges: 1.0% for AGIs below $25k, 1.0% for AGIs $25k-50k, 0.8% for AGIs $50k-75k, 0.5% for AGIs $75k-100k, 1.8% for AGIs $100k-200k)
Net capital gain/loss in AGI: +$3,457 (reported on 14.8% of returns)
Here:
+$3,457
State:
+$35,319
(% of AGI for various income ranges: 1.1% for AGIs $25k-50k, 1.3% for AGIs $50k-75k, 0.2% for AGIs $75k-100k, 2.1% for AGIs $100k-200k)
Profit/loss from business: +$7,811 (reported on 18.2% of returns)
Here:
+$7,811
State:
+$13,732
(% of AGI for various income ranges: 6.1% for AGIs below $25k, 3.5% for AGIs $25k-50k, 2.8% for AGIs $50k-75k, 5.3% for AGIs $75k-100k, 0.8% for AGIs $100k-200k)
Taxable individual retirement arrangement distribution: $10,837 (reported on 9.4% of returns)
76802:
$10,837
Texas:
$19,511
(% of AGI for various income ranges: 3.2% for AGIs below $25k, 3.3% for AGIs $25k-50k, 2.4% for AGIs $50k-75k, 4.0% for AGIs $75k-100k)
Total itemized deductions: $19,532 (22% of AGI, reported on 15.3% of returns)
Here:
$19,532
State:
$24,724
Here:
22.2% of AGI
State:
15.9% of AGI
(% of AGI for various income ranges: 4.9% for AGIs below $25k, 6.6% for AGIs $25k-50k, 5.9% for AGIs $50k-75k, 7.0% for AGIs $75k-100k, 7.8% for AGIs $100k-200k)
Charity contributions: $6,971 (reported on 11.8% of returns)
Here:
$6,971
State:
$6,808
(% of AGI for various income ranges: 0.8% for AGIs below $25k, 1.3% for AGIs $25k-50k, 1.4% for AGIs $50k-75k, 2.1% for AGIs $75k-100k, 2.8% for AGIs $100k-200k)
Taxes paid: $4,445 (reported on 15.3% of returns)
76802:
$4,445
State:
$6,921
(% of AGI for various income ranges: 0.8% for AGIs below $25k, 1.4% for AGIs $25k-50k, 1.4% for AGIs $50k-75k, 1.6% for AGIs $75k-100k, 1.9% for AGIs $100k-200k)
Earned income credit: $2,305 (reported on 20.7% of returns)
Here:
$2,305
State:
$2,570
(% of AGI for various income ranges: 6.9% for AGIs below $25k, 1.6% for AGIs $25k-50k)
Percentage of individuals using paid preparers for their 2012 taxes: 54.2%
Here:
54%
State:
51%
(% for various income ranges: 51.8% for AGIs below $25k, 54.2% for AGIs $25k-50k, 57.6% for AGIs $50k-75k, 50.0% for AGIs $75k-100k, 64.7% for AGIs $100k-200k)
Averages for the 2004 tax year for zip code 76802, filed in 2005:
Average Adjusted Gross Income (AGI) in 2004: $36,233 (Individual Income Tax Returns)
Here:
$36,233
State:
$47,881
Salary/wage: $34,101 (reported on 83.8% of returns)
Here:
$34,101
State:
$41,947
(% of AGI for various income ranges: 152.9% for AGIs below $10k, 75.0% for AGIs $10k-25k, 79.9% for AGIs $25k-50k, 82.3% for AGIs $50k-75k, 81.6% for AGIs $75k-100k, 63.2% for AGIs over 100k)
Taxable interest for individuals: $1,427 (reported on 36.6% of returns)
This zip code:
$1,427
Texas:
$2,255
(% of AGI for various income ranges: 9.3% for AGIs below $10k, 2.9% for AGIs $10k-25k, 1.8% for AGIs $25k-50k, 1.0% for AGIs $50k-75k, 0.7% for AGIs $75k-100k, 0.7% for AGIs over 100k)
Taxable dividends: $1,248 (reported on 16.1% of returns)
Here:
$1,248
State:
$4,261
(% of AGI for various income ranges: 2.4% for AGIs below $10k, 0.9% for AGIs $10k-25k, 0.6% for AGIs $25k-50k, 0.3% for AGIs $50k-75k, 0.2% for AGIs $75k-100k, 0.7% for AGIs over 100k)
Net capital gain/loss: +$7,783 (reported on 14.3% of returns)
Here:
+$7,783
State:
+$16,110
(% of AGI for various income ranges: 2.8% for AGIs below $10k, 0.6% for AGIs $10k-25k, 0.5% for AGIs $25k-50k, 0.9% for AGIs $50k-75k, 1.0% for AGIs $75k-100k, 15.1% for AGIs over 100k)
Profit/loss from business: +$6,571 (reported on 17.6% of returns)
Here:
+$6,571
State:
+$11,013
(% of AGI for various income ranges: 3.1% for AGIs below $10k, 7.0% for AGIs $10k-25k, 3.2% for AGIs $25k-50k, 1.8% for AGIs $50k-75k, 4.0% for AGIs $75k-100k, 2.1% for AGIs over 100k)
IRA payment deduction: $2,778 (reported on 1.5% of returns)
76802:
$2,778
Texas:
$3,120
Total itemized deductions: $16,393 (24% of AGI, reported on 13.4% of returns)
Here:
$16,393
State:
$19,631
Here:
24.2% of AGI
State:
18.9% of AGI
(% of AGI for various income ranges: 7.6% for AGIs $10k-25k, 5.5% for AGIs $25k-50k, 4.8% for AGIs $50k-75k, 7.0% for AGIs $75k-100k, 7.8% for AGIs over 100k)
Charity contributions deductions: $5,434 (8% of AGI, reported on 11.0% of returns)
Here:
$5,434
State:
$4,753
Here:
7.5% of AGI
State:
4.2% of AGI
(% of AGI for various income ranges: 0.9% for AGIs $10k-25k, 1.3% for AGIs $25k-50k, 1.3% for AGIs $50k-75k, 2.2% for AGIs $75k-100k, 3.0% for AGIs over 100k)
Total tax: $4,500 (reported on 71.3% of returns)
76802:
$4,500
State:
$9,058
(% of AGI for various income ranges: 6.8% for AGIs below $10k, 3.7% for AGIs $10k-25k, 5.8% for AGIs $25k-50k, 8.4% for AGIs $50k-75k, 10.3% for AGIs $75k-100k, 17.1% for AGIs over 100k)
Earned income credit: $1,952 (reported on 19.5% of returns)
Here:
$1,952
State:
$2,024
Percentage of individuals using paid preparers for their 2004 taxes: 57.8%
Here:
58%
State:
57%
(% for various income ranges: 56.3% for AGIs below $10k, 56.9% for AGIs $10k-25k, 58.4% for AGIs $25k-50k, 58.2% for AGIs $50k-75k, 51.9% for AGIs $75k-100k, 77.6% for AGIs over 100k)
Likely homosexual households (counted as self-reported same-sex unmarried-partner households)
Lesbian couples: 0.2% of all households
Gay men: 0.0% of all households
Household received Food Stamps/SNAP in the past 12 months: 178 Household did not receive Food Stamps/SNAP in the past 12 months: 2,120
Women who had a birth in the past 12 months: 67 (68 now married, 0 unmarried) Women who did not have a birth in the past 12 months: 1,009 (605 now married, 399 unmarried)
Housing units in zip code 76802 with a mortgage: 843 (7 second mortgage, 5 both second mortgage and home equity loan) Median monthly owner costs for units with a mortgage: $1,627 Median monthly owner costs for units without a mortgage: $572
Residents with income below the poverty level in 2022:
This zip code:
7.7%
Whole state:
14.0%
Residents with income below 50% of the poverty level in 2022:
This zip code:
3.2%
Whole state:
7.4%
Median number of rooms in houses and condos:
Here:
6.2
State:
6.3
Median number of rooms in apartments:
Here:
4.1
State:
4.0
Notable locations in this zip code not listed on our city pages
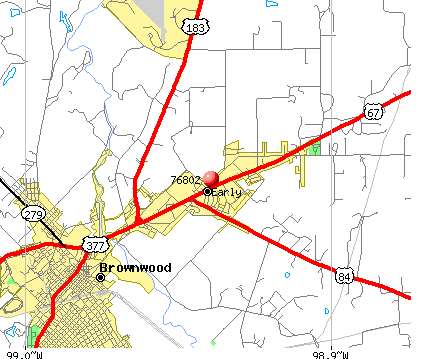
Notable locations in zip code 76802: Pioneer Memorial Library (A), Early Volunteer Fire Department (B), Guardian Emergency Medical Services (C). Display/hide their locations on the map
Cemeteries: Staley Cemetery (1), Eastlawn Cemetery (2), Jenkins Cemetery (3), Connell Cemetery (4), Beairds Cemetery (5), Jones Chapel Cemetery (6). Display/hide their locations on the map
Reservoirs: Brownwood Lateral Watershed Number 21 (A), Brownwood Lateral Watershed Number 20 (B), Soil Conservation Service Site 21 Reservoir (C), Soil Conservation Service Site 7 Reservoir (D), Soil Conservation Service Site 20 Reservoir (E), Soil Conservation Service Site 19 Reservoir (F), Soil Conservation Service Site 17 Reservoir (G). Display/hide their locations on the map
Streams, rivers, and creeks: Steppes Creek (A), Salt Creek (B), Red Hole Creek (C), Delaware Creek (D), Berry Branch (E). Display/hide their locations on the map
Parks in zip code 76802 include: Longhron Stadium (1), McDonald Field (2), Early City Park (3), Brownwood City Park (4). Display/hide their locations on the map
In group quarters: 141 (-1 institutionalized population)
Size of family households: 757 2-persons, 356 3-persons, 163 4-persons, 143 5-persons, 53 6-persons, 84 7-or-more-persons
Size of nonfamily households: 651 1-person, 84 2-persons, 13 5-persons
880 married couples with children.
443 single-parent households (164 men, 279 women).
85.4% of residents of 76802 zip code speak English at home.
12.5% of residents speak Spanish at home (73% very well, 17% well, 1% not well, 9% not at all).
1.0% of residents speak other Indo-European language at home (21% very well, 79% well).
1.4% of residents speak Asian or Pacific Island language at home (82% well, 18% not well).
0.2% of residents speak other language at home (100% very well).
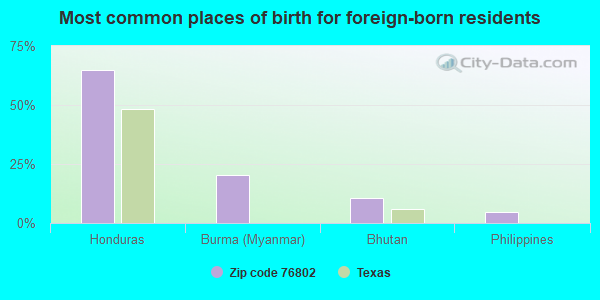
Foreign born population: 223 (3.8%) (76.9% of them are naturalized citizens)
This zip code:
3.8%
Whole state:
17.2%
65%Honduras
20%Burma (Myanmar)
11%Bhutan
5%Philippines
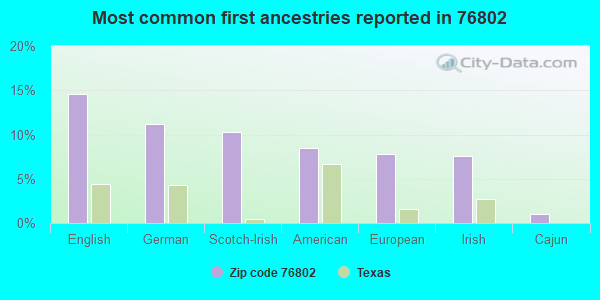
15%English
11%German
10%Scotch-Irish
8%American
8%European
8%Irish
1%Cajun
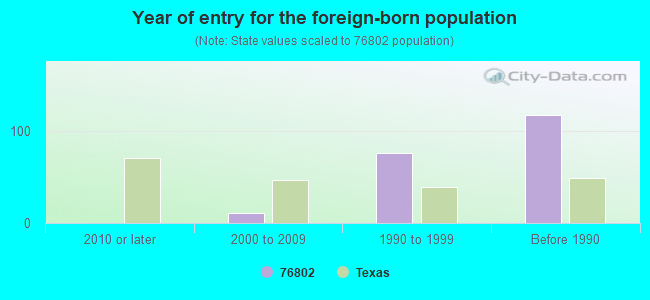
Year of entry for the foreign-born population
02010 or later
112000 to 2009
771990 to 1999
118Before 1990
Housing units lacking complete plumbing facilities: 5.7% Housing units lacking complete kitchen facilities: 3.4%
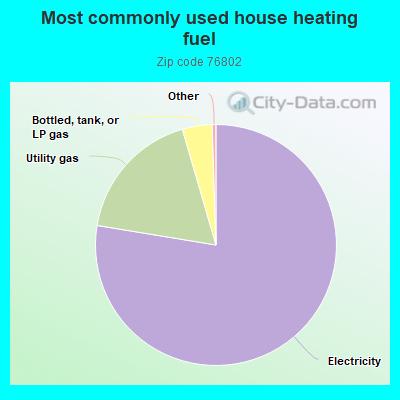
77.6%Electricity
17.9%Utility gas
4.0%Bottled, tank, or LP gas
Place of birth for U.S.-born residents:
This state: 4,230
Northeast: 52
Midwest: 294
South: 389
West: 616
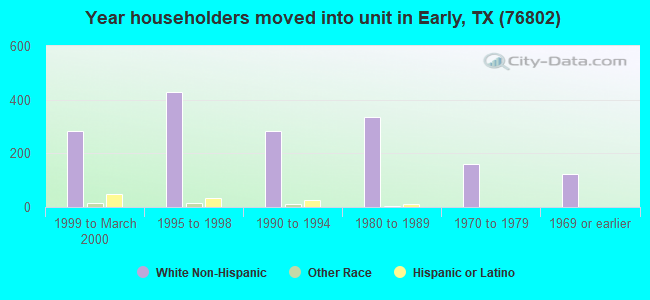
50% of the 76802 zip code residents lived in the same house 5 years ago. Out of people who lived in different houses, 64% lived in this county. Out of people who lived in different counties, 50% lived in Texas.
88% of the 76802 zip code residents lived in the same house 1 year ago. Out of people who lived in different houses, 21% moved from this county. Out of people who lived in different houses, 80% moved from different county within same state.
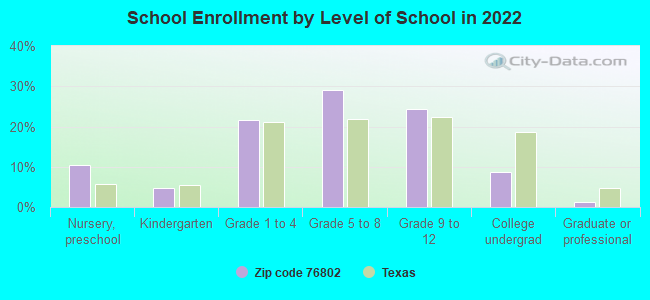
Private vs. public school enrollment:
Students in private schools in grades 1 to 8 (elementary and middle school): 27
Here:
3.7%
Texas:
8.8%
Students in private schools in grades 9 to 12 (high school): 17
Here:
4.7%
Texas:
8.0%
Students in private undergraduate colleges: 5
Here:
4.5%
Texas:
16.2%
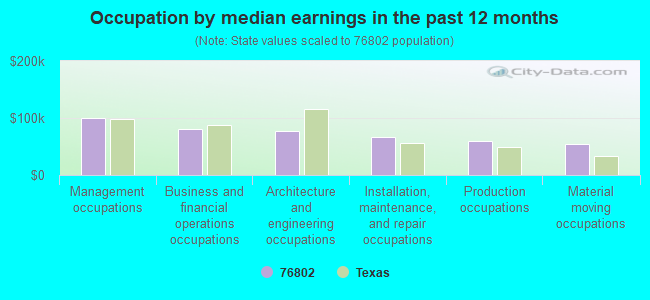
Occupation by median earnings in the past 12 months ($)
100,358Management occupations
81,057Business and financial operations occupations
77,458Architecture and engineering occupations
67,193Installation, maintenance, and repair occupations
59,268Production occupations
55,075Material moving occupations
Companies with federal contracts located in this zip code:
JOHN J FRANKLIN (4425 FM 2525 in BROWNWOOD, TX; small business) : $21,844 in 2 contractsin 2004
$10,922 with Army for Recreation Site Maintenance Services (non-construction). Signed on 2004-10-01. Completion date: 2005-08-31.
$10,922 with U.S. Army Corps of Engineers - civil program financing only for Recreation Site Maintenance Services (non-construction). Signed on 2004-10-01. Completion date: 2005-08-31.
Top industries in this zip code by the number of employees in 2005:
Health Care and Social Assistance: Other Residential Care Facilities (20-49: 1)
Other Services (except Public Administration): Religious Organizations (10-19: 1, 5-9: 2)
Real Estate and Rental and Leasing: Lessors of Residential Buildings and Dwellings (10-19: 1, 5-9: 1, 1-4: 2)
Finance and Insurance: Commercial Banking (10-19: 1, 5-9: 1)
People in group quarters in 2010:
86 people in nursing facilities/skilled-nursing facilities
26 people in group homes intended for adults
People in group quarters in 2000:
115 people in nursing homes
4 people in homes for the mentally retarded
Fatal accident statistics in 2013:
Fatal accident count: 1
Vehicles involved in fatal accidents: 1
Fatal accidents caused by drunken drivers: 0
Fatalities: 1
Persons involved in fatal accidents: 1
Pedestrians involved in fatal accidents: 0
Fatal accident statistics in 2011:
Fatal accident count: 2
Vehicles involved in fatal accidents: 3
Fatal accidents caused by drunken drivers: 0
Fatalities: 2
Persons involved in fatal accidents: 4
Pedestrians involved in fatal accidents: 1
2002 - 2018 National Fire Incident Reporting System (NFIRS) incidents
Based on the data from the years 2002 - 2018 the average number of fire incidents per year is 15. The highest number of fires - 54 took place in 2008, and the least - 0 in 2005. The data has a rising trend.
When looking into fire subcategories, the most reports belonged to: Outside Fires (59.5%), and Structure Fires (30.0%).
Fire incident types reported to NFIRS in Zip Code 76802
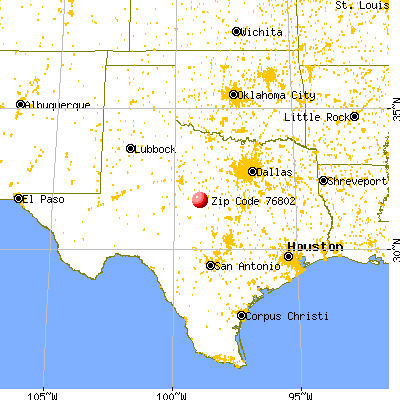


 Nearest zip codes: 76801, 76432, 76890, 76857, 76823, 76474.


 : $21,844 in 2 contracts in 2004
 Based on the data from the years 2002 - 2018 the average number of fire incidents per year is 15. The highest number of fires - 54 took place in 2008, and the least - 0 in 2005. The data has a rising trend.
 When looking into fire subcategories, the most reports belonged to: Outside Fires (59.5%), and Structure Fires (30.0%).