Estimated zip code population in 2022: 32,259 Zip code population in 2010: 27,969 Zip code population in 2000: 25,738
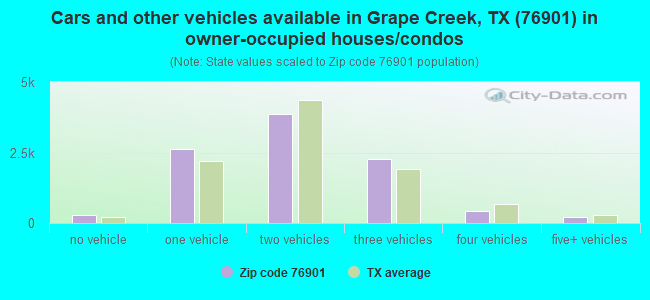
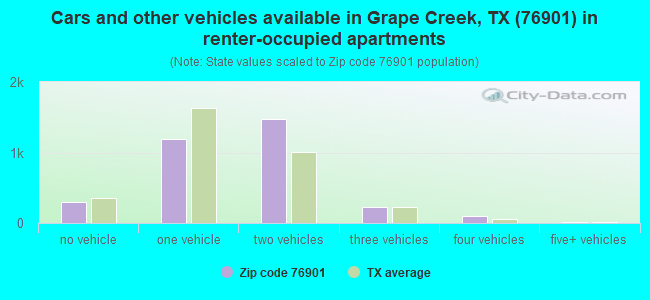
Houses and condos: 14,189 Renter-occupied apartments: 3,321
% of renters here:
26%
State:
38%
March 2022 cost of living index in zip code 76901: 83.8 (less than average, U.S. average is 100)
Land area: 276.1 sq. mi. Water area: 6.6 sq. mi.
Population density: 117 people per square mile
(very low).
OSM Map
General Map
Google Map
MSN Map
OSM Map
General Map
Google Map
MSN Map
OSM Map
General Map
Google Map
MSN Map
OSM Map
General Map
Google Map
MSN Map
Please wait while loading the map...
Real estate property taxes paid for housing units in 2022:
This zip code:
1.3% ($2,382)
Texas:
1.5% ($4,050)
Median real estate property taxes paid for housing units with mortgages in 2022: $2,822 (1.5%) Median real estate property taxes paid for housing units with no mortgage in 2022: $2,043 (1.1%)
Averages for the 2020 tax year for zip code 76901, filed in 2021:
Average Adjusted Gross Income (AGI) in 2020: $58,789 (Individual Income Tax Returns)
Here:
$58,789
State:
$77,054
Salary/wage: $47,995 (reported on 84.6% of returns)
Here:
$47,995
State:
$62,766
(% of AGI for various income ranges: 1215.9% for AGIs below $25k, 3539.9% for AGIs $25k-50k, 6082.9% for AGIs $50k-75k, 9025.7% for AGIs $75k-100k, 16724.9% for AGIs $100k-200k, 79268.9% for AGIs over 200k)
Taxable interest for individuals: $2,006 (reported on 19.9% of returns)
This zip code:
$2,006
Texas:
$2,665
(% of AGI for various income ranges: 10.2% for AGIs below $25k, 11.3% for AGIs $25k-50k, 24.8% for AGIs $50k-75k, 44.3% for AGIs $75k-100k, 141.0% for AGIs $100k-200k, 3080.0% for AGIs over 200k)
Ordinary dividends: $8,208 (reported on 12.1% of returns)
Here:
$8,208
State:
$10,044
(% of AGI for various income ranges: 15.0% for AGIs below $25k, 21.9% for AGIs $25k-50k, 62.5% for AGIs $50k-75k, 125.6% for AGIs $75k-100k, 310.9% for AGIs $100k-200k, 8581.1% for AGIs over 200k)
Net capital gain/loss in AGI: +$18,862 (reported on 11.6% of returns)
Here:
+$18,862
State:
+$39,590
(% of AGI for various income ranges: 6.7% for AGIs below $25k, 21.8% for AGIs $25k-50k, 46.7% for AGIs $50k-75k, 135.2% for AGIs $75k-100k, 434.2% for AGIs $100k-200k, 26403.3% for AGIs over 200k)
Profit/loss from business: +$11,435 (reported on 15.5% of returns)
Here:
+$11,435
State:
+$10,888
(% of AGI for various income ranges: 101.6% for AGIs below $25k, 84.7% for AGIs $25k-50k, 142.3% for AGIs $50k-75k, 298.2% for AGIs $75k-100k, 724.3% for AGIs $100k-200k, 7454.4% for AGIs over 200k)
Taxable individual retirement arrangement distribution: $18,310 (reported on 7.1% of returns)
76901:
$18,310
Texas:
$24,740
(% of AGI for various income ranges: 36.6% for AGIs below $25k, 60.0% for AGIs $25k-50k, 157.7% for AGIs $50k-75k, 318.2% for AGIs $75k-100k, 651.7% for AGIs $100k-200k, 4001.1% for AGIs over 200k)
Self-employed (Keogh) retirement plans: $26,400 (reported on 0.1% of returns)
76901:
$26,400
Texas:
$29,298
(% of AGI for various income ranges: 13.7% for AGIs below $25k)
Total itemized deductions: $39,053 (reported on 3.5% of returns)
Here:
$39,053
State:
$40,428
(% of AGI for various income ranges: 22.3% for AGIs below $25k, 47.1% for AGIs $25k-50k, 95.1% for AGIs $50k-75k, 218.6% for AGIs $75k-100k, 577.0% for AGIs $100k-200k, 8947.8% for AGIs over 200k)
Charity contributions: $20,973 (reported on 2.6% of returns)
Here:
$20,973
State:
$18,201
(% of AGI for various income ranges: 10.0% for AGIs $25k-50k, 22.6% for AGIs $50k-75k, 44.5% for AGIs $75k-100k, 199.4% for AGIs $100k-200k, 5451.1% for AGIs over 200k)
Taxes paid: $6,106 (reported on 3.4% of returns)
76901:
$6,106
State:
$7,821
(% of AGI for various income ranges: 2.5% for AGIs below $25k, 8.1% for AGIs $25k-50k, 15.7% for AGIs $50k-75k, 38.8% for AGIs $75k-100k, 92.6% for AGIs $100k-200k, 1188.9% for AGIs over 200k)
Earned income credit: $2,464 (reported on 20.4% of returns)
Here:
$2,464
State:
$2,584
(% of AGI for various income ranges: 116.0% for AGIs below $25k, 75.6% for AGIs $25k-50k, 1.9% for AGIs $50k-75k)
Percentage of individuals using paid preparers for their 2020 taxes: 94.8%
Here:
95%
State:
92%
(% for various income ranges: 94.4% for AGIs below $25k, 95.5% for AGIs $25k-50k, 95.3% for AGIs $50k-75k, 94.7% for AGIs $75k-100k, 94.6% for AGIs $100k-200k, 91.2% for AGIs over 200k)
Averages for the 2012 tax year for zip code 76901, filed in 2013:
Average Adjusted Gross Income (AGI) in 2012: $49,979 (Individual Income Tax Returns)
Here:
$49,979
State:
$65,384
Salary/wage: $39,796 (reported on 85.9% of returns)
Here:
$39,796
State:
$52,524
(% of AGI for various income ranges: 82.5% for AGIs below $25k, 82.7% for AGIs $25k-50k, 77.7% for AGIs $50k-75k, 76.3% for AGIs $75k-100k, 71.8% for AGIs $100k-200k, 33.6% for AGIs over 200k)
Taxable interest for individuals: $1,876 (reported on 21.1% of returns)
This zip code:
$1,876
Texas:
$2,372
(% of AGI for various income ranges: 0.8% for AGIs below $25k, 0.5% for AGIs $25k-50k, 0.5% for AGIs $50k-75k, 0.5% for AGIs $75k-100k, 0.9% for AGIs $100k-200k, 1.4% for AGIs over 200k)
Ordinary dividends: $6,709 (reported on 12.2% of returns)
Here:
$6,709
State:
$9,721
(% of AGI for various income ranges: 0.9% for AGIs below $25k, 1.0% for AGIs $25k-50k, 1.2% for AGIs $50k-75k, 1.2% for AGIs $75k-100k, 1.3% for AGIs $100k-200k, 3.5% for AGIs over 200k)
Net capital gain/loss in AGI: +$14,216 (reported on 10.1% of returns)
Here:
+$14,216
State:
+$35,319
(% of AGI for various income ranges: 0.2% for AGIs $25k-50k, 0.2% for AGIs $50k-75k, 0.6% for AGIs $75k-100k, 1.2% for AGIs $100k-200k, 11.7% for AGIs over 200k)
Profit/loss from business: +$13,578 (reported on 14.5% of returns)
Here:
+$13,578
State:
+$13,732
(% of AGI for various income ranges: 5.6% for AGIs below $25k, 2.5% for AGIs $25k-50k, 2.7% for AGIs $50k-75k, 3.5% for AGIs $75k-100k, 4.7% for AGIs $100k-200k, 4.9% for AGIs over 200k)
Taxable individual retirement arrangement distribution: $15,363 (reported on 8.4% of returns)
76901:
$15,363
Texas:
$19,511
(% of AGI for various income ranges: 1.9% for AGIs below $25k, 2.0% for AGIs $25k-50k, 2.7% for AGIs $50k-75k, 2.7% for AGIs $75k-100k, 4.0% for AGIs $100k-200k, 2.1% for AGIs over 200k)
Self-employment retirement plans: $16,400 (reported on 0.3% of returns)
76901:
$16,400
Texas:
$23,938
Total itemized deductions: $20,804 (16% of AGI, reported on 14.3% of returns)
Here:
$20,804
State:
$24,724
Here:
15.7% of AGI
State:
15.9% of AGI
(% of AGI for various income ranges: 3.7% for AGIs below $25k, 4.9% for AGIs $25k-50k, 5.7% for AGIs $50k-75k, 6.3% for AGIs $75k-100k, 7.9% for AGIs $100k-200k, 6.3% for AGIs over 200k)
Charity contributions: $6,712 (reported on 10.5% of returns)
Here:
$6,712
State:
$6,808
(% of AGI for various income ranges: 0.3% for AGIs below $25k, 0.7% for AGIs $25k-50k, 1.0% for AGIs $50k-75k, 1.3% for AGIs $75k-100k, 1.7% for AGIs $100k-200k, 2.7% for AGIs over 200k)
Taxes paid: $4,980 (reported on 13.9% of returns)
76901:
$4,980
State:
$6,921
(% of AGI for various income ranges: 0.7% for AGIs below $25k, 0.9% for AGIs $25k-50k, 1.3% for AGIs $50k-75k, 1.5% for AGIs $75k-100k, 2.1% for AGIs $100k-200k, 1.5% for AGIs over 200k)
Earned income credit: $2,302 (reported on 23.5% of returns)
Here:
$2,302
State:
$2,570
(% of AGI for various income ranges: 7.0% for AGIs below $25k, 1.5% for AGIs $25k-50k)
Percentage of individuals using paid preparers for their 2012 taxes: 51.7%
Here:
52%
State:
51%
(% for various income ranges: 47.3% for AGIs below $25k, 49.4% for AGIs $25k-50k, 53.9% for AGIs $50k-75k, 61.0% for AGIs $75k-100k, 62.8% for AGIs $100k-200k, 88.0% for AGIs over 200k)
Averages for the 2004 tax year for zip code 76901, filed in 2005:
Average Adjusted Gross Income (AGI) in 2004: $35,471 (Individual Income Tax Returns)
Here:
$35,471
State:
$47,881
Salary/wage: $31,083 (reported on 84.3% of returns)
Here:
$31,083
State:
$41,947
(% of AGI for various income ranges: 113.3% for AGIs below $10k, 81.1% for AGIs $10k-25k, 80.7% for AGIs $25k-50k, 77.4% for AGIs $50k-75k, 75.2% for AGIs $75k-100k, 55.1% for AGIs over 100k)
Taxable interest for individuals: $2,171 (reported on 30.0% of returns)
This zip code:
$2,171
Texas:
$2,255
(% of AGI for various income ranges: 5.2% for AGIs below $10k, 1.6% for AGIs $10k-25k, 1.3% for AGIs $25k-50k, 1.5% for AGIs $50k-75k, 1.9% for AGIs $75k-100k, 2.5% for AGIs over 100k)
Taxable dividends: $3,528 (reported on 16.4% of returns)
Here:
$3,528
State:
$4,261
(% of AGI for various income ranges: 2.7% for AGIs below $10k, 0.9% for AGIs $10k-25k, 0.9% for AGIs $25k-50k, 1.0% for AGIs $50k-75k, 1.3% for AGIs $75k-100k, 3.4% for AGIs over 100k)
Net capital gain/loss: +$7,345 (reported on 13.7% of returns)
Here:
+$7,345
State:
+$16,110
(% of AGI for various income ranges: -0.4% for AGIs below $10k, 0.0% for AGIs $10k-25k, 0.7% for AGIs $25k-50k, 0.7% for AGIs $50k-75k, 1.0% for AGIs $75k-100k, 9.6% for AGIs over 100k)
Profit/loss from business: +$10,068 (reported on 16.7% of returns)
Here:
+$10,068
State:
+$11,013
(% of AGI for various income ranges: 5.5% for AGIs below $10k, 5.3% for AGIs $10k-25k, 2.9% for AGIs $25k-50k, 3.3% for AGIs $50k-75k, 4.8% for AGIs $75k-100k, 7.4% for AGIs over 100k)
IRA payment deduction: $3,035 (reported on 2.0% of returns)
76901:
$3,035
Texas:
$3,120
(% of AGI for various income ranges: 0.1% for AGIs $10k-25k, 0.2% for AGIs $25k-50k, 0.2% for AGIs $50k-75k, 0.2% for AGIs $75k-100k, 0.2% for AGIs over 100k)
Self-employed pension: $14,333 (reported on 0.4% of returns)
Here:
$14,333
Texas:
$16,401
Total itemized deductions: $18,075 (23% of AGI, reported on 13.6% of returns)
Here:
$18,075
State:
$19,631
Here:
22.6% of AGI
State:
18.9% of AGI
(% of AGI for various income ranges: 6.3% for AGIs below $10k, 3.5% for AGIs $10k-25k, 5.4% for AGIs $25k-50k, 10.5% for AGIs $50k-75k, 7.2% for AGIs $75k-100k, 7.7% for AGIs over 100k)
Charity contributions deductions: $4,796 (6% of AGI, reported on 11.1% of returns)
Here:
$4,796
State:
$4,753
Here:
5.5% of AGI
State:
4.2% of AGI
(% of AGI for various income ranges: 0.3% for AGIs below $10k, 0.6% for AGIs $10k-25k, 0.9% for AGIs $25k-50k, 1.4% for AGIs $50k-75k, 1.7% for AGIs $75k-100k, 2.7% for AGIs over 100k)
Total tax: $5,370 (reported on 69.4% of returns)
76901:
$5,370
State:
$9,058
(% of AGI for various income ranges: 3.1% for AGIs below $10k, 3.7% for AGIs $10k-25k, 6.4% for AGIs $25k-50k, 8.9% for AGIs $50k-75k, 11.5% for AGIs $75k-100k, 20.4% for AGIs over 100k)
Earned income credit: $1,923 (reported on 24.6% of returns)
Here:
$1,923
State:
$2,024
Percentage of individuals using paid preparers for their 2004 taxes: 62.6%
Here:
63%
State:
57%
(% for various income ranges: 57.2% for AGIs below $10k, 65.2% for AGIs $10k-25k, 63.0% for AGIs $25k-50k, 61.7% for AGIs $50k-75k, 59.0% for AGIs $75k-100k, 75.1% for AGIs over 100k)
Likely homosexual households (counted as self-reported same-sex unmarried-partner households)
Lesbian couples: 0.1% of all households
Gay men: 0.0% of all households
Household received Food Stamps/SNAP in the past 12 months: 1,491 Household did not receive Food Stamps/SNAP in the past 12 months: 11,478
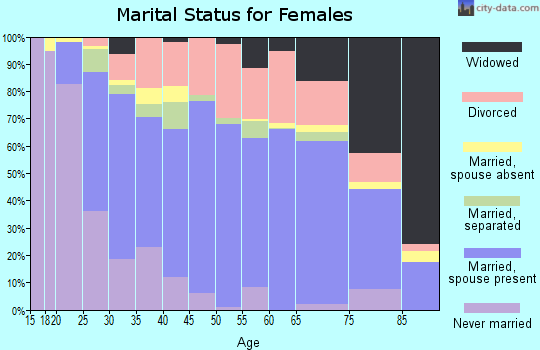
Women who had a birth in the past 12 months: 201 (124 now married, 76 unmarried) Women who did not have a birth in the past 12 months: 7,633 (3,131 now married, 4,509 unmarried)
Housing units in zip code 76901 with a mortgage: 4,489 (138 second mortgage, 137 both second mortgage and home equity loan) Houses without a mortgage: 104
Median monthly owner costs for units with a mortgage: $1,307 Median monthly owner costs for units without a mortgage: $533
Residents with income below the poverty level in 2022:
This zip code:
14.4%
Whole state:
14.0%
Residents with income below 50% of the poverty level in 2022:
This zip code:
8.9%
Whole state:
7.4%
Median number of rooms in houses and condos:
Here:
5.7
State:
6.3
Median number of rooms in apartments:
Here:
4.3
State:
4.0
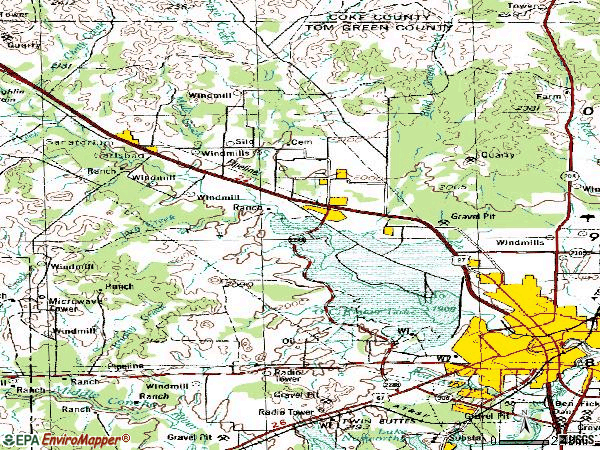
Notable locations in this zip code not listed on our city pages
Notable locations in zip code 76901: Field Ranch (A), Kelly Ranch (B), Tullos Ranch (C), Wardlaw Ranch (D), Angelo Heights Historic District (E), Brown Ranch (F), Mason-Hughes House (G), Texas Forest Service San Angelo Office (H), Grape Creek Volunteer Fire Department (I), San Angelo Fire Department Station 5 (J), San Angelo Emergency Corps (K), Collyns House (L), C C Walsh House (M), R Wilbur Brown House (N), S L Henderson House (O). Display/hide their locations on the map
Churches in zip code 76901 include: Church of Christ Johnson Avenue (A), River City Baptist Church (B), Northridge Baptist Church (C), Grace Temple Baptist Church (D), Central Faith Baptist Church (E), Beacon Baptist Church (F), Templo Betel Assembly of God Church (G), Assembly of God Evangelical Temple Church (H), Community Christian Church (I). Display/hide their locations on the map
Cemeteries: Midway Cemetery (1), Arden Cemetery (2), Grape Creek Cemetery (3), Belvedere Memorial Cemetery (4), Delta Memorial Cemetery (5). Display/hide their locations on the map
Creeks: West Fork Chalk Creek (A), Bald Eagle Creek (B), East Fork Chalk Creek (C), Mule Creek (D), Grape Creek (E), Pot Creek (F), East Rocky Creek (G), Dry Rocky Creek (H), Brushy Creek (I). Display/hide their locations on the map
Parks in zip code 76901 include: Kiwanis Park (1), Santa Rita Park (2), San Angelo State Park - North Shore (3), San Angelo State Park - South Shore (4), Sulphur Springs Park (5), Delta Memorial Park (6), Brentwood Park (7), Belvedere Memorial Park (8). Display/hide their locations on the map
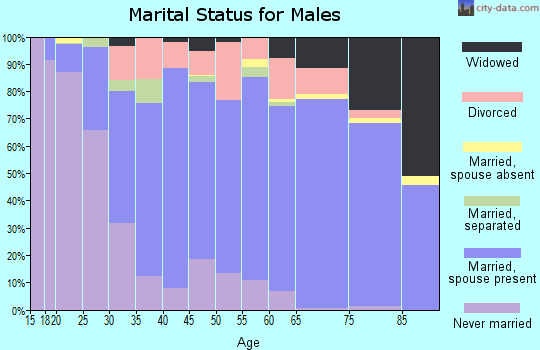
4,749 married couples with children.
1,719 single-parent households (536 men, 1,183 women).
77.2% of residents of 76901 zip code speak English at home.
21.5% of residents speak Spanish at home (78% very well, 15% well, 4% not well, 3% not at all).
1.1% of residents speak other Indo-European language at home (97% very well, 3% not well).
0.2% of residents speak Asian or Pacific Island language at home (100% very well).
0.2% of residents speak other language at home (30% very well, 70% well).
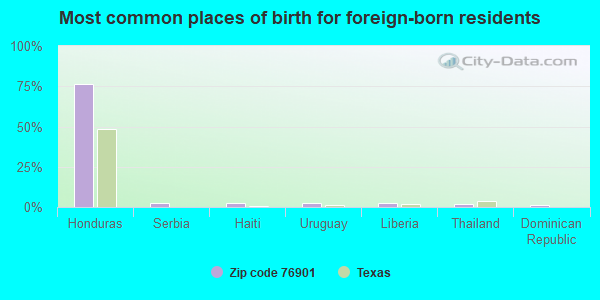
Foreign born population: 1,667 (5.2%) (49.8% of them are naturalized citizens)
Facilities with environmental interests located in this zip code:
APLEX AUTO SALVAGE & WRECKING (2757 FM 2105 in SAN ANGELO, TX)
(Integrated Compliance Information System) - ICIS-06-1998-0673, FORMAL ENFORCEMENT ACTION National Pollutant Discharge Elimination System NON-MAJOR (Tracking pollutant discharge elimination systems) - permit Business SIC classification: MOTOR VEHICLE PARTS, USED
AUSTIN EL (700 N VAN BUREN ST in SAN ANGELO, TX)
(National Center for Education Statistics) - STATE ID-226903102 Organizations: SAN ANGELO ISD (SCHOOL DISTRICT)
A BETTER BUY AUTO PARTS (2539 W FM 2105 in SAN ANGELO, TX)
(Integrated Compliance Information System) - ICIS-06-1998-0675, FORMAL ENFORCEMENT ACTION Business SIC classification: MOTOR VEHICLE PARTS, USED; AUTO AND HOME SUPPLY STORES
BARRY OF SAN ANGELO (3301 BARRY AVE in SAN ANGELO, TX)
(Resource Conservation and Recovery Act (tracking hazardous waste)) Business NAICS classification: HOUSE SLIPPER MANUFACTURING.
Housing units lacking complete plumbing facilities: 2.8% Housing units lacking complete kitchen facilities: 3.6%
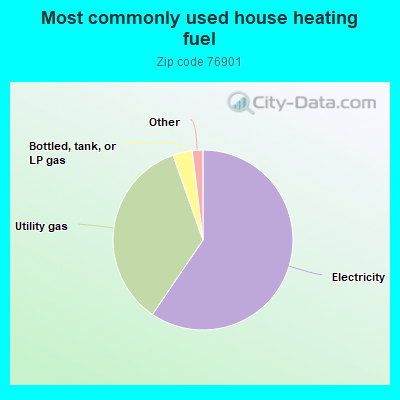
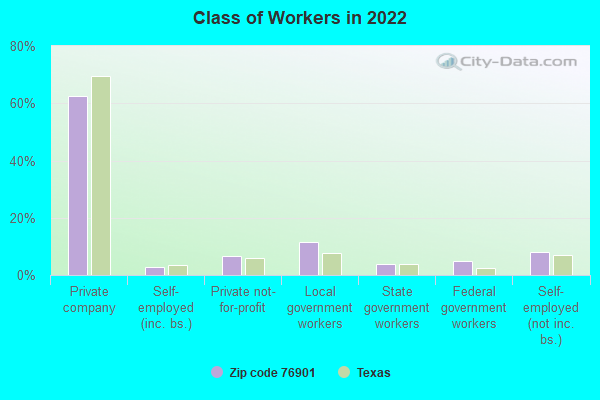
59.5%Electricity
35.1%Utility gas
3.5%Bottled, tank, or LP gas
0.7%Other fuel
0.6%No fuel used
Population in 1990: 23,800. Population change in the 1990s: +1,938 (+8.1%).
Place of birth for U.S.-born residents:
This state: 22,900
Northeast: 969
Midwest: 1,482
South: 2,202
West: 2,741
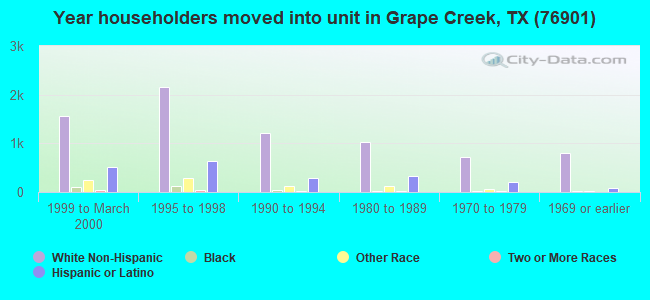
52% of the 76901 zip code residents lived in the same house 5 years ago. Out of people who lived in different houses, 63% lived in this county. Out of people who lived in different counties, 50% lived in Texas.
90% of the 76901 zip code residents lived in the same house 1 year ago. Out of people who lived in different houses, 58% moved from this county. Out of people who lived in different houses, 27% moved from different county within same state. Out of people who lived in different houses, 11% moved from different state. Out of people who lived in different houses, 4% moved from abroad.
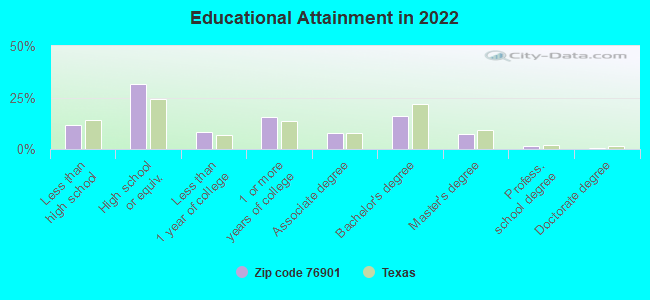
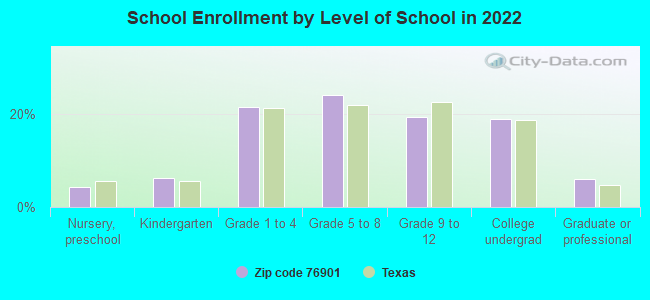
Private vs. public school enrollment:
Students in private schools in grades 1 to 8 (elementary and middle school): 410
Here:
11.0%
Texas:
8.8%
Students in private schools in grades 9 to 12 (high school): 284
Here:
17.9%
Texas:
8.0%
Students in private undergraduate colleges: 194
Here:
12.7%
Texas:
16.2%
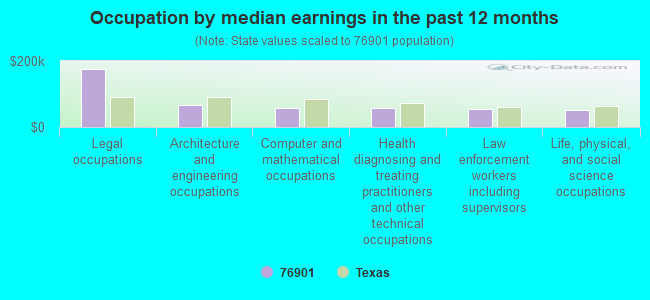
Occupation by median earnings in the past 12 months ($)
176,537Legal occupations
65,771Architecture and engineering occupations
57,927Computer and mathematical occupations
57,816Health diagnosing and treating practitioners and other technical occupations
53,084Law enforcement workers including supervisors
51,608Life, physical, and social science occupations
Companies with biggest federal contracts located in this zip code (SAN ANGELO, TX):
CONCHO VALLEY CENTER FOR HUMAN (1501 W BEAUREGARD AVE) : $13,007,588 in 22 contractsfrom 1999 to 2005
Contracts for Food Services, Other Housekeeping Services, Trash/Garbage Collection Services - Including Portable Sanitation Services, Maintenance, Repair and Rebuilding of Equipment -- Miscellaneous by Air Force, Defense Commissary Agency, Department of Defense Signed by year:2000: $2,832,470; 2001: $2,907,299; 2002: $3,116,835; 2003: $494,534; 2004: $314,201; 2005: $665,870; 2006: $0.
Biggest contracts:
$2,624,224 with Air Force for Food Services. Signed on 2002-10-01. Completion date: 2003-09-30.
$2,392,950, same as above.Signed on 2001-10-01. Completion date: 2002-09-30.
$2,345,118, same as above.Signed on 2000-10-01. Completion date: 2001-09-30.
$2,224,515, same as above.Signed on 1999-10-01. Completion date: 2000-09-30.
CONCHO RESOURCE CENTER (1317 COLORADO AVE) : $1,558,511 in 7 contractsfrom 1999 to 2005
Contracts for Mailing and Distribution Services by Air Force Signed by year:2000: $98,186; 2001: $196,833; 2002: $238,497; 2003: $262,140; 2004: $332,521; 2005: $338,555; 2006: $0.
Biggest contracts:
$338,555 with Air Force for Mailing and Distribution Services. Signed on 2005-10-01. Completion date: 2006-09-30.
$332,521, same as above.Signed on 2004-10-01. Completion date: 2005-09-30.
$262,140, same as above.Signed on 2003-10-01. Completion date: 2004-09-30.
$238,497, same as above.Signed on 2002-10-01. Completion date: 2003-09-30.
NELSON CONSTRUCTION, INC (1601 MACKENZIE ST; small business) : $1,294,761 in 5 contractsfrom 2000 to 2001
Contracts for Construction of Structures and Facilities -- Other Administrative Facilities and Service Buildings by Air Force Signed by year:2000: $1,301,000; 2001: -$6,239; 2002: $0; 2003: $0; 2004: $0; 2005: $0; 2006: $0.
Biggest contracts:
$1,301,000 with Air Force for Construction of Structures and Facilities -- Other Administrative Facilities and Service Buildings. Signed on 2000-09-29. Completion date: 2001-04-15.
$1,646, same as above.Signed on 2001-08-27. Completion date: 2001-04-15.
$1,313, same as above.Signed on 2001-03-14. Completion date: 2001-04-15.
$802, same as above.Signed on 2001-08-27. Completion date: 2001-04-15.
COX COMMUNICATIONS, INC (4272 W HOUSTON HARTE EXPR) : $504,963 in 12 contractsfrom 2000 to 2006
Contracts for Other Utilities, Telephone and/or Communications Services (includes Telegraph, Telex, and Cablevision Services), ADP Telecommunications and Transmission Services by Air Force Signed by year:2000: $91,926; 2001: $94,698; 2002: $94,698; 2003: $106,116; 2004: $95,074; 2005: $23,821; 2006: -$1,370.
Biggest contracts:
$106,116 with Air Force for Other Utilities. Signed on 2003-10-01. Completion date: 2004-09-30.
$95,074, same as above.Signed on 2004-10-01. Completion date: 2005-08-01.
$94,698 with Air Force for Telephone and/or Communications Services (includes Telegraph, Telex, and Cablevision Services). Signed on 2002-10-01. Completion date: 2003-09-30.
$94,698 with Air Force for Other Utilities. Signed on 2001-10-01. Completion date: 2002-09-30.
CONCHO BUSINESS SOLUTIONS, INC (2417 SHERWOOD WAY; small business) : $135,388 in 7 contractsfrom 2003 to 2005
Contracts for Office Furniture, Miscellaneous Vehicular Components, Miscellaneous Furniture and Fixtures by Air Force, Army Signed by year:2000: $0; 2001: $0; 2002: $0; 2003: $52,888; 2004: $0; 2005: $82,500; 2006: $0.
Biggest contracts:
$49,662 with Air Force for Office Furniture. Signed on 2005-03-29. Completion date: 2005-04-26.
$47,690, same as above.Signed on 2003-01-22. Completion date: 2003-02-28.
$21,100 with Air Force for Miscellaneous Vehicular Components. Signed on 2005-07-08. Completion date: 2005-08-07.
$7,312 with Air Force for Office Furniture. Signed on 2005-06-29. Completion date: 2005-07-20.
COX COMMUNICATIONS INC (4272 W HOUSTON HARTE EXPR) : $111,262 in 2 contractsfrom 2005 to 2006
$114,524 with Air Force for Telephone and/or Communications Services (includes Telegraph, Telex, and Cablevision Services). Signed on 2005-10-03. Completion date: 2006-09-30.
-$3,262, same as above.Signed on 2006-07-05. Completion date: 2006-09-30.
SHELTONS PAINT & BODY SHOP (2981 W FM 2105; small business)
$55,044 with Air Force for Maintenance, Repair and Rebuilding of Equipment -- Ground Effect Vehicles, Motor Vehicles, Trailers, and Cycles. Signed on 2002-09-30. Completion date: 2002-12-16.
DUNCAN MECHANICAL SERVICE, INC (1125 GLENNA ST; small business) : $29,228 in 7 contractsfrom 2004 to 2006
Contracts for Maintenance, Repair and Rebuilding of Equipment -- Refrigeration, Air Conditioning, and Air Circulating Equipment, Air Conditioning Equipment by Air Force, National Oceanic and Atmospheric Administration/Under Secretary for Oceans and Atmosphere Signed by year:2000: $0; 2001: $0; 2002: $0; 2003: $0; 2004: $4,241; 2005: $19,199; 2006: $5,788.
Biggest contracts:
$9,656 with Air Force for Maintenance, Repair and Rebuilding of Equipment -- Refrigeration, Air Conditioning, and Air Circulating Equipment. Signed on 2005-03-04. Completion date: 2005-04-03.
$6,115, same as above.Signed on 2005-01-06. Completion date: 2005-02-05.
$4,676, same as above.Signed on 2006-04-26. Completion date: 2006-05-15.
$4,241 with National Oceanic and Atmospheric Administration/Under Secretary for Oceans and Atmosphere for Air Conditioning Equipment. Signed on 2004-05-06. Completion date: 2004-06-06.
PRICE, VERONICA M (2405 STATON ST; small business) : $28,600 in 2 contractsfrom 2004 to 2005
$15,600 with Air Force for Other Administrative Support Services. Signed on 2005-10-01. Completion date: 2006-09-30.
$13,000 with Air Force for Other Professional Services. Signed on 2004-10-01. Completion date: 2005-09-30.
SAN ANGELO PRO PUMP, INC (5870 N GRAPE CREEK RD; small business) : $20,574 in 3 contractsfrom 2004 to 2005
$11,856 with Air Force for Custodial Janitorial Services. Signed on 2005-10-01. Completion date: 2006-09-30.
$11,856 with Air Force for Other Housekeeping Services. Signed on 2004-10-01. Completion date: 2005-09-30.
-$3,138, same as above.Signed on 2004-10-07. Completion date: 2004-09-30.
Top industries in this zip code by the number of employees in 2005:
2002 - 2018 National Fire Incident Reporting System (NFIRS) incidents
Based on the data from the years 2002 - 2018 the average number of fire incidents per year is 98. The highest number of fires - 177 took place in 2008, and the least - 42 in 2004. The data has a decreasing trend.
When looking into fire subcategories, the most reports belonged to: Outside Fires (50.2%), and Structure Fires (32.0%).
Fire incident types reported to NFIRS in Zip Code 76901
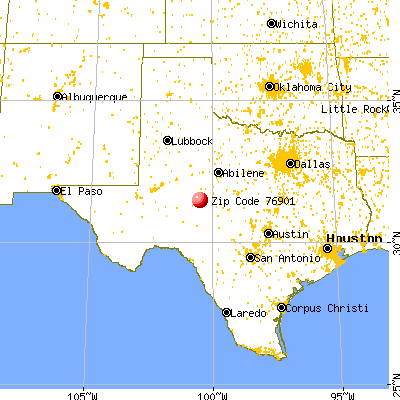


 Nearest zip codes: 76934, 76903, 76908, 76958, 76953, 76905.


 Based on the data from the years 2002 - 2018 the average number of fire incidents per year is 98. The highest number of fires - 177 took place in 2008, and the least - 42 in 2004. The data has a decreasing trend.
 When looking into fire subcategories, the most reports belonged to: Outside Fires (50.2%), and Structure Fires (32.0%).