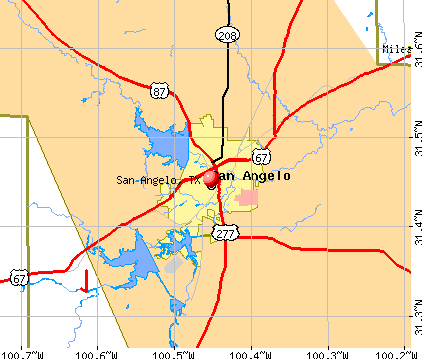
San Angelo, Texas
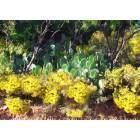
San Angelo: Cactus at San Angelo Park
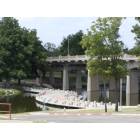
San Angelo: Celebration Bridge
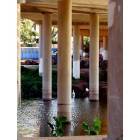
San Angelo: Under the bridge
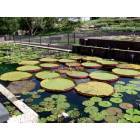
San Angelo: Lilly Pond
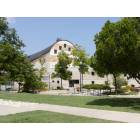
San Angelo: San Angelo Museum of Fine Arts
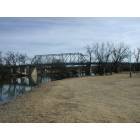
San Angelo: Bridge over Concho River
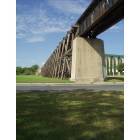
San Angelo: Railroad Trestle over the Concho River
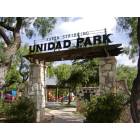
San Angelo: Unidad Park
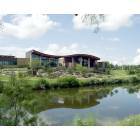
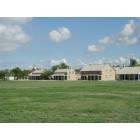
San Angelo: San Angelo Visitor's Center
San Angelo: Fort Concho National Historic Landmark

San Angelo: Pearl of the Concho Mermaid
- see
32
more - add
your
Submit your own pictures of this city and show them to the world
- OSM Map
- General Map
- Google Map
- MSN Map
Population change since 2000: +12.1%
 |
| Males: 49,297 | |
| Females: 49,815 |
| Median resident age: | 34.8 years |
| Texas median age: | 35.6 years |
Zip codes: 76903, 76904, 76905, 76908.
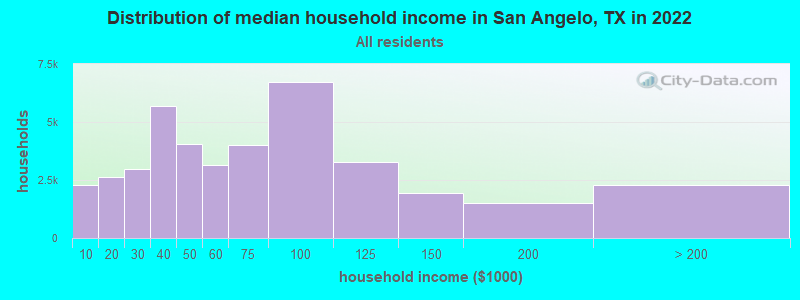
San Angelo Zip Code Map| San Angelo: | $57,625 |
| TX: | $72,284 |
Estimated per capita income in 2022: $32,413 (it was $17,289 in 2000)
San Angelo city income, earnings, and wages data
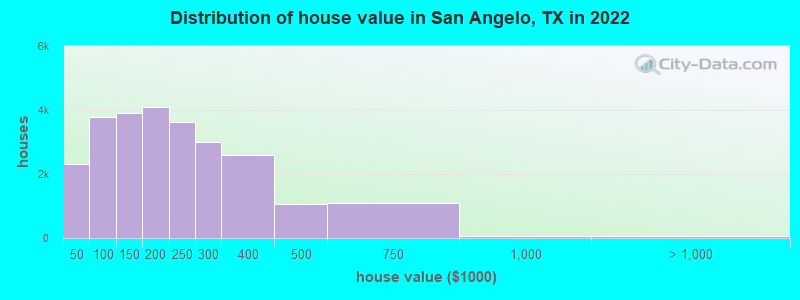
Estimated median house or condo value in 2022: $188,600 (it was $61,000 in 2000)
| San Angelo: | $188,600 |
| TX: | $275,400 |
Mean prices in 2022: all housing units: $223,902; detached houses: $228,294; townhouses or other attached units: $190,217; in 2-unit structures: $226,227; in 3-to-4-unit structures: $174,044; in 5-or-more-unit structures: $166,501; mobile homes: $65,388
Median gross rent in 2022: $1,123.
(9.8% for White Non-Hispanic residents, 21.2% for Black residents, 16.0% for Hispanic or Latino residents, 1.0% for American Indian residents, 9.1% for Native Hawaiian and other Pacific Islander residents, 17.8% for other race residents, 9.4% for two or more races residents)
Detailed information about poverty and poor residents in San Angelo, TX


Compare current foreclosures in San Angelo, TX:
| Photo | Address | Area | Beds / Baths | Price | Details |
|---|---|---|---|---|---|

|
#1
Nottingham Trl
San Angelo, TX 76901
|
1,268 sq. feet
|
3 baths 4 beds |
show details | |

|
#2
Forest Park Ave
San Angelo, TX 76901
|
1,350 sq. feet
|
2 baths 3 beds |
show details | |

|
#3
North St
San Angelo, TX 76901
|
1,408 sq. feet
|
2 baths 3 beds |
show details | |

|
#4
Woodland Cir
San Angelo, TX 76904
|
1,982 sq. feet
|
3 baths 3 beds |
show details | |

|
#5
S Madison St
San Angelo, TX 76901
|
2,129 sq. feet
|
2 baths 4 beds |
show details | |

|
#6
Elk Run
San Angelo, TX 76901
|
- sq. feet
|
2 baths 3 beds |
show details | |

|
#7
Alma Jo Dr
San Angelo, TX 76905
|
1,372 sq. feet
|
- baths - beds |
show details | |

|
#8
Coleman St
San Angelo, TX 76901
|
1,272 sq. feet
|
- baths - beds |
show details | |

|
#9
Daniel St
San Angelo, TX 76905
|
1,560 sq. feet
|
- baths - beds |
show details | |

|
#10
N Poe St
San Angelo, TX 76903
|
- sq. feet
|
- baths - beds |
show details |
| Photo | Address | Area | Beds / Baths | Price | Details |
|---|---|---|---|---|---|

|
#11
Leopard Ln
San Angelo, TX 76901
|
- sq. feet
|
- baths - beds |
show details | |

|
#12
Beaty Rd
San Angelo, TX 76904
|
1,540 sq. feet
|
- baths - beds |
show details | |

|
#13
Pulliam St
San Angelo, TX 76905
|
- sq. feet
|
- baths - beds |
show details | |

|
#14
Bobby Jones Road
San Angelo, TX 76904
|
- sq. feet
|
- baths - beds |
show details | |

|
#15
Kenwood Dr
San Angelo, TX 76903
|
1,860 sq. feet
|
- baths - beds |
show details | |

|
#16
S Monroe St
San Angelo, TX 76901
|
1,294 sq. feet
|
- baths - beds |
show details | |

|
#17
Kansas Ave
San Angelo, TX 76904
|
1,535 sq. feet
|
- baths - beds |
show details | |

|
#18
E 10th St
San Angelo, TX 76903
|
624 sq. feet
|
- baths - beds |
show details | |

|
#19
Westover Ter
San Angelo, TX 76904
|
1,625 sq. feet
|
- baths - beds |
show details | |

|
#20
E 9th St
San Angelo, TX 76903
|
840 sq. feet
|
- baths - beds |
show details |
| Photo | Address | Area | Beds / Baths | Price | Details |
|---|---|---|---|---|---|

|
#21
Pulliam St Apt 6
San Angelo, TX 76905
|
- sq. feet
|
- baths - beds |
show details | |

|
#22
Oriole Dr
San Angelo, TX 76903
|
1,774 sq. feet
|
- baths - beds |
show details | |

|
#23
N Fm 2288
San Angelo, TX 76901
|
- sq. feet
|
- baths - beds |
show details | |

|
#24
W Loop 306, Apt 10603
San Angelo, TX 76904
|
- sq. feet
|
- baths - beds |
show details | |

|
#25
W Avenue M
San Angelo, TX 76903
|
1,064 sq. feet
|
- baths - beds |
show details | |

|
#26
S Jackson St
San Angelo, TX 76901
|
1,472 sq. feet
|
- baths - beds |
show details | |

|
#27
W Avenue J
San Angelo, TX 76901
|
2,008 sq. feet
|
- baths - beds |
show details | |

|
#28
Briargrove Ln
San Angelo, TX 76904
|
2,365 sq. feet
|
- baths - beds |
show details | |

|
#29
W Avenue C
San Angelo, TX 76903
|
- sq. feet
|
- baths - beds |
show details | |

|
#30
E Parkway St
San Angelo, TX 76901
|
2,730 sq. feet
|
- baths - beds |
show details |
| Photo | Address | Area | Beds / Baths | Price | Details |
|---|---|---|---|---|---|

|
#31
Clare Dr
San Angelo, TX 76904
|
1,656 sq. feet
|
- baths - beds |
show details | |

|
#32
Grey Wolf Ln
San Angelo, TX 76901
|
- sq. feet
|
- baths - beds |
show details | |

|
#33
A And M Ave
San Angelo, TX 76904
|
- sq. feet
|
- baths - beds |
show details | |

|
#34
E 24th St
San Angelo, TX 76903
|
1,291 sq. feet
|
- baths - beds |
show details | |

|
#35
Coke St
San Angelo, TX 76903
|
1,008 sq. feet
|
- baths - beds |
show details | |

|
#36
Maple Ln
San Angelo, TX 76901
|
- sq. feet
|
- baths - beds |
show details | |

|
#37
Executive Dr
San Angelo, TX 76904
|
- sq. feet
|
- baths - beds |
show details | |

|
#38
Patrick St
San Angelo, TX 76904
|
2,739 sq. feet
|
- baths - beds |
show details | |

|
#39
Linda Lee Dr
San Angelo, TX 76905
|
1,158 sq. feet
|
- baths - beds |
show details | |

|
#40
Bryan St
San Angelo, TX 76903
|
1,310 sq. feet
|
- baths - beds |
show details |
| Photo | Address | Area | Beds / Baths | Price | Details |
|---|---|---|---|---|---|

|
#41
Reece Rd
San Angelo, TX 76904
|
- sq. feet
|
- baths - beds |
show details | |

|
#42
Club House Ln
San Angelo, TX 76904
|
- sq. feet
|
- baths - beds |
show details | |

|
#43
Wrangler Ln
San Angelo, TX 76904
|
1,738 sq. feet
|
- baths - beds |
show details | |

|
#44
Rice Ave
San Angelo, TX 76904
|
1,415 sq. feet
|
- baths - beds |
show details | |

|
#45
Hillcrest Dr
San Angelo, TX 76904
|
2,439 sq. feet
|
- baths - beds |
show details | |

|
#46
Scout St
San Angelo, TX 76903
|
- sq. feet
|
- baths - beds |
show details | |

|
#47
Lyndhurst Dr
San Angelo, TX 76901
|
1,826 sq. feet
|
- baths - beds |
show details | |

|
#48
Raney St
San Angelo, TX 76901
|
1,312 sq. feet
|
- baths - beds |
show details | |

|
#49
S Country Club Rd
San Angelo, TX 76904
|
2,749 sq. feet
|
- baths - beds |
show details | |

|
Check over 1 million property listings on Foreclosure.com!
|
browse all offers | |||


- 46,85046.9%White alone
- 44,24444.3%Hispanic
- 4,4824.5%Two or more races
- 2,0622.1%Black alone
- 9941.0%Other race alone
- 8820.9%Asian alone
- 2490.2%Native Hawaiian and Other
Pacific Islander alone - 1080.1%American Indian alone
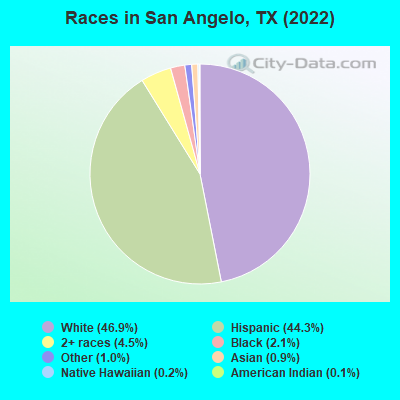
Races in San Angelo detailed stats: ancestries, foreign born residents, place of birth
According to our research of Texas and other state lists, there were 449 registered sex offenders living in San Angelo, Texas as of April 27, 2024.
The ratio of all residents to sex offenders in San Angelo is 231 to 1.
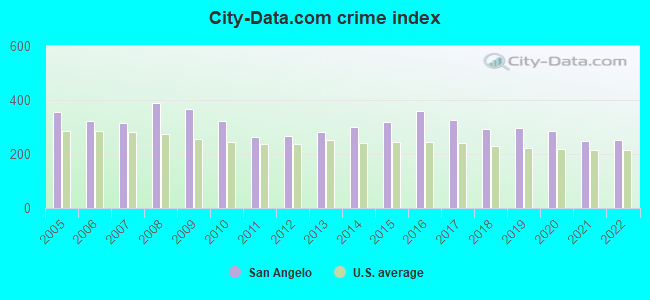
The City-Data.com crime index weighs serious crimes and violent crimes more heavily. Higher means more crime, U.S. average is 246.1. It adjusts for the number of visitors and daily workers commuting into cities.
- means the value is smaller than the state average.- means the value is about the same as the state average.
- means the value is bigger than the state average.
- means the value is much bigger than the state average.
Crime rate in San Angelo detailed stats: murders, rapes, robberies, assaults, burglaries, thefts, arson
Full-time law enforcement employees in 2021, including police officers: 204 (174 officers - 155 male; 19 female).
| Officers per 1,000 residents here: | 1.70 |
| Texas average: | 2.07 |
 Recent articles from our blog. Our writers, many of them Ph.D. graduates or candidates, create easy-to-read articles on a wide variety of topics.

 | Cedar Pollen in San Angelo? (5 replies) |
| Does anyone remember this steakhouse in San Angelo? (13 replies) |
| Who is Really Moving to Texas? (64 replies) |
| San Angelo, Texas,USA (14 replies) |
| Moving to San Angelo,Tx (6 replies) |
| Moving further out of DFW for more better COL (25 replies) |
Latest news from San Angelo, TX collected exclusively by city-data.com from local newspapers, TV, and radio stations
Ancestries: German (6.7%), American (6.6%), English (6.4%), Irish (5.2%), European (2.2%).
Current Local Time: CST time zone
Elevation: 1848 feet
Land area: 55.9 square miles.
Population density: 1,773 people per square mile (low).
5,875 residents are foreign born (4.5% Latin America, 0.6% Asia).
| This city: | 5.9% |
| Texas: | 17.1% |
Median real estate property taxes paid for housing units with mortgages in 2022: $3,497 (1.7%)
Median real estate property taxes paid for housing units with no mortgage in 2022: $1,632 (1.0%)
Nearest city with pop. 200,000+: Austin, TX  (179.3 miles , pop. 656,562).
Nearest city with pop. 1,000,000+: San Antonio, TX (180.4 miles , pop. 1,144,646).
Nearest cities:
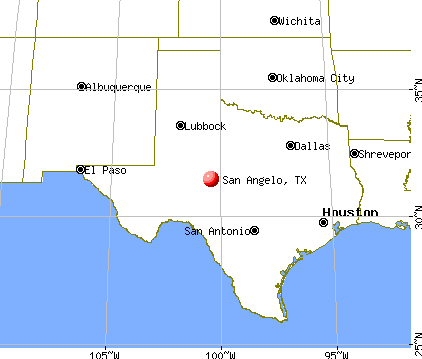
), ), ), ), ), ), )Latitude: 31.45 N, Longitude: 100.45 W
Daytime population change due to commuting: +525 (+0.5%)
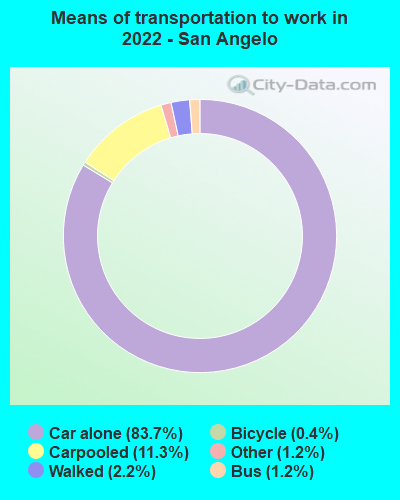
Workers who live and work in this city: 40,899 (85.8%)
Area code: 325
San Angelo tourist attractions:
San Angelo, Texas accommodation & food services, waste management - Economy and Business Data
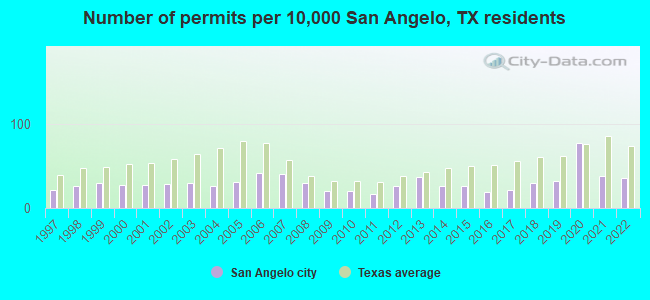
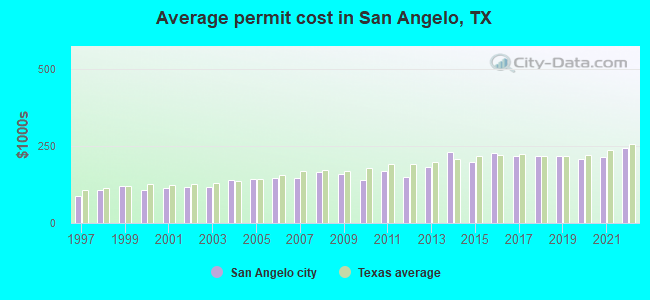
Single-family new house construction building permits:
- 2022: 322 buildings, average cost: $244,500
- 2021: 333 buildings, average cost: $215,800
- 2020: 686 buildings, average cost: $208,800
- 2019: 283 buildings, average cost: $217,300
- 2018: 262 buildings, average cost: $216,600
- 2017: 193 buildings, average cost: $217,700
- 2016: 172 buildings, average cost: $226,700
- 2015: 236 buildings, average cost: $197,100
- 2014: 229 buildings, average cost: $229,900
- 2013: 326 buildings, average cost: $180,500
- 2012: 229 buildings, average cost: $149,600
- 2011: 145 buildings, average cost: $168,400
- 2010: 177 buildings, average cost: $139,400
- 2009: 181 buildings, average cost: $160,700
- 2008: 259 buildings, average cost: $165,600
- 2007: 356 buildings, average cost: $147,000
- 2006: 369 buildings, average cost: $145,900
- 2005: 270 buildings, average cost: $142,500
- 2004: 231 buildings, average cost: $140,500
- 2003: 265 buildings, average cost: $116,900
- 2002: 251 buildings, average cost: $116,200
- 2001: 247 buildings, average cost: $114,600
- 2000: 239 buildings, average cost: $105,900
- 1999: 267 buildings, average cost: $120,800
- 1998: 230 buildings, average cost: $106,300
- 1997: 192 buildings, average cost: $89,000
| Here: | 2.9% |
| Texas: | 3.5% |
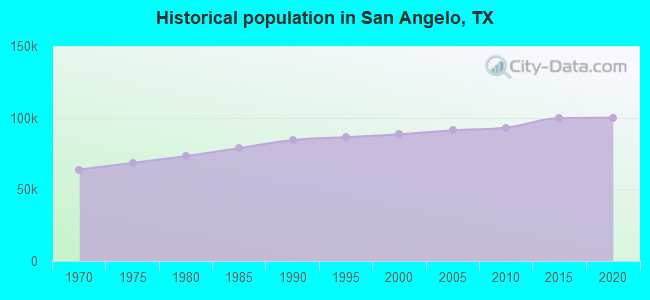
Population change in the 1990s: +3,657 (+4.3%).
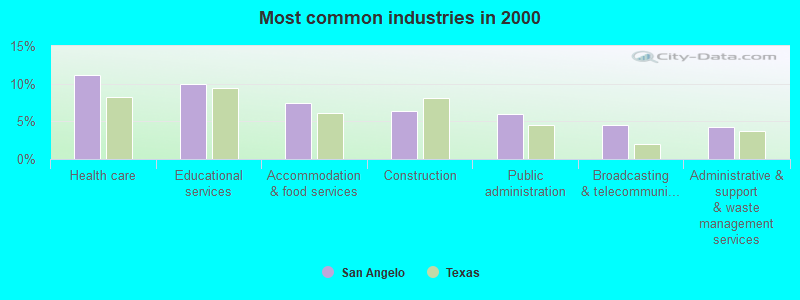
- Health care (11.2%)
- Educational services (10.0%)
- Accommodation & food services (7.4%)
- Construction (6.4%)
- Public administration (6.0%)
- Broadcasting & telecommunications (4.5%)
- Administrative & support & waste management services (4.3%)
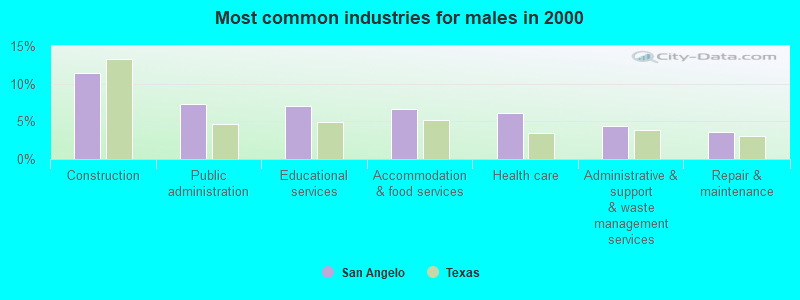
- Construction (11.5%)
- Public administration (7.3%)
- Educational services (7.1%)
- Accommodation & food services (6.7%)
- Health care (6.1%)
- Administrative & support & waste management services (4.4%)
- Repair & maintenance (3.6%)
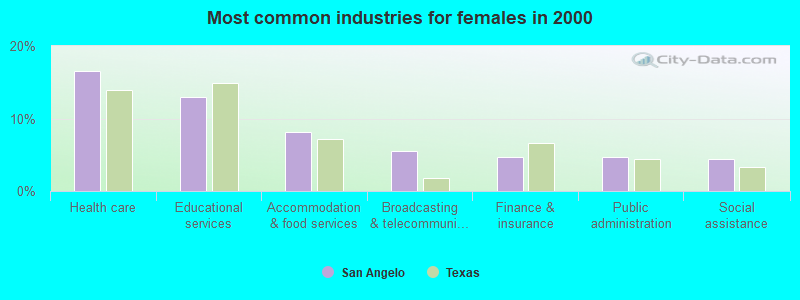
- Health care (16.5%)
- Educational services (13.0%)
- Accommodation & food services (8.1%)
- Broadcasting & telecommunications (5.5%)
- Finance & insurance (4.7%)
- Public administration (4.6%)
- Social assistance (4.5%)
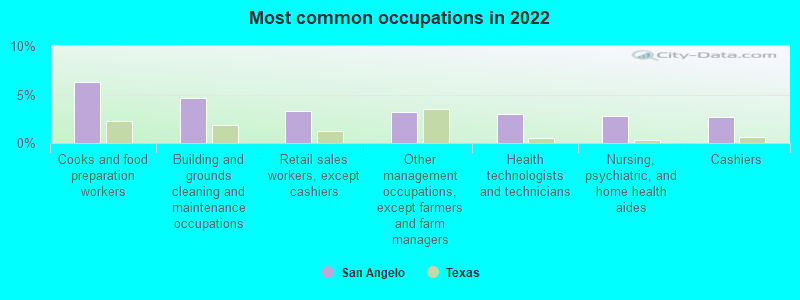
- Cooks and food preparation workers (6.3%)
- Building and grounds cleaning and maintenance occupations (4.6%)
- Retail sales workers, except cashiers (3.3%)
- Other management occupations, except farmers and farm managers (3.2%)
- Health technologists and technicians (3.0%)
- Nursing, psychiatric, and home health aides (2.8%)
- Cashiers (2.7%)
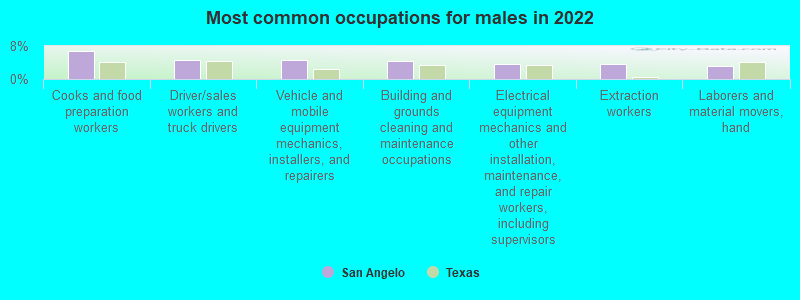
- Cooks and food preparation workers (6.8%)
- Driver/sales workers and truck drivers (4.7%)
- Vehicle and mobile equipment mechanics, installers, and repairers (4.6%)
- Building and grounds cleaning and maintenance occupations (4.3%)
- Electrical equipment mechanics and other installation, maintenance, and repair workers, including supervisors (3.6%)
- Extraction workers (3.6%)
- Laborers and material movers, hand (3.2%)
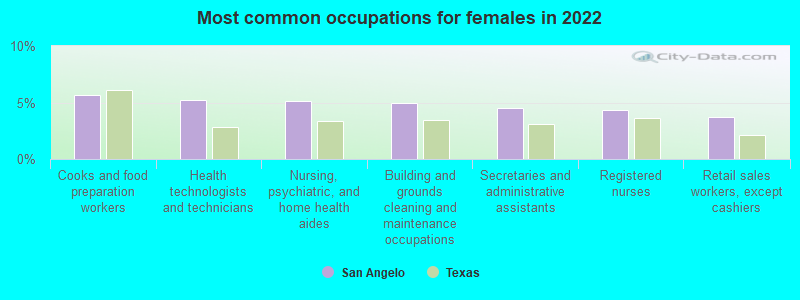
- Cooks and food preparation workers (5.6%)
- Health technologists and technicians (5.3%)
- Nursing, psychiatric, and home health aides (5.2%)
- Building and grounds cleaning and maintenance occupations (4.9%)
- Secretaries and administrative assistants (4.5%)
- Registered nurses (4.4%)
- Retail sales workers, except cashiers (3.7%)
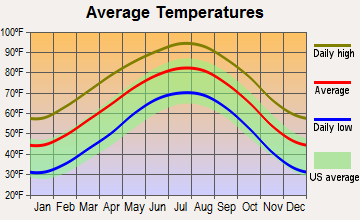
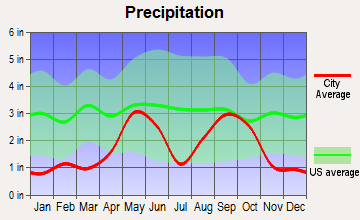
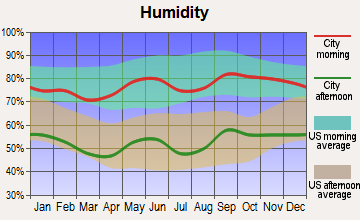
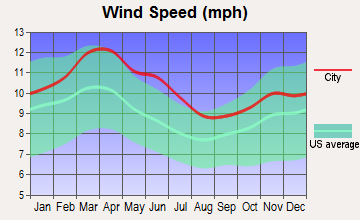
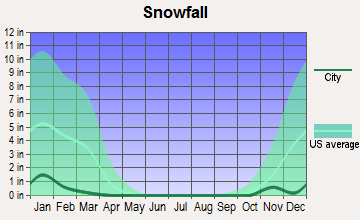
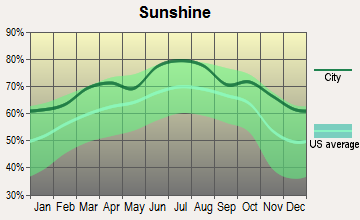
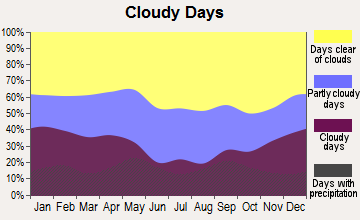
Average climate in San Angelo, Texas
Based on data reported by over 4,000 weather stations
|
|


Tornado activity:
San Angelo-area historical tornado activity is below Texas state average. It is 25% smaller than the overall U.S. average.
On 5/11/1953, a category F4 (max. wind speeds 207-260 mph) tornado 5.7 miles away from the San Angelo city center killed 13 people and injured 159 people and caused between $500,000 and $5,000,000 in damages.
On 4/30/1952, a category F3 (max. wind speeds 158-206 mph) tornado 1.1 miles away from the city center injured 6 people and caused between $50,000 and $500,000 in damages.
Earthquake activity:
San Angelo-area historical earthquake activity is significantly above Texas state average. It is 290% greater than the overall U.S. average.On 4/14/1995 at 00:32:56, a magnitude 5.7 (5.6 MB, 5.7 MS, 5.7 MW, Depth: 11.1 mi, Class: Moderate, Intensity: VI - VII) earthquake occurred 191.1 miles away from San Angelo center
On 6/16/1978 at 11:46:54, a magnitude 5.3 (4.4 MB, 4.6 UK, 5.3 ML) earthquake occurred 110.6 miles away from the city center
On 1/2/1992 at 11:45:35, a magnitude 5.0 (4.6 MB, 5.0 LG, Depth: 3.1 mi) earthquake occurred 167.1 miles away from the city center
On 3/26/2020 at 15:16:27, a magnitude 5.0 (5.0 MW, Depth: 5.9 mi) earthquake occurred 212.3 miles away from the city center
On 11/6/2011 at 03:53:10, a magnitude 5.7 (5.7 MW, Depth: 3.2 mi) earthquake occurred 353.3 miles away from the city center
On 9/11/2011 at 12:27:44, a magnitude 4.3 (4.3 MW, Depth: 3.1 mi, Class: Light, Intensity: IV - V) earthquake occurred 98.2 miles away from the city center
Magnitude types: regional Lg-wave magnitude (LG), body-wave magnitude (MB), local magnitude (ML), surface-wave magnitude (MS), moment magnitude (MW)
Natural disasters:
The number of natural disasters in Tom Green County (14) is near the US average (15).Major Disasters (Presidential) Declared: 4
Emergencies Declared: 8
Causes of natural disasters: Fires: 5, Hurricanes: 5, Floods: 3, Storms: 3, Tornadoes: 3, Wind: 1, Other: 1 (Note: some incidents may be assigned to more than one category).
Hospitals in San Angelo:
- BAPTIST MEMORIALS GERIATRIC HOSP (902 N MAIN BOX 5661)
- BLUEBONNET HOMES 2 (236 WESTWOOD)
- CAPITAL HEIGHTS HOME (1706 IDAHO)
- CASA DE MIMOSA (1041 E 44TH ST)
- CONCHO VALLEY REGIONAL HOSPITAL (provides emergency services, 2018 PULLIAM ST)
- MOSAIC (3613 WILDEWOOD)
- SAN ANGELO COMMUNITY MEDICAL CENTER (Proprietary, 3501 KNICKERBOCKER ROAD)
- SAN ANGELO INDEPENDENT LIVING TRAINING RESIDENCE (20 S KOENIGHEIM)
- SCCI HOSPITAL SAN ANGELO (2018 PULLIAM)
- TERRACE PLACE (42 TERRACE DR)
Airports and heliports located in San Angelo:
- San Angelo Regional/Mathis Field Airport (SJT) (Runways: 3, Commercial Ops: 5,806, Air Taxi Ops: 5,661, Itinerant Ops: 19,400, Local Ops: 11,033, Military Ops: 52,373)
- Ducote Airpark Airport (TS65) (Runways: 1, Itinerant Ops: 300, Local Ops: 1,500)
- Keystone Ranch Airport (5TE6) (Runways: 1)
- Reece Field Airport (94TA) (Runways: 1)
- Angelo Community Hospital Heliport (7TA9)
- Shannon Medical Center Heliport (03TS)
Colleges/Universities in San Angelo:
- Angelo State University (Full-time enrollment: 6,019; Location: 2601 W. Avenue N; Public; Website: www.angelo.edu; Offers Doctor's degree)
- American Commercial College-San Angelo (Full-time enrollment: 135; Location: 3177 Executive Dr; Private, for-profit; Website: www.americancommercialcollege.com)
- Texas College of Cosmetology-San Angelo (Full-time enrollment: 114; Location: 3504 Knickerbocker Road; Private, for-profit; Website: www.texascollegecosmetology.com)
Other colleges/universities with over 2000 students near San Angelo:
- Howard College (about 81 miles; Big Spring, TX; Full-time enrollment: 2,587)
- Abilene Christian University (about 83 miles; Abilene, TX; FT enrollment: 4,025)
- Midland College (about 106 miles; Midland, TX; FT enrollment: 3,650)
- Cisco College (about 109 miles; Cisco, TX; FT enrollment: 2,687)
- The University of Texas of the Permian Basin (about 115 miles; Odessa, TX; FT enrollment: 2,982)
- Odessa College (about 118 miles; Odessa, TX; FT enrollment: 3,107)
- Tarleton State University (about 142 miles; Stephenville, TX; FT enrollment: 8,882)
Biggest public high schools in San Angelo:
- CENTRAL H S (Students: 2,127, Location: 655 CADDO, Grades: 9-12)
- LAKE VIEW H S (Students: 1,184, Location: 900 E 43RD ST, Grades: 9-12)
- CENTRAL FRESHMAN CAMPUS (Students: 655, Location: 218 N OAKES ST, Grades: 9)
- TLC ACADEMY (Students: 633, Location: 5687 MELROSE, Grades: KG-12, Charter school)
- DAY HEAD START (Students: 201, Location: 3026 N OAKS, Grades: PK-9)
- CARVER ALTER LRN CTR (Students: 48, Location: 301 W 9TH ST, Grades: 6-12)
- FAIRVIEW DAEP (Location: 2405 FAIRVIEW SCHOOL RD, Grades: 7-12)
- FAIRVIEW VT (Location: 2405 FAIRVIEW SCHOOL RD, Grades: 9)
- FAIRVIEW ACCELERATED (Location: 2405 FAIRVIEW SCHOOL RD, Grades: 7-12)
- FAIRVIEW DAEP (Location: 2405 FAIRVIEW SCHOOL RD, Grades: 10-12)
Private high schools in San Angelo:
Biggest public elementary/middle schools in San Angelo:
- GLENN MIDDLE (Students: 1,144, Location: 2201 UNIVERSITY AVE, Grades: 6-8)
- LEE MIDDLE (Students: 905, Location: 2500 SHERWOOD WAY, Grades: 6-8)
- GRAPE CREEK INT (Students: 549, Location: 8207 US HWY 87 N, Grades: 3-5)
- GLENMORE EL (Students: 490, Location: 323 PENROSE ST, Grades: PK-5)
- BRADFORD EL (Students: 475, Location: 2302 BRADFORD ST, Grades: PK-5)
- SAN JACINTO EL (Students: 405, Location: 800 SPAULDING ST, Grades: PK-5)
- SANTA RITA EL (Students: 389, Location: 615 S MADISON ST, Grades: KG-5)
- BELAIRE EL (Students: 383, Location: 700 STEPHENS ST, Grades: KG-5)
- HOLIMAN EL (Students: 327, Location: 1900 RICKS DR, Grades: KG-5)
- ALTA LOMA EL (Students: 313, Location: 1700 N GARFIELD ST, Grades: PK-5)
Private elementary/middle schools in San Angelo:
Library in San Angelo:
User-submitted facts and corrections:
- Private School K-12 - Ambleside School of San Angelo 511 West Harris, San Angelo, TX 76901 (325) 659-1659
- HOWARD COLLEGE - SAN ANGELO (Full-time enrollment: 1,250); Location: 3501 N. US Hwy 67; Public; Website: www.howardcollege.edu/san_angelo; Offers Associate's degree)
Points of interest:
Notable locations in San Angelo: San Angelo Country Club (A), San Angelo Gun Club (B), State Fish Hatchery Number 1 (C), Angelo Heights Historic District (D), Santa Fe Passenger and Freight Depot (E), Frederick Beck Farm (F), Tom Green County Courthouse (G), Eckert House (H), Freeze Building (I), Hagelstein Commercial Building (J), Holcomb-Blanton Print Shop (K), Hilton Hotel (L), Household Furniture Company Building (M), J J Rackley Building (N), J B Blakeney House (O), J T and Minnie McClelland House (P), John and Anton Willeke House (Q), John C Westbrook House (R), Johnson and Taylor Building (S), John Willeke Senior House (T). Display/hide their locations on the map
Shopping Center: Sunset Shopping Center (1). Display/hide its location on the map
Churches in San Angelo include: Belmore Baptist Church (A), Christadelphian Church (B), Fairview Church (C), Grace Church (D), First Presbyterian Church (E), Greater Saint Paul AME Church (F), Iglesia Santa Maria (G), Emmanuel Episcopal Church (H), North Chadbourne Church of Christ (I). Display/hide their locations on the map
Cemeteries: Fairmount Cemetery (1), Calvary Cemetery (2), Belvedere Memorial Cemetery (3), Delta Memorial Cemetery (4). Display/hide their locations on the map
Lakes and reservoirs: Lake Nasworthy (A), Municipal Swimming Pool A1767 (B), Lake Nasworthy (C), Lone Wolf Reservoir (D), Johnson Reservoir (E), Metcalfe Lake (F), Bell Street Reservoir (G), Ben Ficklin Reservoir (H). Display/hide their locations on the map
Rivers: South Concho River (A), North Concho River (B), Middle Concho River (C). Display/hide their locations on the map
Parks in San Angelo include: Lincoln Park (1), Lakeview Park (2), Kiwanis Park (3), South Concho Park (4), Santa Fe Park (5), Santa Rita Park (6), San Angelo City Park (7), San Angelo Fairgrounds (8), Rio Concho Park (9). Display/hide their locations on the map
Tourist attraction: Children's Art Museum (36 East Twohig Avenue) (1). Display/hide its approximate location on the map
Hotels: Clarion Inn & Suites (333 Rio Concho Drive) (1), Angelo Inn (3303 Gafb) (2), Comfort Inn (2502 W Loop 306) (3), Cattleman's Restaurant & Sports BR at the Hldy Inn (441 Rio Concho Drive) (4), Best Western San Angelo (3017 Loop 306) (5), Americana Lodge (1717 West Beauregard Ave) (6). Display/hide their approximate locations on the map
Court: United States Government Offices - Federal Bureau Of Investigation (3471 Knickerbocker Road) (1). Display/hide its approximate location on the map
Birthplace of: Jay Presson Allen - Screenwriter, Charles Williams (U.S. author) - Writer, Jarrett Lee - Football player, Jimmie Keeling - Football coach, Bill McGill - Basketball player, Grant Speed - Western sculptor, Greg Maddux - 2005 Major League Baseball player (Chicago Cubs, born: Apr 14, 1966), Jack W. Mathis - Air Force Medal of Honor recipient, Michael-Ryan Fletchall - Film producer, Michelle Lemmons-Poscente - Chief executive.
Drinking water stations with addresses in San Angelo and their reported violations in the past:
THE WATER BARREL (Population served: 275, Purch surface water):Past health violations:TWIN MOUNTAIN STEAK HOUSE (Population served: 175, Purch surface water):Past monitoring violations:
- MCL, Monthly (TCR) - In JUL-2009, Contaminant: Coliform. Follow-up actions: St Public Notif requested (JUL-10-2009), St Violation/Reminder Notice (JUL-10-2009), St Public Notif received (JUL-25-2009), St Compliance achieved (JUL-31-2009)
- 3 minor monitoring violations
Past monitoring violations:KENT KWIK CONVENIENCE STORE 307 (Population served: 100, Purch groundwater):
- Monitoring, Repeat Major (TCR) - In MAY-2006, Contaminant: Coliform (TCR). Follow-up actions: St Public Notif requested (JUN-21-2006), St Violation/Reminder Notice (JUN-21-2006), St AO (w/penalty) issued (AUG-20-2006), St Compliance achieved (DEC-01-2006)
- 13 routine major monitoring violations
Past monitoring violations:BROWNS POOL AND PARK (Population served: 40, Groundwater):
- Failure to Notify Other PWS - In MAR-15-2012, Contaminant: GROUNDWATER RULE. Follow-up actions: St Violation/Reminder Notice (MAY-29-2012), St Formal NOV issued (MAY-01-2013), St AO (w/penalty) issued (JAN-25-2014)
- 10 routine major monitoring violations
- 2 minor monitoring violations
- 2 regular monitoring violations
Past monitoring violations:
- Monitoring and Reporting (DBP) - Between OCT-2013 and DEC-2013, Contaminant: Chlorine. Follow-up actions: St Public Notif requested (MAY-20-2014), St Violation/Reminder Notice (MAY-20-2014), St Compliance achieved (JUL-17-2014), St Public Notif received (AUG-11-2014)
- Monitoring and Reporting (DBP) - Between JUL-2013 and SEP-2013, Contaminant: Chlorine. Follow-up actions: St Public Notif requested (MAY-20-2014), St Violation/Reminder Notice (MAY-20-2014), St Compliance achieved (JUL-17-2014), St Public Notif received (AUG-11-2014)
- Follow-up Or Routine LCR Tap M/R - In JUL-01-2012, Contaminant: Lead and Copper Rule. Follow-up actions: St Compliance achieved (JUL-15-2013)
- Monitoring and Reporting (DBP) - Between JAN-2007 and MAR-2007, Contaminant: Chlorine. Follow-up actions: St Public Notif requested (JUL-19-2007), St Violation/Reminder Notice (JUL-19-2007), St Public Notif received (SEP-12-2007), St Compliance achieved (JAN-25-2011)
- Monitoring and Reporting (DBP) - Between OCT-2006 and DEC-2006, Contaminant: Chlorine. Follow-up actions: St Public Notif requested (JUL-19-2007), St Violation/Reminder Notice (JUL-19-2007), St Compliance achieved (JAN-25-2011)
- One regular monitoring violation
- 7 other older monitoring violations
Drinking water stations with addresses in San Angelo that have no violations reported:
- CONCHO RURAL WATER WATER HAULING (Population served: 459, Primary Water Source Type: Purch groundwater)
- WATER WAGON WATER HAULING SERVICE (Population served: 450, Primary Water Source Type: Purch surface water)
| This city: | 2.5 people |
| Texas: | 2.8 people |
| This city: | 63.4% |
| Whole state: | 69.9% |
| This city: | 6.5% |
| Whole state: | 6.0% |
Likely homosexual households (counted as self-reported same-sex unmarried-partner households)
- Lesbian couples: 0.4% of all households
- Gay men: 0.2% of all households
People in group quarters in San Angelo in 2010:
- 1,924 people in military barracks and dormitories (nondisciplinary)
- 1,647 people in college/university student housing
- 411 people in local jails and other municipal confinement facilities
- 365 people in nursing facilities/skilled-nursing facilities
- 247 people in group homes intended for adults
- 170 people in residential treatment centers for adults
- 61 people in other noninstitutional facilities
- 12 people in group homes for juveniles (non-correctional)
- 12 people in workers' group living quarters and job corps centers
- 9 people in emergency and transitional shelters (with sleeping facilities) for people experiencing homelessness
People in group quarters in San Angelo in 2000:
- 1,269 people in military barracks, etc.
- 1,239 people in college dormitories (includes college quarters off campus)
- 787 people in nursing homes
- 291 people in local jails and other confinement facilities (including police lockups)
- 147 people in military transient quarters for temporary residents
- 127 people in homes for the mentally retarded
- 39 people in other noninstitutional group quarters
- 28 people in unknown juvenile institutions
- 13 people in short-term care, detention or diagnostic centers for delinquent children
- 10 people in religious group quarters
- 4 people in homes for abused, dependent, and neglected children
Banks with most branches in San Angelo (2011 data):
- Wells Fargo Bank, National Association: San Angelo Main Branch, San Angelo West Branch, San Angelo North Branch, San Angelo Main Mb Branch. Info updated 2011/04/05: Bank assets: $1,161,490.0 mil, Deposits: $905,653.0 mil, headquarters in Sioux Falls, SD, positive income, 6395 total offices, Holding Company: Wells Fargo & Company
- Texas State Bank: Drive-In Facility, at 2201 Sherwood Way, Chadbourne Branch, College Hills Branch. Info updated 2008/04/17: Bank assets: $223.3 mil, Deposits: $197.3 mil, local headquarters, positive income, 4 total offices, Holding Company: Texas Bancorp, Inc.
- Crockett National Bank: Sherwood Way Store No. 204 Branch, Grape Creek Branch, San Angelo Branch, Store Number 5 Branch. Info updated 2011/04/12: Bank assets: $299.7 mil, Deposits: $247.2 mil, headquarters in Ozona, TX, positive income, Agricultural Specialization, 5 total offices, Holding Company: Crockett County National Bancshares, Inc
- Bank of America, National Association: Twohig Branch, Sherwood Way Motor Branch, Sherwood Way Branch. Info updated 2009/11/18: Bank assets: $1,451,969.3 mil, Deposits: $1,077,176.8 mil, headquarters in Charlotte, NC, positive income, 5782 total offices, Holding Company: Bank Of America Corporation
- First Financial Bank, National Association: at 301 West Beauregard Street, Detached Drive-In Facility, Southwest Branch. Info updated 2009/08/14: Bank assets: $419.9 mil, Deposits: $356.0 mil, local headquarters, positive income, 3 total offices, Holding Company: First Financial Bankshares, Inc.
- The First National Bank of Mertzon: First National Bank Of Mertzon at 3399 Knickerbocker Rd, branch established on 1998/12/01; Tom Green Branch at 230 West Twohig Avenue, branch established on 1989/08/25. Info updated 2006/11/03: Bank assets: $260.5 mil, Deposits: $242.6 mil, headquarters in Mertzon, TX, positive income, 3 total offices
- First National Bank Texas: San Angelo Banking Center - Rc 650 at 5501 Sherwood Way, branch established on 2000/02/16; West Banking Center - Rc 690 at 610 West 29th Street, branch established on 2006/10/18. Info updated 2006/11/03: Bank assets: $944.3 mil, Deposits: $815.9 mil, headquarters in Killeen, TX, positive income, Mortgage Lending Specialization, 250 total offices, Holding Company: First Community Bancshares, Inc.
- The First National Bank of Sonora: Banking Center Branch at 2502 Southland Boulevard, branch established on 1998/05/18; San Angelo Banking Center Branch at 5710 Sherwood Way, branch established on 1994/11/14. Info updated 2011/04/19: Bank assets: $313.4 mil, Deposits: $274.5 mil, headquarters in Sonora, TX, positive income, Commercial Lending Specialization, 4 total offices, Holding Company: First Sonora Bancshares, Inc.
- Compass Bank: San Angelo Branch at 4112 College Hills Boulevard, branch established on 1985/06/30. Info updated 2011/02/24: Bank assets: $63,107.0 mil, Deposits: $46,232.4 mil, headquarters in Birmingham, AL, negative income in the last year, Commercial Lending Specialization, 720 total offices, Holding Company: Banco Bilbao Vizcaya Argentaria, S.A.
- 6 other banks with 6 local branches
For population 15 years and over in San Angelo:
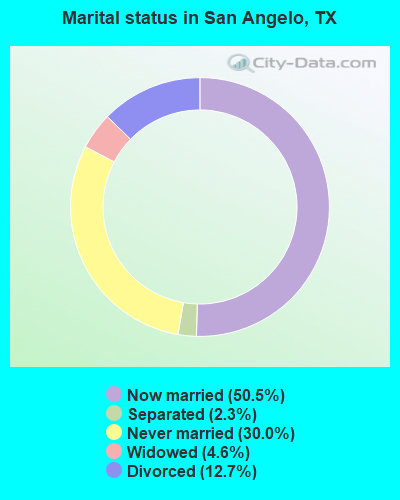
- Never married: 30.0%
- Now married: 50.5%
- Separated: 2.3%
- Widowed: 4.6%
- Divorced: 12.7%
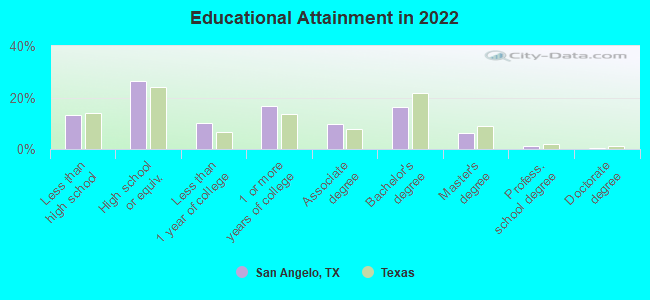
For population 25 years and over in San Angelo:
- High school or higher: 86.9%
- Bachelor's degree or higher: 24.2%
- Graduate or professional degree: 7.7%
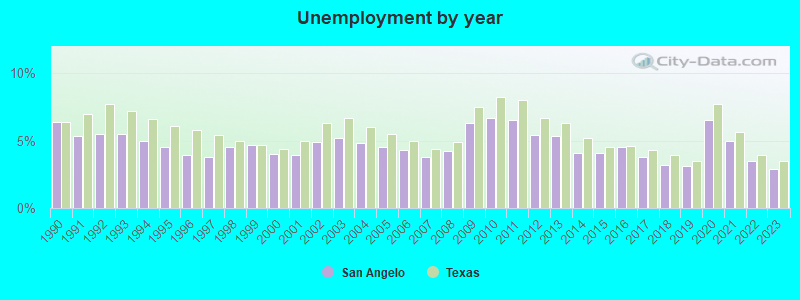
- Unemployed: 7.0%
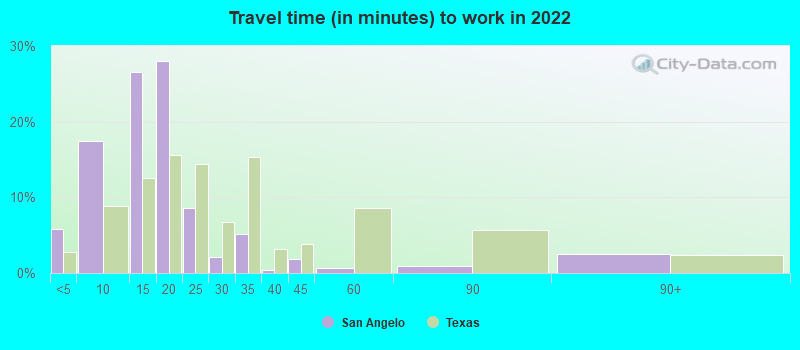
- Mean travel time to work (commute): 16.9 minutes
| Here: | 12.2 |
| Texas average: | 14.0 |
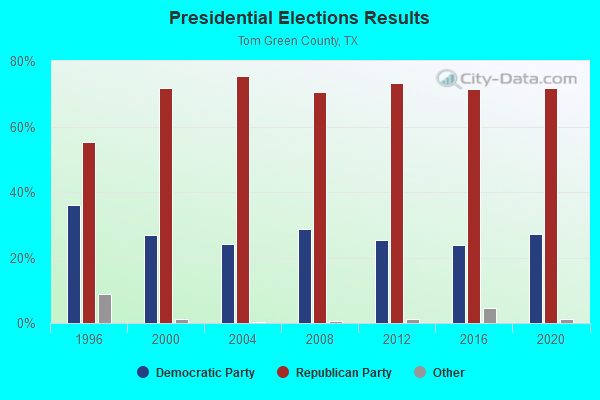
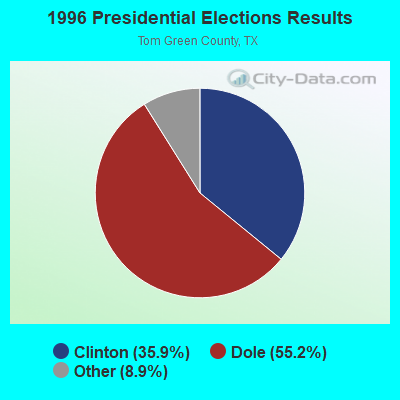

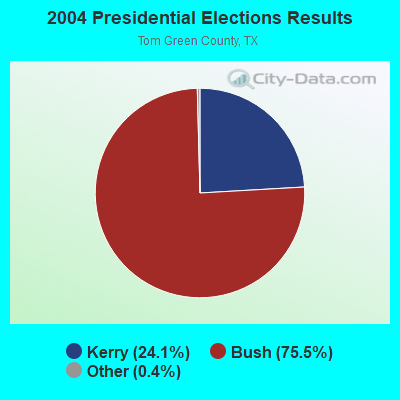

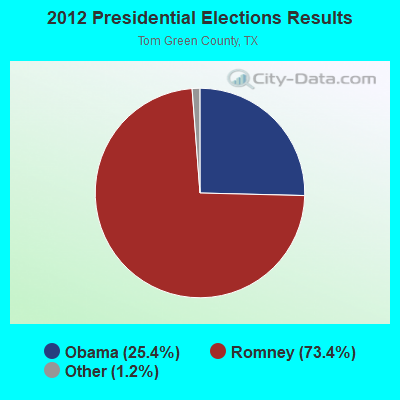
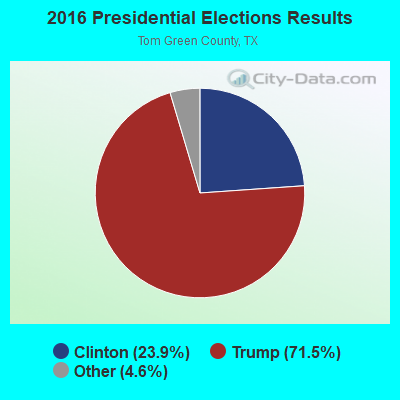
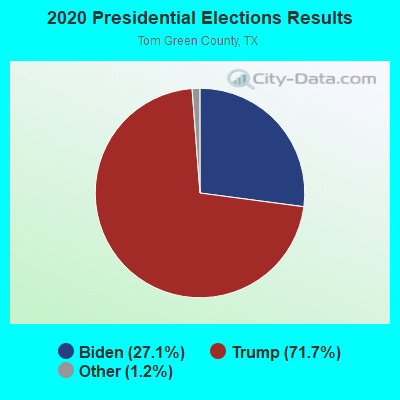
Graphs represent county-level data. Detailed 2008 Election Results
Religion statistics for San Angelo, TX (based on Tom Green County data)
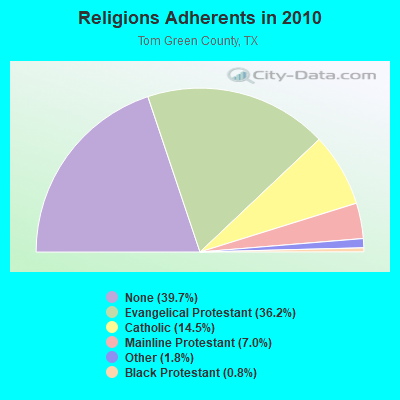
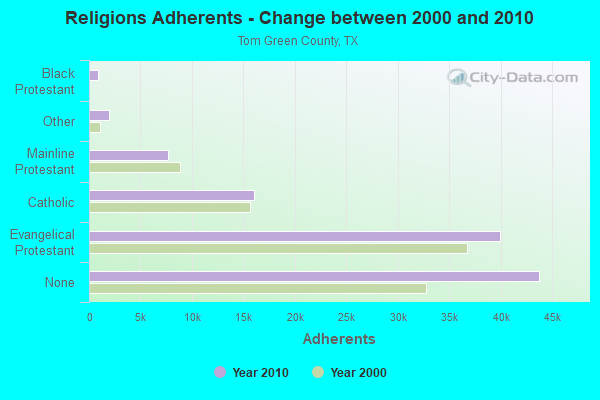
| Religion | Adherents | Congregations |
|---|---|---|
| Evangelical Protestant | 39,916 | 100 |
| Catholic | 16,000 | 9 |
| Mainline Protestant | 7,675 | 21 |
| Other | 1,957 | 7 |
| Black Protestant | 848 | 6 |
| Orthodox | 77 | 1 |
| None | 43,751 | - |
Food Environment Statistics:
| Tom Green County: | 1.31 / 10,000 pop. |
| State: | 1.47 / 10,000 pop. |
| Tom Green County: | 0.19 / 10,000 pop. |
| State: | 0.14 / 10,000 pop. |
| This county: | 1.13 / 10,000 pop. |
| Texas: | 1.11 / 10,000 pop. |
| This county: | 6.38 / 10,000 pop. |
| Texas: | 3.95 / 10,000 pop. |
| This county: | 7.32 / 10,000 pop. |
| Texas: | 6.13 / 10,000 pop. |
| Tom Green County: | 9.7% |
| Texas: | 8.9% |
| Here: | 26.6% |
| Texas: | 26.6% |
| Tom Green County: | 12.8% |
| Texas: | 15.7% |
Health and Nutrition:
| San Angelo: | 49.2% |
| Texas: | 48.6% |
| Here: | 48.0% |
| State: | 47.4% |
| San Angelo: | 28.5 |
| Texas: | 28.5 |
| This city: | 20.6% |
| State: | 20.6% |
| This city: | 10.7% |
| Texas: | 10.3% |
| San Angelo: | 6.8 |
| Texas: | 6.8 |
| This city: | 33.8% |
| Texas: | 33.1% |
| Here: | 56.2% |
| State: | 56.2% |
| San Angelo: | 79.9% |
| Texas: | 80.7% |
More about Health and Nutrition of San Angelo, TX Residents
| Local government employment and payroll (March 2022) | |||||
| Function | Full-time employees | Monthly full-time payroll | Average yearly full-time wage | Part-time employees | Monthly part-time payroll |
|---|---|---|---|---|---|
| Firefighters | 183 | $1,390,052 | $91,151 | 0 | $0 |
| Police Protection - Officers | 178 | $1,026,961 | $69,233 | 0 | $0 |
| Water Supply | 100 | $441,972 | $53,037 | 0 | $0 |
| Parks and Recreation | 68 | $215,647 | $38,055 | 30 | $12,015 |
| Streets and Highways | 59 | $216,781 | $44,091 | 1 | $627 |
| Sewerage | 55 | $209,829 | $45,781 | 0 | $0 |
| Other Government Administration | 50 | $282,398 | $67,776 | 10 | $6,621 |
| Other and Unallocable | 42 | $182,149 | $52,043 | 4 | $3,700 |
| Judicial and Legal | 34 | $160,569 | $56,671 | 2 | $3,324 |
| Financial Administration | 29 | $136,942 | $56,666 | 1 | $502 |
| Police - Other | 28 | $89,536 | $38,373 | 25 | $11,337 |
| Health | 24 | $91,164 | $45,582 | 9 | $9,912 |
| Fire - Other | 12 | $50,281 | $50,281 | 0 | $0 |
| Airports | 11 | $41,021 | $44,750 | 2 | $3,078 |
| Welfare | 11 | $51,561 | $56,248 | 3 | $4,753 |
| Housing and Community Development (Local) | 4 | $25,090 | $75,270 | 1 | $240 |
| Solid Waste Management | 3 | $13,599 | $54,396 | 0 | $0 |
| Totals for Government | 891 | $4,625,553 | $62,297 | 88 | $56,109 |
San Angelo government finances - Expenditure in 2021 (per resident):
- Construction - Sewerage: $3,026,000 ($30.53)
Water Utilities: $1,486,000 ($14.99)
Regular Highways: $970,000 ($9.79)
Parks and Recreation: $852,000 ($8.60)
General Public Buildings: $440,000 ($4.44)
Air Transportation: $205,000 ($2.07)
General - Other: $30,000 ($0.30)
Natural Resources - Other: $25,000 ($0.25)
Health - Other: $3,000 ($0.03)
- Current Operations - General - Other: $23,626,000 ($238.38)
Police Protection: $21,728,000 ($219.23)
Local Fire Protection: $21,615,000 ($218.09)
Water Utilities: $13,168,000 ($132.86)
Regular Highways: $9,383,000 ($94.67)
Sewerage: $9,257,000 ($93.40)
Parks and Recreation: $9,235,000 ($93.18)
Central Staff Services: $5,752,000 ($58.04)
Judicial and Legal Services: $3,042,000 ($30.69)
Financial Administration: $2,776,000 ($28.01)
Natural Resources - Other: $1,719,000 ($17.34)
Air Transportation: $1,661,000 ($16.76)
Housing and Community Development: $1,506,000 ($15.19)
Solid Waste Management: $1,464,000 ($14.77)
Protective Inspection and Regulation - Other: $1,442,000 ($14.55)
Health - Other: $1,387,000 ($13.99)
General Public Buildings: $730,000 ($7.37)
Miscellaneous Commercial Activities - Other: $396,000 ($4.00)
Public Welfare Institutions: $251,000 ($2.53)
- General - Interest on Debt: $3,026,000 ($30.53)
- Other Capital Outlay - Local Fire Protection: $1,660,000 ($16.75)
Police Protection: $868,000 ($8.76)
Regular Highways: $651,000 ($6.57)
Parks and Recreation: $507,000 ($5.12)
General - Other: $137,000 ($1.38)
Water Utilities: $121,000 ($1.22)
Sewerage: $85,000 ($0.86)
Central Staff Services: $85,000 ($0.86)
General Public Building: $80,000 ($0.81)
Natural Resources - Other: $46,000 ($0.46)
Judicial and Legal Services: $13,000 ($0.13)
Financial Administration: $10,000 ($0.10)
Housing and Community Development: $10,000 ($0.10)
Air Transportation: $2,000 ($0.02)
Protective Inspection and Regulation - Other: $1,000 ($0.01)
- Total Salaries and Wages: $47,839,000 ($482.68)
- Water Utilities - Interest on Debt: $4,668,000 ($47.10)
San Angelo government finances - Revenue in 2021 (per resident):
- Charges - Sewerage: $17,107,000 ($172.60)
Solid Waste Management: $2,142,000 ($21.61)
Air Transportation: $1,379,000 ($13.91)
Parks and Recreation: $378,000 ($3.81)
Miscellaneous Commercial Activities: $370,000 ($3.73)
- Federal Intergovernmental - Housing and Community Development: $904,000 ($9.12)
Air Transportation: $612,000 ($6.17)
- Local Intergovernmental - Other: $628,000 ($6.34)
- Miscellaneous - General Revenue - Other: $47,390,000 ($478.15)
Interest Earnings: $2,924,000 ($29.50)
Fines and Forfeits: $2,768,000 ($27.93)
Rents: $2,425,000 ($24.47)
Donations From Private Sources: $430,000 ($4.34)
Royalties: $59,000 ($0.60)
- Revenue - Water Utilities: $35,956,000 ($362.78)
- State Intergovernmental - Public Welfare: $964,000 ($9.73)
General Local Government Support: $360,000 ($3.63)
Health and Hospitals: $332,000 ($3.35)
Highways: $312,000 ($3.15)
- Tax - Property: $42,038,000 ($424.15)
General Sales and Gross Receipts: $30,660,000 ($309.35)
Other Selective Sales: $2,389,000 ($24.10)
Alcoholic Beverage License: $57,000 ($0.58)
San Angelo government finances - Debt in 2021 (per resident):
- Long Term Debt - Outstanding Unspecified Public Purpose: $260,279,000 ($2626.11)
Beginning Outstanding - Unspecified Public Purpose: $204,802,000 ($2066.37)
Issue, Unspecified Public Purpose: $72,355,000 ($730.03)
Retired Unspecified Public Purpose: $16,878,000 ($170.29)
Beginning Outstanding - Public Debt for Private Purpose: $1,179,000 ($11.90)
Outstanding Nonguaranteed - Industrial Revenue: $1,072,000 ($10.82)
Retired Nonguaranteed - Public Debt for Private Purpose: $107,000 ($1.08)
San Angelo government finances - Cash and Securities in 2021 (per resident):
- Bond Funds - Cash and Securities: $44,161,000 ($445.57)
- Other Funds - Cash and Securities: $259,976,000 ($2623.05)
- Sinking Funds - Cash and Securities: $1,072,000 ($10.82)
7.07% of this county's 2021 resident taxpayers lived in other counties in 2020 ($51,968 average adjusted gross income)
| Here: | 7.07% |
| Texas average: | 8.12% |
0.10% of residents moved from foreign countries ($710 average AGI)
Tom Green County: 0.10% Texas average: 0.04%
Top counties from which taxpayers relocated into this county between 2020 and 2021:
| from Midland County, TX | |
| from Bexar County, TX | |
| from Taylor County, TX |
8.20% of this county's 2020 resident taxpayers moved to other counties in 2021 ($47,126 average adjusted gross income)
| Here: | 8.20% |
| Texas average: | 7.40% |
0.18% of residents moved to foreign countries ($964 average AGI)
Tom Green County: 0.18% Texas average: 0.03%
Top counties to which taxpayers relocated from this county between 2020 and 2021:
| to Bexar County, TX | |
| to Midland County, TX | |
| to Tarrant County, TX |
| Businesses in San Angelo, TX | ||||
| Name | Count | Name | Count | |
|---|---|---|---|---|
| 7-Eleven | 7 | KFC | 1 | |
| AT&T | 2 | Knights Inn | 1 | |
| Academy Sports + Outdoors | 1 | La Quinta | 1 | |
| Ace Hardware | 1 | Lane Furniture | 4 | |
| Advance Auto Parts | 1 | Little Caesars Pizza | 2 | |
| Aeropostale | 1 | Long John Silver's | 1 | |
| Albertsons | 1 | Lowe's | 1 | |
| American Eagle Outfitters | 1 | Marriott | 2 | |
| Applebee's | 1 | Maurices | 1 | |
| Arby's | 1 | Mazda | 1 | |
| Ashley Furniture | 1 | McDonald's | 4 | |
| AutoZone | 3 | Microtel | 1 | |
| Avenue | 1 | Nike | 5 | |
| Baskin-Robbins | 1 | Nissan | 1 | |
| Bath & Body Works | 1 | Office Depot | 1 | |
| Bed Bath & Beyond | 1 | OfficeMax | 1 | |
| Best Western | 1 | Outback | 1 | |
| Blockbuster | 1 | Outback Steakhouse | 1 | |
| Budget Car Rental | 1 | Pac Sun | 1 | |
| Burger King | 2 | Papa John's Pizza | 1 | |
| CVS | 2 | Payless | 2 | |
| Chevrolet | 1 | PetSmart | 1 | |
| Chick-Fil-A | 3 | Pier 1 Imports | 1 | |
| Church's Chicken | 2 | Pizza Hut | 4 | |
| Cinnabon | 1 | Quiznos | 2 | |
| ColorTyme | 1 | RadioShack | 2 | |
| Comfort Suites | 1 | Ramada | 1 | |
| Curves | 2 | Red Lobster | 1 | |
| Dairy Queen | 1 | Rodeway Inn | 1 | |
| Days Inn | 1 | Rue21 | 1 | |
| Dennys | 1 | SONIC Drive-In | 4 | |
| Discount Tire | 1 | Sam's Club | 1 | |
| Domino's Pizza | 2 | Sears | 2 | |
| Famous Footwear | 1 | Sprint Nextel | 3 | |
| FedEx | 18 | Starbucks | 1 | |
| Finish Line | 1 | Subway | 6 | |
| Firestone Complete Auto Care | 2 | Super 8 | 1 | |
| Foot Locker | 1 | T-Mobile | 3 | |
| Ford | 1 | Taco Bell | 4 | |
| GNC | 2 | Target | 1 | |
| GameStop | 2 | The Room Place | 1 | |
| Goodwill | 5 | Toyota | 1 | |
| H&R Block | 3 | Travelodge | 1 | |
| Havertys Furniture | 1 | U-Haul | 5 | |
| Hobby Lobby | 1 | UPS | 18 | |
| Holiday Inn | 2 | Vans | 3 | |
| Home Depot | 1 | Verizon Wireless | 1 | |
| Honda | 1 | Victoria's Secret | 1 | |
| Hot Topic | 1 | Walgreens | 2 | |
| IHOP | 1 | Walmart | 2 | |
| JCPenney | 1 | Wendy's | 1 | |
| Jones New York | 2 | Wet Seal | 1 | |
| Journeys | 1 | YMCA | 1 | |
Strongest AM radio stations in San Angelo:
- KGKL (960 AM; 5 kW; SAN ANGELO, TX; Owner: KGKL, INC.)
- KCRN (1340 AM; 1 kW; SAN ANGELO, TX; Owner: CRISWELL CENTER OF BIBLICAL STUDIES)
- KKSA (1260 AM; 1 kW; SAN ANGELO, TX; Owner: FOSTER COMMUNICATIONS COMPANY, INC.)
- KKYX (680 AM; 50 kW; SAN ANTONIO, TX; Owner: CXR HOLDINGS, INC.)
- KTKR (760 AM; 50 kW; SAN ANTONIO, TX; Owner: CCB TEXAS LICENSES, L.P.)
- WBAP (820 AM; 50 kW; FORT WORTH, TX; Owner: WBAP-KSCS OPERATING, LTD.)
- WOAI (1200 AM; 50 kW; SAN ANTONIO, TX; Owner: CCB TEXAS LICENSES, L.P.)
- KAHZ (1360 AM; 50 kW; HURST, TX)
- KESS (1270 AM; 50 kW; FORT WORTH, TX; Owner: KESS-AM LICENSE CORP.)
- KCRS (550 AM; 5 kW; MIDLAND, TX; Owner: CCB TEXAS LICENSES, L.P.)
- KRLD (1080 AM; 50 kW; DALLAS, TX; Owner: TEXAS INFINITY BROADCASTING L.P.)
- KENS (1160 AM; 25 kW; SAN ANTONIO, TX; Owner: KENS-TV, INC.)
- KICA (980 AM; 50 kW; CLOVIS, NM; Owner: BROADCAST ENTERTAINMENT CORPORATION)
Strongest FM radio stations in San Angelo:
- KWFR (101.9 FM; SAN ANGELO, TX; Owner: FOSTER COMMUNICATIONS, INC.)
- KIXY-FM (94.7 FM; SAN ANGELO, TX; Owner: FOSTER COMMUNICATIONS COMPANY, INC.)
- KYZZ (100.1 FM; SAN ANGELO, TX; Owner: AUDREY EILEEN CARVER LUNA)
- KGKL-FM (97.5 FM; SAN ANGELO, TX; Owner: KGKL, INC.)
- KDCD (92.9 FM; SAN ANGELO, TX; Owner: REGENCY BROADCASTING)
- KSJT-FM (107.5 FM; SAN ANGELO, TX; Owner: LA UNICA B/CNG CO.)
- KUTX (90.1 FM; SAN ANGELO, TX; Owner: THE UNIVERSITY OF TEXAS AT AUSTIN)
- KMDX (106.1 FM; SAN ANGELO, TX; Owner: REGENCY BROADCASTING, INC.)
- KSCE-FM1 (96.5 FM; SAN ANGELO, TX; Owner: GRAHAM BROTHERS COMMUNICATIONS, LLC)
- KCSA-LP (95.7 FM; SAN ANGELO, TX; Owner: CONCHO CHRISTMAS CELEBRATION, INC.)
- KKCN-FM1 (103.1 FM; SAN ANGELO, TX; Owner: GRAHAM BROTHERS COMMUNICATIONS, LLC)
- KELI (98.7 FM; SAN ANGELO, TX; Owner: KGKL, INC.)
- KCRN-FM (93.9 FM; SAN ANGELO, TX; Owner: CRISWELL CENTER FOR BIBLICAL STUDIES)
- KCSE (96.5 FM; STERLING CITY, TX; Owner: GRAHAM BROTHERS COMM., L.L.C..)
- KKCN (103.1 FM; BALLINGER, TX; Owner: GRAHAM BROTHERS COMM., L.L.C.)
- K261BI (100.1 FM; SAN ANGELO, TX; Owner: J AND J BROADCASTING)
- K215BH (90.9 FM; SAN ANGELO, TX; Owner: CHRISTIAN BROADCASTING COMPANY, INC.)
TV broadcast stations around San Angelo:
- KEUS-LP (Channel 31; SAN ANGELO, TX; Owner: ENTRAVISION HOLDINGS, LLC)
- KTXE-LP (Channel 38; SAN ANGELO, TX; Owner: ABILENE-SWEETWATER BROADCASTING COMPANY)
- KANG-CA (Channel 41; SAN ANGELO, TX; Owner: ENTRAVISION HOLDINGS, LLC)
- KIDY (Channel 6; SAN ANGELO, TX; Owner: SAGE BROADCASTING CORPORATION)
- K44FJ (Channel 44; SAN ANGELO, TX; Owner: TRINITY BROADCASTING NETWORK)
- KLST (Channel 8; SAN ANGELO, TX; Owner: JEWELL TELEVISION CORPORATION)
- KPKS-LP (Channel 51; SAN ANGELO, TX; Owner: PRIME TIME CHRISTIAN BROADCASTING, INC)
- KACB-TV (Channel 3; SAN ANGELO, TX; Owner: MISSION BROADCASTING, INC.)
Medal of Honor Recipients
Medal of Honor Recipient born in San Angelo: Jack W. Mathis.
- National Bridge Inventory (NBI) Statistics
- 221Number of bridges
- 3,287ft / 1,002mTotal length
- $3,305,000Total costs
- 1,577,570Total average daily traffic
- 122,485Total average daily truck traffic
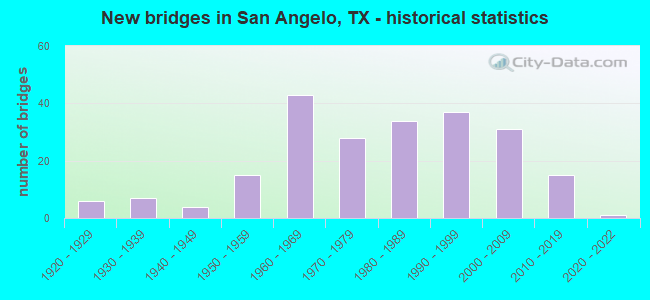
- New bridges - historical statistics
- 61920-1929
- 71930-1939
- 41940-1949
- 151950-1959
- 431960-1969
- 281970-1979
- 341980-1989
- 371990-1999
- 312000-2009
- 152010-2019
- 12020-2022
FCC Registered Antenna Towers: 678 (See the full list of FCC Registered Antenna Towers)
FCC Registered Commercial Land Mobile Towers: 12 (See the full list of FCC Registered Commercial Land Mobile Towers in San Angelo, TX)
FCC Registered Private Land Mobile Towers: 9 (See the full list of FCC Registered Private Land Mobile Towers)
FCC Registered Broadcast Land Mobile Towers: 70 (See the full list of FCC Registered Broadcast Land Mobile Towers)
FCC Registered Microwave Towers: 274 (See the full list of FCC Registered Microwave Towers in this town)
FCC Registered Paging Towers: 20 (See the full list of FCC Registered Paging Towers)
FCC Registered Maritime Coast & Aviation Ground Towers: 12 (See the full list of FCC Registered Maritime Coast & Aviation Ground Towers)
FCC Registered Amateur Radio Licenses: 614 (See the full list of FCC Registered Amateur Radio Licenses in San Angelo)
FAA Registered Aircraft Manufacturers and Dealers: 1 (See the full list of FAA Registered Manufacturers and Dealers in San Angelo)
FAA Registered Aircraft: 185 (See the full list of FAA Registered Aircraft)
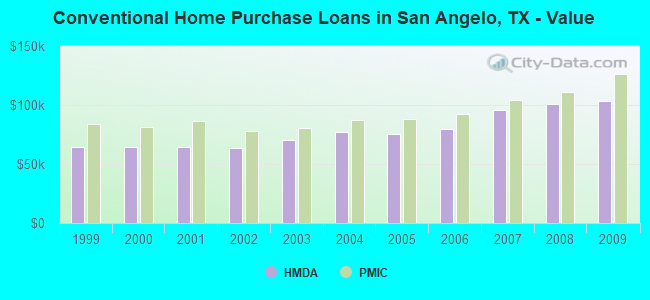
| Home Mortgage Disclosure Act Aggregated Statistics For Year 2009 (Based on 13 full and 6 partial tracts) | ||||||||||||||
| A) FHA, FSA/RHS & VA Home Purchase Loans | B) Conventional Home Purchase Loans | C) Refinancings | D) Home Improvement Loans | E) Loans on Dwellings For 5+ Families | F) Non-occupant Loans on < 5 Family Dwellings (A B C & D) | G) Loans On Manufactured Home Dwelling (A B C & D) | ||||||||
|---|---|---|---|---|---|---|---|---|---|---|---|---|---|---|
| Number | Average Value | Number | Average Value | Number | Average Value | Number | Average Value | Number | Average Value | Number | Average Value | Number | Average Value | |
| LOANS ORIGINATED | 419 | $118,633 | 284 | $103,053 | 566 | $104,282 | 120 | $38,435 | 2 | $2,469,895 | 180 | $61,167 | 1 | $27,570 |
| APPLICATIONS APPROVED, NOT ACCEPTED | 11 | $100,662 | 11 | $96,908 | 49 | $80,292 | 9 | $42,212 | 0 | $0 | 8 | $59,162 | 3 | $42,440 |
| APPLICATIONS DENIED | 40 | $97,775 | 56 | $73,382 | 327 | $81,645 | 114 | $29,017 | 1 | $396,000 | 35 | $61,511 | 6 | $62,302 |
| APPLICATIONS WITHDRAWN | 22 | $148,422 | 34 | $115,329 | 129 | $109,685 | 25 | $41,942 | 1 | $2,828,780 | 15 | $75,291 | 0 | $0 |
| FILES CLOSED FOR INCOMPLETENESS | 4 | $109,838 | 2 | $143,035 | 28 | $68,368 | 8 | $33,684 | 0 | $0 | 0 | $0 | 0 | $0 |
Detailed mortgage data for all 20 tracts in San Angelo, TX
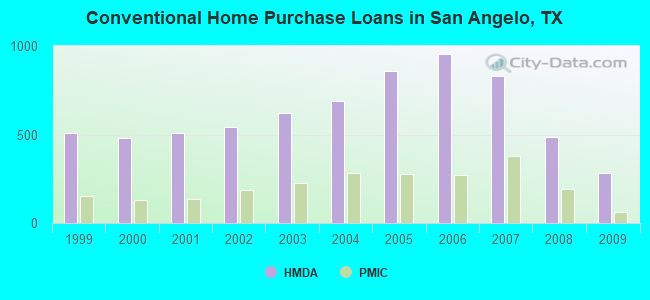
| Private Mortgage Insurance Companies Aggregated Statistics For Year 2009 (Based on 12 full and 6 partial tracts) | ||||||
| A) Conventional Home Purchase Loans | B) Refinancings | C) Non-occupant Loans on < 5 Family Dwellings (A & B) | ||||
|---|---|---|---|---|---|---|
| Number | Average Value | Number | Average Value | Number | Average Value | |
| LOANS ORIGINATED | 64 | $126,595 | 19 | $162,051 | 1 | $55,820 |
| APPLICATIONS APPROVED, NOT ACCEPTED | 6 | $116,022 | 9 | $134,769 | 0 | $0 |
| APPLICATIONS DENIED | 4 | $145,282 | 3 | $275,273 | 0 | $0 |
| APPLICATIONS WITHDRAWN | 4 | $121,988 | 0 | $0 | 0 | $0 |
| FILES CLOSED FOR INCOMPLETENESS | 2 | $181,080 | 0 | $0 | 0 | $0 |
2002 - 2018 National Fire Incident Reporting System (NFIRS) incidents
- Fire incident types reported to NFIRS in San Angelo, TX
- 3,14947.7%Outside Fires
- 2,24534.0%Structure Fires
- 87713.3%Mobile Property/Vehicle Fires
- 3244.9%Other
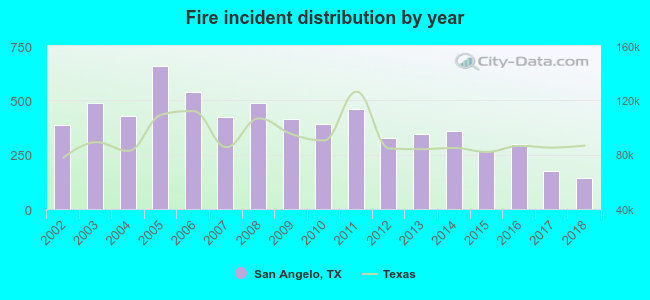 Based on the data from the years 2002 - 2018 the average number of fires per year is 388. The highest number of fire incidents - 659 took place in 2005, and the least - 142 in 2018. The data has a declining trend.
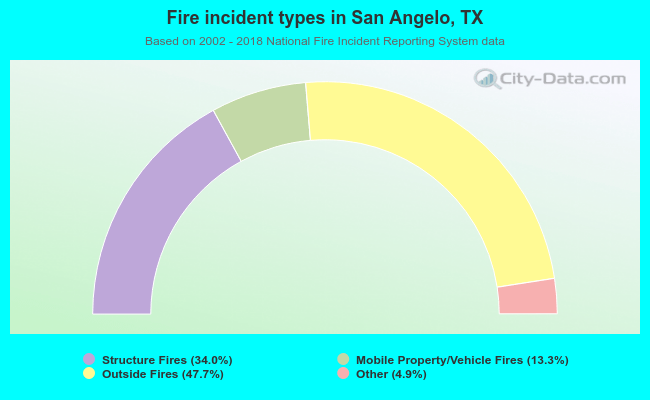 When looking into fire subcategories, the most reports belonged to: Outside Fires (47.7%), and Structure Fires (34.0%).
Fire-safe hotels and motels in San Angelo, Texas:
- San Angelo Inn & Radisson, 441 Rio Concho Dr, San Angelo, Texas 76903 , Phone: (325) 658-2828, Fax: (325) 658-8741
- Howard Johnson Inn San Angelo, 415 W Beauregard, San Angelo, Texas 76903 , Phone: (325) 653-2995, Fax: (325) 659-4393
- Inn Of The Conchos, 2021 N Bryant Blvd, San Angelo, Texas 76903 , Phone: (325) 658-2811, Fax: (325) 653-7560
- Knights Inn, 402 W Beauregard Ave, San Angelo, Texas 76903 , Phone: (325) 653-1351, Fax: (325) 659-2275
- Days Inn, 4613 S Jackson St, San Angelo, Texas 76903 , Phone: (325) 658-6594, Fax: (325) 658-6594
- Hampton Inn, 2959 Loop 306, San Angelo, Texas 76904 , Phone: (325) 942-9622
- Best Value Inn, 1601 S Bryant Blvd, San Angelo, Texas 76903 , Phone: (325) 653-1323, Fax: (325) 658-5769
- Clarion Inn & Suites, 333 Rio Concho, San Angelo, Texas 76903 , Phone: (325) 655-8000, Fax: (325) 655-8888
- 17 other hotels and motels
| Most common first names in San Angelo, TX among deceased individuals | ||
| Name | Count | Lived (average) |
|---|---|---|
| Mary | 582 | 79.1 years |
| William | 565 | 75.8 years |
| John | 530 | 75.1 years |
| James | 529 | 73.7 years |
| Robert | 386 | 72.5 years |
| Charles | 250 | 72.2 years |
| George | 231 | 74.8 years |
| Joe | 186 | 71.5 years |
| Thomas | 176 | 73.3 years |
| Ruth | 173 | 81.5 years |
| Most common last names in San Angelo, TX among deceased individuals | ||
| Last name | Count | Lived (average) |
|---|---|---|
| Smith | 362 | 76.1 years |
| Williams | 224 | 76.1 years |
| Jones | 222 | 75.8 years |
| Brown | 166 | 76.4 years |
| Davis | 161 | 77.2 years |
| Taylor | 140 | 76.9 years |
| Johnson | 140 | 76.5 years |
| Garcia | 124 | 70.4 years |
| Martinez | 119 | 67.3 years |
| White | 119 | 77.7 years |
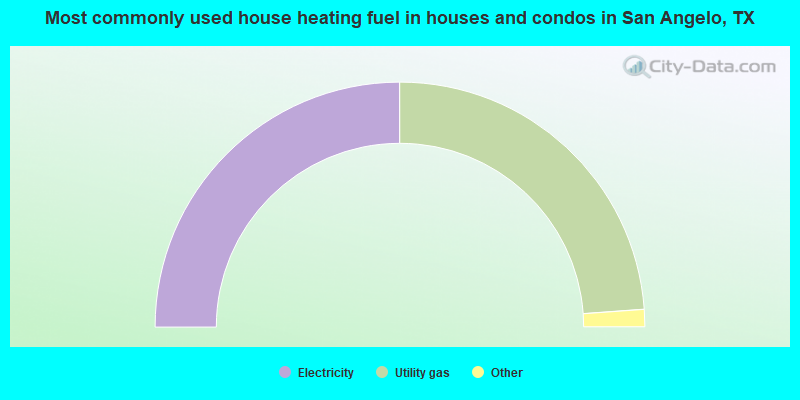
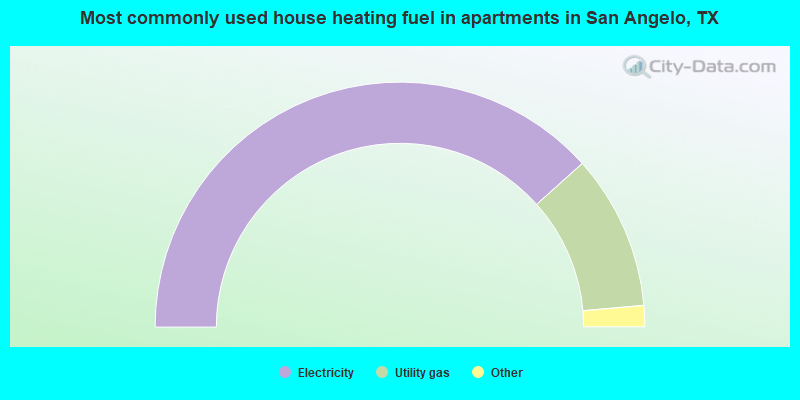
- 50.0%Electricity
- 47.8%Utility gas
- 1.9%Bottled, tank, or LP gas
- 0.2%Other fuel
- 76.8%Electricity
- 20.5%Utility gas
- 1.5%Bottled, tank, or LP gas
- 0.7%No fuel used
- 0.4%Other fuel
- 0.2%Solar energy
San Angelo compared to Texas state average:
- Unemployed percentage below state average.
- Black race population percentage significantly below state average.
- Foreign-born population percentage significantly below state average.
- House age above state average.
San Angelo on our top lists:
- #4 on the list of "Top 101 cities with the largest percentage of people in dormitories (population 1,000+)"
- #4 on the list of "Top 101 cities with the largest percentage of people in group homes (population 1,000+)"
- #4 on the list of "Top 101 cities with the largest percentage of people in hospitals/wards, hospices, and schools for the handicapped (population 1,000+)"
- #4 on the list of "Top 101 cities with the largest percentage of people in long-term care (population 1,000+)"
- #4 on the list of "Top 101 cities with the largest percentage of people in military quarters (population 1,000+)"
- #4 on the list of "Top 101 cities with the largest percentage of people in noninstitutionalized settings (population 1,000+)"
- #4 on the list of "Top 101 cities with the largest percentage of people in on base quarters (population 1,000+)"
- #4 on the list of "Top 101 cities with the largest percentage of people in schools, hospitals, or wards for the physically handicapped (population 1,000+)"
- #4 on the list of "Top 101 cities with largest percentage of males in industries: mining, quarrying, and oil and gas extraction (population 50,000+)"
- #7 on the list of "Top 100 high-educated but low-earning cities (pop. 50,000+)"
- #8 on the list of "Top 101 cities with largest percentage of males in occupations: law enforcement workers including supervisors (population 50,000+)"
- #14 on the list of "Top 101 cities with largest percentage of males in occupations: construction and extraction occupations (population 50,000+)"
- #14 on the list of "Top 101 cities with largest percentage of females in occupations: construction and extraction occupations (population 50,000+)"
- #19 on the list of "Top 101 cities with largest percentage of females in industries: mining, quarrying, and oil and gas extraction (population 50,000+)"
- #27 on the list of "Top 101 cities with largest percentage of females in occupations: farming, fishing, and forestry occupations (population 50,000+)"
- #27 on the list of "Top 101 cities with largest percentage of females in industries: agriculture, forestry, fishing and hunting (population 50,000+)"
- #31 on the list of "Top 101 cities with largest percentage of males in occupations: farming, fishing, and forestry occupations (population 50,000+)"
- #46 on the list of "Top 101 cities with largest percentage of workers with very short commute times (9 minutes or less) (population 50,000+)"
- #46 on the list of "Top 101 cities with the largest percentage of people in military transient quarters for temporary residents (population 1,000+)"
- #51 on the list of "Top 101 cities with largest percentage of females in industries: other services, except public administration (population 50,000+)"
- #36 on the list of "Top 101 counties with the highest percentage of residents relocating to foreign countries in 2011"
- #56 on the list of "Top 101 counties with highest percentage of residents voting for Romney (Republican) in the 2012 Presidential Election (pop. 50,000+)"
- #82 on the list of "Top 101 counties with the highest percentage of residents relocating from foreign countries between 2010 and 2011 (pop. 50,000+)"

|
|
Total of 51 patent applications in 2008-2024.