Estimated zip code population in 2022: 5,147 Zip code population in 2010: 4,993 Zip code population in 2000: 3,929
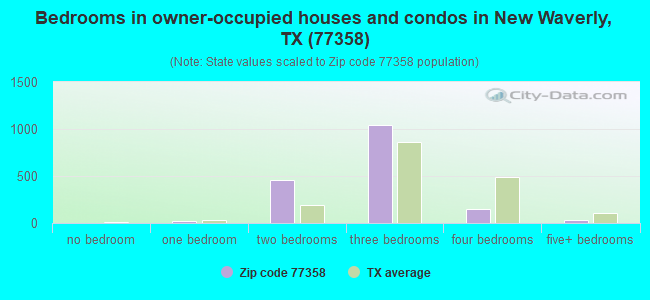
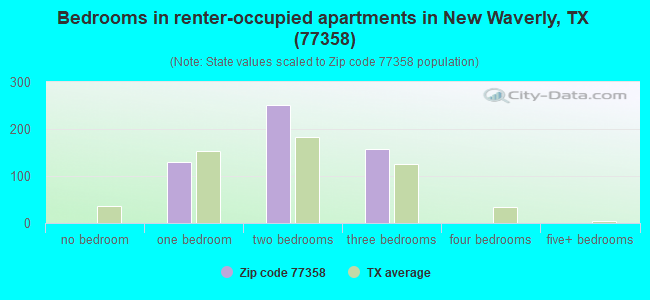
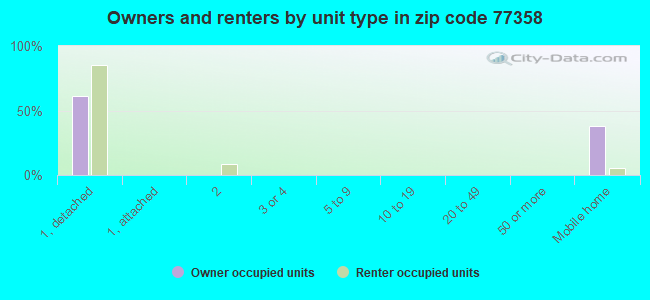
Houses and condos: 2,715 Renter-occupied apartments: 548
% of renters here:
24%
State:
38%
March 2022 cost of living index in zip code 77358: 79.2 (low, U.S. average is 100)
Land area: 123.8 sq. mi. Water area: 3.3 sq. mi.
Population density: 42 people per square mile
(very low).
OSM Map
General Map
Google Map
MSN Map
OSM Map
General Map
Google Map
MSN Map
OSM Map
General Map
Google Map
MSN Map
OSM Map
General Map
Google Map
MSN Map
Please wait while loading the map...
Real estate property taxes paid for housing units in 2022:
This zip code:
0.8% ($1,480)
Texas:
1.5% ($4,050)
Median real estate property taxes paid for housing units with mortgages in 2022: $2,395 (1.0%) Median real estate property taxes paid for housing units with no mortgage in 2022: $829 (0.9%)
Business Search- 14 Million verified businesses
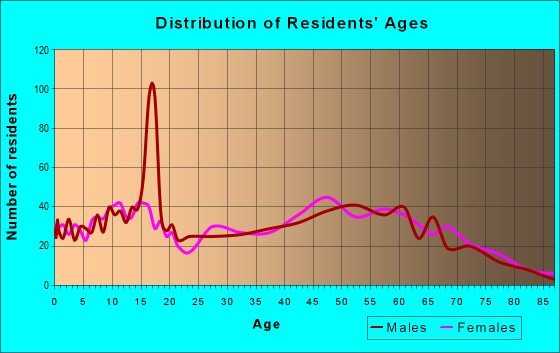
Males: 3,134
(60.9%)
Females: 2,013
(39.1%)
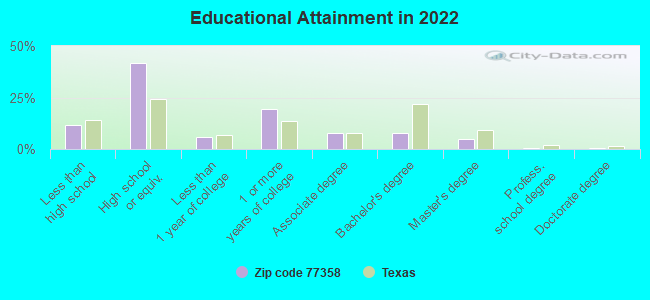
For population 25 years and over in 77358:
High school or higher: 86.8%
Bachelor's degree or higher: 13.2%
Graduate or professional degree: 5.6%
Unemployed: 2.3%
Mean travel time to work (commute): 37.2 minutes
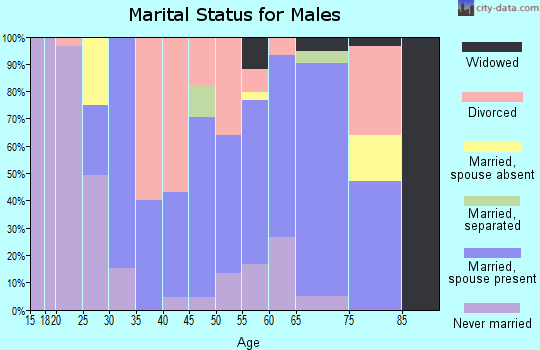
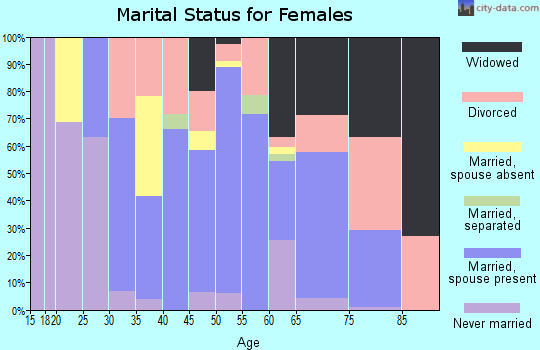
For population 15 years and over in 77358:
Never married: 27.7%
Now married: 54.3%
Separated: 2.5%
Widowed: 7.5%
Divorced: 8.1%
Zip code 77358 compared to state average:
Unemployed percentage below state average.
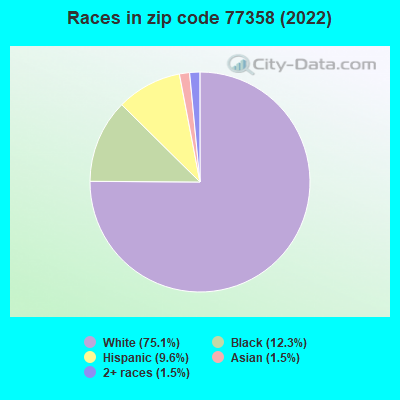
Hispanic race population percentage significantly below state average.
Median age significantly above state average.
Foreign-born population percentage significantly below state average.
Renting percentage below state average.
Length of stay since moving in significantly above state average.
Percentage of population with a bachelor's degree or higher below state average.
Averages for the 2020 tax year for zip code 77358, filed in 2021:
Average Adjusted Gross Income (AGI) in 2020: $66,222 (Individual Income Tax Returns)
Here:
$66,222
State:
$77,054
Salary/wage: $56,523 (reported on 79.6% of returns)
Here:
$56,523
State:
$62,766
(% of AGI for various income ranges: 1151.6% for AGIs below $25k, 3697.7% for AGIs $25k-50k, 6694.5% for AGIs $50k-75k, 8252.7% for AGIs $75k-100k, 15804.1% for AGIs $100k-200k, 72263.3% for AGIs over 200k)
Taxable interest for individuals: $1,250 (reported on 27.5% of returns)
This zip code:
$1,250
Texas:
$2,665
(% of AGI for various income ranges: 18.7% for AGIs below $25k, 10.2% for AGIs $25k-50k, 32.7% for AGIs $50k-75k, 80.7% for AGIs $75k-100k, 98.6% for AGIs $100k-200k, 843.3% for AGIs over 200k)
Ordinary dividends: $4,490 (reported on 12.9% of returns)
Here:
$4,490
State:
$10,044
(% of AGI for various income ranges: 13.9% for AGIs below $25k, 9.4% for AGIs $25k-50k, 71.8% for AGIs $50k-75k, 130.7% for AGIs $75k-100k, 192.7% for AGIs $100k-200k, 1616.7% for AGIs over 200k)
Net capital gain/loss in AGI: +$26,430 (reported on 13.8% of returns)
Here:
+$26,430
State:
+$39,590
(% of AGI for various income ranges: 9.5% for AGIs below $25k, 3.6% for AGIs $25k-50k, 31.4% for AGIs $50k-75k, 172.0% for AGIs $75k-100k, 1061.8% for AGIs $100k-200k, 19946.7% for AGIs over 200k)
Profit/loss from business: +$8,804 (reported on 22.9% of returns)
Here:
+$8,804
State:
+$10,888
(% of AGI for various income ranges: 191.1% for AGIs below $25k, 126.2% for AGIs $25k-50k, 242.7% for AGIs $50k-75k, 100.7% for AGIs $75k-100k, 745.0% for AGIs $100k-200k, 2530.0% for AGIs over 200k)
Taxable individual retirement arrangement distribution: $23,265 (reported on 8.3% of returns)
77358:
$23,265
Texas:
$24,740
(% of AGI for various income ranges: 46.6% for AGIs below $25k, 65.5% for AGIs $25k-50k, 244.5% for AGIs $50k-75k, 562.0% for AGIs $75k-100k, 1218.2% for AGIs $100k-200k)
Total itemized deductions: $39,544 (reported on 7.5% of returns)
Here:
$39,544
State:
$40,428
(% of AGI for various income ranges: 134.4% for AGIs below $25k, 513.2% for AGIs $50k-75k, 1118.6% for AGIs $100k-200k, 9026.7% for AGIs over 200k)
Charity contributions: $11,913 (reported on 6.2% of returns)
Here:
$11,913
State:
$18,201
(% of AGI for various income ranges: 19.3% for AGIs below $25k, 73.6% for AGIs $50k-75k, 380.0% for AGIs $100k-200k, 2236.7% for AGIs over 200k)
Taxes paid: $6,900 (reported on 7.5% of returns)
77358:
$6,900
State:
$7,821
(% of AGI for various income ranges: 30.0% for AGIs below $25k, 96.4% for AGIs $50k-75k, 201.4% for AGIs $100k-200k, 1346.7% for AGIs over 200k)
Earned income credit: $2,629 (reported on 18.8% of returns)
Here:
$2,629
State:
$2,584
(% of AGI for various income ranges: 126.4% for AGIs below $25k, 87.7% for AGIs $25k-50k)
Percentage of individuals using paid preparers for their 2020 taxes: 90.0%
Here:
90%
State:
92%
(% for various income ranges: 87.1% for AGIs below $25k, 91.5% for AGIs $25k-50k, 90.3% for AGIs $50k-75k, 90.0% for AGIs $75k-100k, 94.1% for AGIs $100k-200k, 90.9% for AGIs over 200k)
Averages for the 2012 tax year for zip code 77358, filed in 2013:
Average Adjusted Gross Income (AGI) in 2012: $49,722 (Individual Income Tax Returns)
Here:
$49,722
State:
$65,384
Salary/wage: $44,911 (reported on 82.0% of returns)
Here:
$44,911
State:
$52,524
(% of AGI for various income ranges: 76.3% for AGIs below $25k, 84.0% for AGIs $25k-50k, 77.7% for AGIs $50k-75k, 79.7% for AGIs $75k-100k, 76.8% for AGIs $100k-200k, 49.1% for AGIs over 200k)
Taxable interest for individuals: $1,456 (reported on 25.3% of returns)
This zip code:
$1,456
Texas:
$2,372
(% of AGI for various income ranges: 1.4% for AGIs below $25k, 0.6% for AGIs $25k-50k, 0.9% for AGIs $50k-75k, 0.8% for AGIs $75k-100k, 0.3% for AGIs $100k-200k, 1.0% for AGIs over 200k)
Ordinary dividends: $4,917 (reported on 11.1% of returns)
Here:
$4,917
State:
$9,721
(% of AGI for various income ranges: 1.1% for AGIs below $25k, 0.6% for AGIs $25k-50k, 0.7% for AGIs $50k-75k, 1.4% for AGIs $75k-100k, 0.4% for AGIs $100k-200k, 2.8% for AGIs over 200k)
Net capital gain/loss in AGI: +$6,627 (reported on 10.1% of returns)
Here:
+$6,627
State:
+$35,319
(% of AGI for various income ranges: 0.6% for AGIs $25k-50k, 0.5% for AGIs $75k-100k, 1.8% for AGIs $100k-200k, 4.8% for AGIs over 200k)
Profit/loss from business: +$7,911 (reported on 20.3% of returns)
Here:
+$7,911
State:
+$13,732
(% of AGI for various income ranges: 7.2% for AGIs below $25k, 2.9% for AGIs $25k-50k, 3.4% for AGIs $50k-75k, 2.9% for AGIs $75k-100k, 4.0% for AGIs $100k-200k)
Taxable individual retirement arrangement distribution: $19,835 (reported on 7.8% of returns)
77358:
$19,835
Texas:
$19,511
(% of AGI for various income ranges: 2.5% for AGIs below $25k, 2.1% for AGIs $25k-50k, 2.2% for AGIs $50k-75k, 2.2% for AGIs $75k-100k, 8.0% for AGIs $100k-200k)
Total itemized deductions: $23,023 (23% of AGI, reported on 19.8% of returns)
Here:
$23,023
State:
$24,724
Here:
22.5% of AGI
State:
15.9% of AGI
(% of AGI for various income ranges: 5.4% for AGIs below $25k, 7.3% for AGIs $25k-50k, 10.5% for AGIs $50k-75k, 11.8% for AGIs $75k-100k, 9.4% for AGIs $100k-200k, 9.5% for AGIs over 200k)
Charity contributions: $5,677 (reported on 14.3% of returns)
Here:
$5,677
State:
$6,808
(% of AGI for various income ranges: 0.3% for AGIs below $25k, 1.2% for AGIs $25k-50k, 1.7% for AGIs $50k-75k, 2.0% for AGIs $75k-100k, 1.7% for AGIs $100k-200k, 2.4% for AGIs over 200k)
Taxes paid: $4,879 (reported on 19.8% of returns)
77358:
$4,879
State:
$6,921
(% of AGI for various income ranges: 0.8% for AGIs below $25k, 1.1% for AGIs $25k-50k, 2.1% for AGIs $50k-75k, 2.3% for AGIs $75k-100k, 2.5% for AGIs $100k-200k, 2.3% for AGIs over 200k)
Earned income credit: $2,570 (reported on 23.0% of returns)
Here:
$2,570
State:
$2,570
(% of AGI for various income ranges: 9.0% for AGIs below $25k, 1.3% for AGIs $25k-50k)
Percentage of individuals using paid preparers for their 2012 taxes: 53.0%
Here:
53%
State:
51%
(% for various income ranges: 49.4% for AGIs below $25k, 50.0% for AGIs $25k-50k, 53.1% for AGIs $50k-75k, 63.2% for AGIs $75k-100k, 61.1% for AGIs $100k-200k, 80.0% for AGIs over 200k)
Averages for the 2004 tax year for zip code 77358, filed in 2005:
Average Adjusted Gross Income (AGI) in 2004: $35,406 (Individual Income Tax Returns)
Here:
$35,406
State:
$47,881
Salary/wage: $34,068 (reported on 84.5% of returns)
Here:
$34,068
State:
$41,947
(% of AGI for various income ranges: 152.2% for AGIs below $10k, 84.0% for AGIs $10k-25k, 85.8% for AGIs $25k-50k, 85.4% for AGIs $50k-75k, 84.6% for AGIs $75k-100k, 61.6% for AGIs over 100k)
Taxable interest for individuals: $1,322 (reported on 31.6% of returns)
This zip code:
$1,322
Texas:
$2,255
(% of AGI for various income ranges: 12.4% for AGIs below $10k, 2.2% for AGIs $10k-25k, 1.0% for AGIs $25k-50k, 0.4% for AGIs $50k-75k, 0.8% for AGIs $75k-100k, 0.9% for AGIs over 100k)
Taxable dividends: $1,434 (reported on 11.2% of returns)
Here:
$1,434
State:
$4,261
(% of AGI for various income ranges: 1.5% for AGIs below $10k, 0.3% for AGIs $10k-25k, 0.2% for AGIs $25k-50k, 0.4% for AGIs $50k-75k, 1.2% for AGIs $75k-100k, 0.4% for AGIs over 100k)
Net capital gain/loss: +$3,229 (reported on 11.3% of returns)
Here:
+$3,229
State:
+$16,110
(% of AGI for various income ranges: -1.5% for AGIs below $10k, 0.2% for AGIs $10k-25k, -0.1% for AGIs $25k-50k, 0.6% for AGIs $50k-75k, 0.7% for AGIs $75k-100k, 3.9% for AGIs over 100k)
Profit/loss from business: +$5,691 (reported on 18.5% of returns)
Here:
+$5,691
State:
+$11,013
(% of AGI for various income ranges: 17.7% for AGIs below $10k, 4.5% for AGIs $10k-25k, 3.1% for AGIs $25k-50k, 2.0% for AGIs $50k-75k, 1.6% for AGIs $75k-100k, 2.7% for AGIs over 100k)
IRA payment deduction: $1,895 (reported on 0.9% of returns)
77358:
$1,895
Texas:
$3,120
Total itemized deductions: $17,027 (22% of AGI, reported on 16.8% of returns)
Here:
$17,027
State:
$19,631
Here:
22.2% of AGI
State:
18.9% of AGI
(% of AGI for various income ranges: 8.7% for AGIs below $10k, 5.3% for AGIs $10k-25k, 7.6% for AGIs $25k-50k, 7.2% for AGIs $50k-75k, 10.2% for AGIs $75k-100k, 10.0% for AGIs over 100k)
Charity contributions deductions: $4,536 (5% of AGI, reported on 12.4% of returns)
Here:
$4,536
State:
$4,753
Here:
5.5% of AGI
State:
4.2% of AGI
(% of AGI for various income ranges: 0.9% for AGIs $10k-25k, 1.3% for AGIs $25k-50k, 1.4% for AGIs $50k-75k, 1.9% for AGIs $75k-100k, 2.5% for AGIs over 100k)
Total tax: $5,212 (reported on 66.9% of returns)
77358:
$5,212
State:
$9,058
(% of AGI for various income ranges: 5.0% for AGIs below $10k, 3.3% for AGIs $10k-25k, 6.4% for AGIs $25k-50k, 9.0% for AGIs $50k-75k, 10.8% for AGIs $75k-100k, 19.3% for AGIs over 100k)
Earned income credit: $1,927 (reported on 25.9% of returns)
Here:
$1,927
State:
$2,024
Percentage of individuals using paid preparers for their 2004 taxes: 58.2%
Here:
58%
State:
57%
(% for various income ranges: 54.0% for AGIs below $10k, 57.6% for AGIs $10k-25k, 59.3% for AGIs $25k-50k, 57.4% for AGIs $50k-75k, 63.6% for AGIs $75k-100k, 73.5% for AGIs over 100k)
Household received Food Stamps/SNAP in the past 12 months: 290 Household did not receive Food Stamps/SNAP in the past 12 months: 1,973
Women who had a birth in the past 12 months: 180 (144 now married, 37 unmarried) Women who did not have a birth in the past 12 months: 624 (364 now married, 257 unmarried)
Housing units in zip code 77358 with a mortgage: 910 (16 second mortgage) Houses without a mortgage: 39
Median monthly owner costs for units with a mortgage: $1,364 Median monthly owner costs for units without a mortgage: $387
Residents with income below the poverty level in 2022:
This zip code:
11.0%
Whole state:
14.0%
Residents with income below 50% of the poverty level in 2022:
This zip code:
6.3%
Whole state:
7.4%
Median number of rooms in houses and condos:
Here:
5.3
State:
6.3
Median number of rooms in apartments:
Here:
4.3
State:
4.0
Notable locations in this zip code not listed on our city pages
Notable locations in zip code 77358: Hayman Ranch (A), Lost Meadows Ranch (B), Moores Grove Lookout (C), Stewart Ranch (D), Stubblefield Recreation Site (E), Cagle Recreation Site (F), East Sandy (G), New Waverly Volunteer Fire Department (H), Punkin - Evergreen Volunteer Fire Department (I), Raven District Ranger Station (J), Old Folks Home (K). Display/hide their locations on the map
Churches in zip code 77358 include: Pleasant Grove Missionary Church (A), New Hope Church (B), Old Waverly Church (C), Pine Valley Church (D), Pleasant Grove Church (E). Display/hide their locations on the map
Cemeteries: Hardy Cemetery (1), Hargrove Cemetery (2), Jasper Cemetery (3), Hill Cemetery (4), Scott Cemetery (5), Lewis Cemetery (6), Old Waverly Cemetery (7). Display/hide their locations on the map
Lakes and reservoirs: Stewart Lake (A), Pursley Lake (B), Lost Meadows Lake (C), Plum Lake (D), Lake Raven (E), Jib Lake (F), Huntsville State Park Lake (G). Display/hide their locations on the map
Streams, rivers, and creeks: Brown Branch (A), Sand Creek (B), Pumpkin Creek (C), Prairie Branch (D), Plum Creek (E), Persimmon Creek (F), Pea Creek (G), Hopkins Branch (H), Fivemile Branch (I). Display/hide their locations on the map
In group quarters: 99 (-1 institutionalized population)
Size of family households: 708 2-persons, 433 3-persons, 210 4-persons, 144 5-persons, 5 6-persons, 9 7-or-more-persons
Size of nonfamily households: 752 1-person, 3 2-persons
485 married couples with children.
194 single-parent households (53 men, 141 women).
92.5% of residents of 77358 zip code speak English at home.
6.6% of residents speak Spanish at home (63% very well, 37% well).
0.6% of residents speak other Indo-European language at home (100% very well).
0.2% of residents speak Asian or Pacific Island language at home (100% very well).
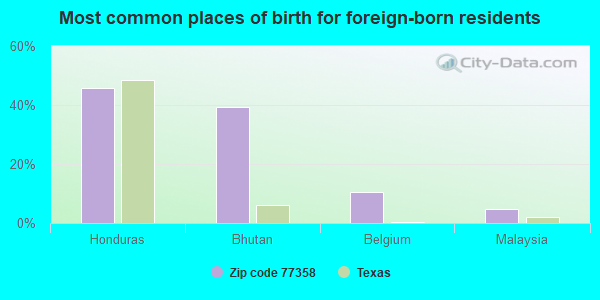
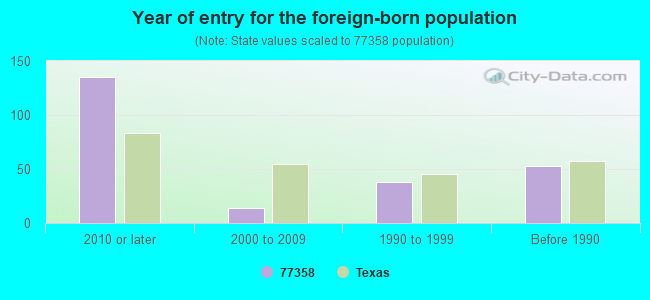
Foreign born population: 219 (4.3%) (47.7% of them are naturalized citizens)
This zip code:
4.3%
Whole state:
17.2%
46%Honduras
39%Bhutan
11%Belgium
5%Malaysia
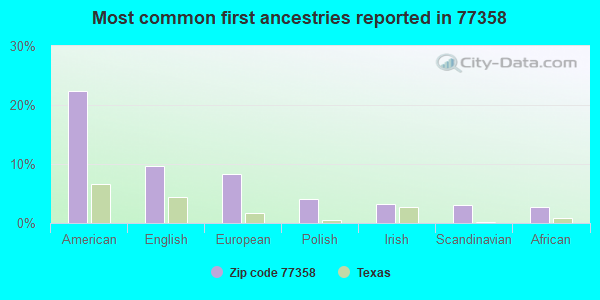
22%American
10%English
8%European
4%Polish
3%Irish
3%Scandinavian
3%African
Year of entry for the foreign-born population
1352010 or later
142000 to 2009
381990 to 1999
53Before 1990
Housing units lacking complete plumbing facilities: 8.3% Housing units lacking complete kitchen facilities: 9.9%
78.8%Electricity
13.4%Bottled, tank, or LP gas
7.1%Utility gas
0.8%Wood
Population in 1990: 1,977. Population change in the 1990s: +1,952 (+98.7%).
Place of birth for U.S.-born residents:
This state: 3,396
Northeast: 99
Midwest: 612
South: 626
West: 162
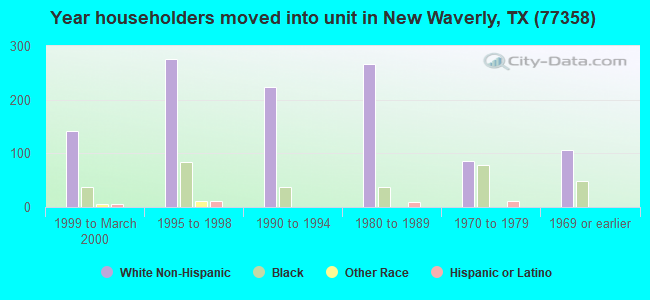
62% of the 77358 zip code residents lived in the same house 5 years ago. Out of people who lived in different houses, 23% lived in this county. Out of people who lived in different counties, 50% lived in Texas.
92% of the 77358 zip code residents lived in the same house 1 year ago. Out of people who lived in different houses, 16% moved from this county. Out of people who lived in different houses, 69% moved from different county within same state. Out of people who lived in different houses, 20% moved from different state.
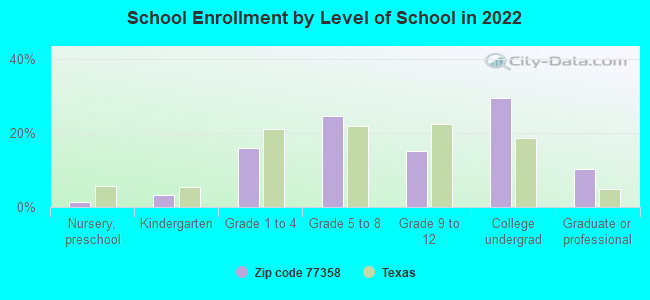
Private vs. public school enrollment:
Students in private schools in grades 1 to 8 (elementary and middle school): 72
Here:
15.1%
Texas:
8.8%
Students in private schools in grades 9 to 12 (high school):
Here:
0.0%
Texas:
8.0%
Students in private undergraduate colleges:
Here:
0.0%
Texas:
16.2%
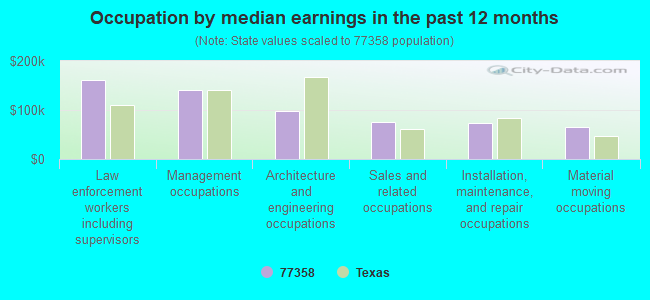
Occupation by median earnings in the past 12 months ($)
160,278Law enforcement workers including supervisors
141,467Management occupations
98,888Architecture and engineering occupations
74,708Sales and related occupations
72,718Installation, maintenance, and repair occupations
64,768Material moving occupations
Top industries in this zip code by the number of employees in 2005:
Educational Services: Other Technical and Trade Schools (250-499 employees: 1 establishment)
Accommodation and Food Services: Full-Service Restaurants (20-49: 1, 10-19: 1)
Other Services (except Public Administration): Religious Organizations (10-19: 2, 1-4: 4)
Administrative and Support and Waste Management and Remediation Services: Office Administrative Services (20-49: 1)
People in group quarters in 2010:
129 people in correctional facilities intended for juveniles
People in group quarters in 2000:
141 people in other group homes
Fatal accident statistics in 2014:
Fatal accident count: 3
Vehicles involved in fatal accidents: 4
Fatal accidents caused by drunken drivers: 2
Fatalities: 5
Persons involved in fatal accidents: 6
Pedestrians involved in fatal accidents: 0
Fatal accident statistics in 2013:
Fatal accident count: 2
Vehicles involved in fatal accidents: 3
Fatal accidents caused by drunken drivers: 1
Fatalities: 3
Persons involved in fatal accidents: 5
Pedestrians involved in fatal accidents: 0
2003 - 2018 National Fire Incident Reporting System (NFIRS) incidents
According to the data from the years 2003 - 2018 the average number of fires per year is 58. The highest number of fire incidents - 140 took place in 2011, and the least - 4 in 2003. The data has a growing trend.
When looking into fire subcategories, the most reports belonged to: Outside Fires (58.4%), and Structure Fires (21.1%).
Fire incident types reported to NFIRS in Zip Code 77358
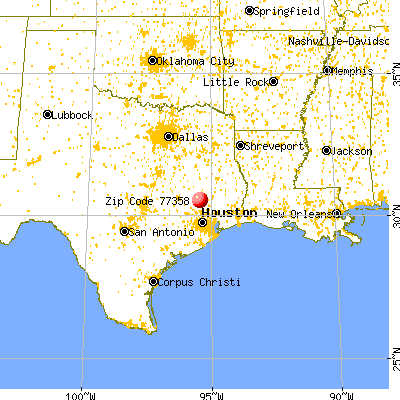


 Nearest zip codes: 77378, 77340, 77318, 77303, 77342, 77334.


 According to the data from the years 2003 - 2018 the average number of fires per year is 58. The highest number of fire incidents - 140 took place in 2011, and the least - 4 in 2003. The data has a growing trend.
 When looking into fire subcategories, the most reports belonged to: Outside Fires (58.4%), and Structure Fires (21.1%).