Estimated zip code population in 2022: 93,230 Zip code population in 2010: 72,264 Zip code population in 2000: 42,383
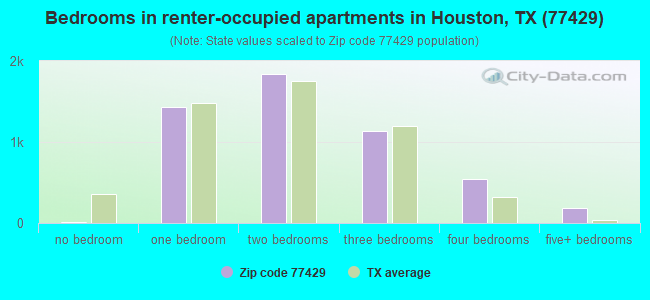
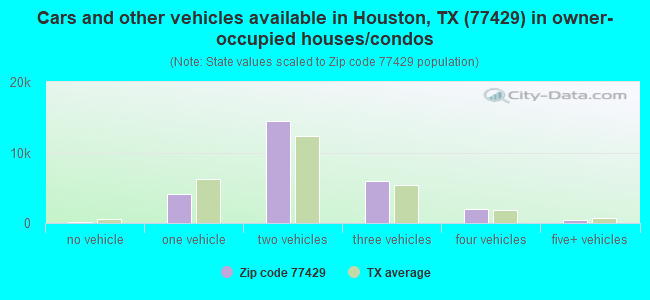
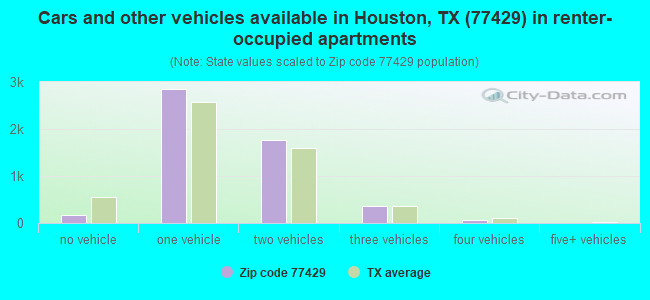
Houses and condos: 33,085 Renter-occupied apartments: 5,224
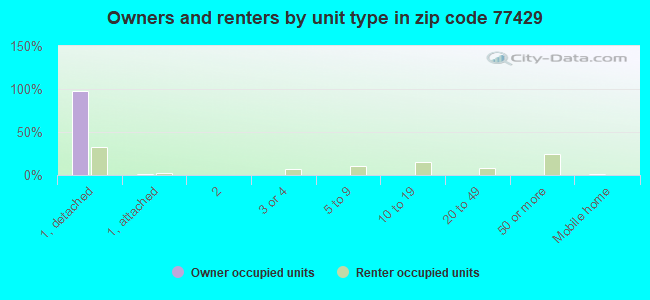
% of renters here:
16%
State:
38%
March 2022 cost of living index in zip code 77429: 96.7 (near average, U.S. average is 100)
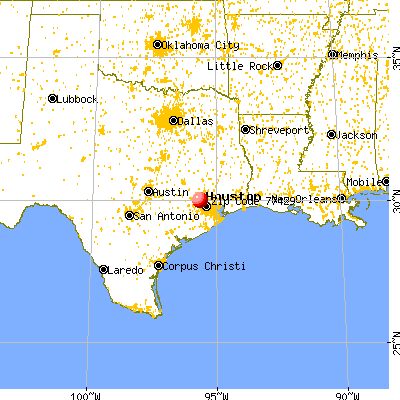
Land area: 38.4 sq. mi. Water area: 0.5 sq. mi.
Population density: 2,427 people per square mile
(low).
OSM Map
General Map
Google Map
MSN Map
OSM Map
General Map
Google Map
MSN Map
OSM Map
General Map
Google Map
MSN Map
OSM Map
General Map
Google Map
MSN Map
Please wait while loading the map...
Real estate property taxes paid for housing units in 2022:
This zip code:
1.7% ($6,381)
Texas:
1.5% ($4,050)
Median real estate property taxes paid for housing units with mortgages in 2022: $6,902 (1.8%) Median real estate property taxes paid for housing units with no mortgage in 2022: $5,017 (1.4%)
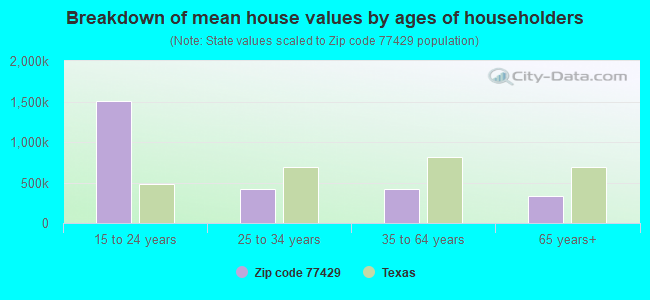
Estimated median house/condo value in 2022: $371,559
77429:
$371,559
Texas:
$275,400
According to our research of Texas and other state lists, there were 68 registered sex offenders living in 77429 zip code as of April 27, 2024. The ratio of all residents to sex offenders in zip code 77429 is 1,228 to 1. The ratio of registered sex offenders to all residents in this zip code is much lower than the state average.
Median resident age:
This zip code:
37.7 years
Texas median age:
35.6 years
Average household size:
This zip code:
2.9 people
Texas:
2.6 people
Averages for the 2020 tax year for zip code 77429, filed in 2021:
Average Adjusted Gross Income (AGI) in 2020: $104,721 (Individual Income Tax Returns)
Here:
$104,721
State:
$77,054
Salary/wage: $89,581 (reported on 85.2% of returns)
Here:
$89,581
State:
$62,766
(% of AGI for various income ranges: 1141.2% for AGIs below $25k, 3522.6% for AGIs $25k-50k, 6558.9% for AGIs $50k-75k, 9501.1% for AGIs $75k-100k, 18399.1% for AGIs $100k-200k, 73721.8% for AGIs over 200k)
Taxable interest for individuals: $2,256 (reported on 28.8% of returns)
This zip code:
$2,256
Texas:
$2,665
(% of AGI for various income ranges: 13.1% for AGIs below $25k, 22.0% for AGIs $25k-50k, 25.0% for AGIs $50k-75k, 49.9% for AGIs $75k-100k, 86.6% for AGIs $100k-200k, 1007.6% for AGIs over 200k)
Ordinary dividends: $7,190 (reported on 23.6% of returns)
Here:
$7,190
State:
$10,044
(% of AGI for various income ranges: 22.1% for AGIs below $25k, 50.2% for AGIs $25k-50k, 77.2% for AGIs $50k-75k, 132.7% for AGIs $75k-100k, 246.7% for AGIs $100k-200k, 2611.1% for AGIs over 200k)
Net capital gain/loss in AGI: +$29,872 (reported on 22.4% of returns)
Here:
+$29,872
State:
+$39,590
(% of AGI for various income ranges: 11.5% for AGIs below $25k, 32.2% for AGIs $25k-50k, 57.7% for AGIs $50k-75k, 157.0% for AGIs $75k-100k, 337.4% for AGIs $100k-200k, 14654.3% for AGIs over 200k)
Profit/loss from business: +$12,858 (reported on 22.6% of returns)
Here:
+$12,858
State:
+$10,888
(% of AGI for various income ranges: 120.5% for AGIs below $25k, 167.7% for AGIs $25k-50k, 215.0% for AGIs $50k-75k, 278.6% for AGIs $75k-100k, 507.9% for AGIs $100k-200k, 3197.6% for AGIs over 200k)
Taxable individual retirement arrangement distribution: $31,027 (reported on 8.1% of returns)
77429:
$31,027
Texas:
$24,740
(% of AGI for various income ranges: 41.3% for AGIs below $25k, 89.8% for AGIs $25k-50k, 205.2% for AGIs $50k-75k, 313.3% for AGIs $75k-100k, 689.7% for AGIs $100k-200k, 2202.8% for AGIs over 200k)
Self-employed (Keogh) retirement plans: $27,446 (reported on 0.6% of returns)
77429:
$27,446
Texas:
$29,298
(% of AGI for various income ranges: 8.7% for AGIs $50k-75k, 19.1% for AGIs $100k-200k, 304.9% for AGIs over 200k)
Total itemized deductions: $37,817 (reported on 11.4% of returns)
Here:
$37,817
State:
$40,428
(% of AGI for various income ranges: 52.2% for AGIs below $25k, 152.6% for AGIs $25k-50k, 415.4% for AGIs $50k-75k, 525.0% for AGIs $75k-100k, 847.8% for AGIs $100k-200k, 5002.0% for AGIs over 200k)
Charity contributions: $16,883 (reported on 9.5% of returns)
Here:
$16,883
State:
$18,201
(% of AGI for various income ranges: 5.3% for AGIs below $25k, 23.4% for AGIs $25k-50k, 65.9% for AGIs $50k-75k, 120.6% for AGIs $75k-100k, 252.8% for AGIs $100k-200k, 2583.9% for AGIs over 200k)
Taxes paid: $8,185 (reported on 11.1% of returns)
77429:
$8,185
State:
$7,821
(% of AGI for various income ranges: 10.0% for AGIs below $25k, 37.2% for AGIs $25k-50k, 99.3% for AGIs $50k-75k, 134.9% for AGIs $75k-100k, 212.5% for AGIs $100k-200k, 842.0% for AGIs over 200k)
Earned income credit: $2,380 (reported on 12.4% of returns)
Here:
$2,380
State:
$2,584
(% of AGI for various income ranges: 90.6% for AGIs below $25k, 79.5% for AGIs $25k-50k, 1.7% for AGIs $50k-75k)
Percentage of individuals using paid preparers for their 2020 taxes: 92.4%
Here:
92%
State:
92%
(% for various income ranges: 90.7% for AGIs below $25k, 93.1% for AGIs $25k-50k, 93.1% for AGIs $50k-75k, 93.0% for AGIs $75k-100k, 93.2% for AGIs $100k-200k, 92.5% for AGIs over 200k)
Averages for the 2012 tax year for zip code 77429, filed in 2013:
Average Adjusted Gross Income (AGI) in 2012: $105,875 (Individual Income Tax Returns)
Here:
$105,875
State:
$65,384
Salary/wage: $88,171 (reported on 89.1% of returns)
Here:
$88,171
State:
$52,524
(% of AGI for various income ranges: 79.0% for AGIs below $25k, 85.0% for AGIs $25k-50k, 85.2% for AGIs $50k-75k, 84.9% for AGIs $75k-100k, 85.9% for AGIs $100k-200k, 61.7% for AGIs over 200k)
Taxable interest for individuals: $1,628 (reported on 35.3% of returns)
This zip code:
$1,628
Texas:
$2,372
(% of AGI for various income ranges: 1.1% for AGIs below $25k, 0.4% for AGIs $25k-50k, 0.5% for AGIs $50k-75k, 0.4% for AGIs $75k-100k, 0.4% for AGIs $100k-200k, 0.7% for AGIs over 200k)
Ordinary dividends: $7,999 (reported on 24.0% of returns)
Here:
$7,999
State:
$9,721
(% of AGI for various income ranges: 1.9% for AGIs below $25k, 0.8% for AGIs $25k-50k, 0.8% for AGIs $50k-75k, 0.8% for AGIs $75k-100k, 0.9% for AGIs $100k-200k, 2.8% for AGIs over 200k)
Net capital gain/loss in AGI: +$34,711 (reported on 19.8% of returns)
Here:
+$34,711
State:
+$35,319
(% of AGI for various income ranges: 0.2% for AGIs below $25k, 0.2% for AGIs $25k-50k, 0.4% for AGIs $50k-75k, 0.3% for AGIs $75k-100k, 0.7% for AGIs $100k-200k, 13.3% for AGIs over 200k)
Profit/loss from business: +$19,444 (reported on 19.2% of returns)
Here:
+$19,444
State:
+$13,732
(% of AGI for various income ranges: 10.4% for AGIs below $25k, 5.1% for AGIs $25k-50k, 3.0% for AGIs $50k-75k, 3.4% for AGIs $75k-100k, 3.2% for AGIs $100k-200k, 3.2% for AGIs over 200k)
Taxable individual retirement arrangement distribution: $22,791 (reported on 8.2% of returns)
77429:
$22,791
Texas:
$19,511
(% of AGI for various income ranges: 2.7% for AGIs below $25k, 2.0% for AGIs $25k-50k, 2.2% for AGIs $50k-75k, 2.3% for AGIs $75k-100k, 2.3% for AGIs $100k-200k, 1.2% for AGIs over 200k)
Self-employment retirement plans: $21,669 (reported on 1.0% of returns)
77429:
$21,669
Texas:
$23,938
(% of AGI for various income ranges: 0.2% for AGIs $50k-75k, 0.2% for AGIs $100k-200k, 0.3% for AGIs over 200k)
Total itemized deductions: $23,148 (13% of AGI, reported on 44.2% of returns)
Here:
$23,148
State:
$24,724
Here:
12.9% of AGI
State:
15.9% of AGI
(% of AGI for various income ranges: 10.4% for AGIs below $25k, 11.8% for AGIs $25k-50k, 14.2% for AGIs $50k-75k, 12.9% for AGIs $75k-100k, 11.9% for AGIs $100k-200k, 6.6% for AGIs over 200k)
Charity contributions: $5,620 (reported on 36.0% of returns)
Here:
$5,620
State:
$6,808
(% of AGI for various income ranges: 0.8% for AGIs below $25k, 1.3% for AGIs $25k-50k, 1.6% for AGIs $50k-75k, 1.8% for AGIs $75k-100k, 2.1% for AGIs $100k-200k, 2.0% for AGIs over 200k)
Taxes paid: $7,527 (reported on 43.6% of returns)
77429:
$7,527
State:
$6,921
(% of AGI for various income ranges: 2.3% for AGIs below $25k, 3.4% for AGIs $25k-50k, 3.9% for AGIs $50k-75k, 3.9% for AGIs $75k-100k, 4.0% for AGIs $100k-200k, 2.3% for AGIs over 200k)
Earned income credit: $2,216 (reported on 10.7% of returns)
Here:
$2,216
State:
$2,570
(% of AGI for various income ranges: 5.7% for AGIs below $25k, 1.1% for AGIs $25k-50k)
Percentage of individuals using paid preparers for their 2012 taxes: 42.8%
Here:
43%
State:
51%
(% for various income ranges: 39.4% for AGIs below $25k, 41.7% for AGIs $25k-50k, 42.2% for AGIs $50k-75k, 40.7% for AGIs $75k-100k, 42.6% for AGIs $100k-200k, 56.7% for AGIs over 200k)
Averages for the 2004 tax year for zip code 77429, filed in 2005:
Average Adjusted Gross Income (AGI) in 2004: $81,474 (Individual Income Tax Returns)
Here:
$81,474
State:
$47,881
Salary/wage: $76,143 (reported on 89.6% of returns)
Here:
$76,143
State:
$41,947
(% of AGI for various income ranges: 337.0% for AGIs below $10k, 81.6% for AGIs $10k-25k, 85.9% for AGIs $25k-50k, 86.5% for AGIs $50k-75k, 90.0% for AGIs $75k-100k, 80.7% for AGIs over 100k)
Taxable interest for individuals: $1,363 (reported on 50.4% of returns)
This zip code:
$1,363
Texas:
$2,255
(% of AGI for various income ranges: 13.4% for AGIs below $10k, 2.0% for AGIs $10k-25k, 1.1% for AGIs $25k-50k, 0.8% for AGIs $50k-75k, 0.6% for AGIs $75k-100k, 0.8% for AGIs over 100k)
Taxable dividends: $2,309 (reported on 31.7% of returns)
Here:
$2,309
State:
$4,261
(% of AGI for various income ranges: 13.9% for AGIs below $10k, 1.3% for AGIs $10k-25k, 0.9% for AGIs $25k-50k, 0.7% for AGIs $50k-75k, 0.7% for AGIs $75k-100k, 0.9% for AGIs over 100k)
Net capital gain/loss: +$11,035 (reported on 27.7% of returns)
Here:
+$11,035
State:
+$16,110
(% of AGI for various income ranges: -5.1% for AGIs below $10k, 0.8% for AGIs $10k-25k, 0.4% for AGIs $25k-50k, 0.5% for AGIs $50k-75k, 0.5% for AGIs $75k-100k, 5.6% for AGIs over 100k)
Profit/loss from business: +$15,765 (reported on 19.6% of returns)
Here:
+$15,765
State:
+$11,013
(% of AGI for various income ranges: 32.7% for AGIs below $10k, 8.2% for AGIs $10k-25k, 4.1% for AGIs $25k-50k, 3.6% for AGIs $50k-75k, 2.8% for AGIs $75k-100k, 3.7% for AGIs over 100k)
IRA payment deduction: $3,418 (reported on 3.3% of returns)
77429:
$3,418
Texas:
$3,120
(% of AGI for various income ranges: 0.7% for AGIs below $10k, 0.2% for AGIs $10k-25k, 0.3% for AGIs $25k-50k, 0.2% for AGIs $50k-75k, 0.2% for AGIs $75k-100k, 0.1% for AGIs over 100k)
Self-employed pension: $15,228 (reported on 1.3% of returns)
Here:
$15,228
Texas:
$16,401
(% of AGI for various income ranges: 0.1% for AGIs $25k-50k, 0.1% for AGIs $50k-75k, 0.1% for AGIs $75k-100k, 0.3% for AGIs over 100k)
Total itemized deductions: $20,594 (17% of AGI, reported on 51.7% of returns)
Here:
$20,594
State:
$19,631
Here:
17.2% of AGI
State:
18.9% of AGI
(% of AGI for various income ranges: 39.7% for AGIs below $10k, 11.8% for AGIs $10k-25k, 15.2% for AGIs $25k-50k, 16.8% for AGIs $50k-75k, 16.5% for AGIs $75k-100k, 11.4% for AGIs over 100k)
Charity contributions deductions: $4,093 (3% of AGI, reported on 44.8% of returns)
Here:
$4,093
State:
$4,753
Here:
3.2% of AGI
State:
4.2% of AGI
(% of AGI for various income ranges: 2.0% for AGIs below $10k, 1.1% for AGIs $10k-25k, 1.6% for AGIs $25k-50k, 2.2% for AGIs $50k-75k, 2.3% for AGIs $75k-100k, 2.4% for AGIs over 100k)
Total tax: $15,059 (reported on 82.9% of returns)
77429:
$15,059
State:
$9,058
(% of AGI for various income ranges: 10.9% for AGIs below $10k, 4.9% for AGIs $10k-25k, 6.8% for AGIs $25k-50k, 8.7% for AGIs $50k-75k, 10.0% for AGIs $75k-100k, 19.0% for AGIs over 100k)
Earned income credit: $1,732 (reported on 7.1% of returns)
Here:
$1,732
State:
$2,024
Percentage of individuals using paid preparers for their 2004 taxes: 43.7%
Here:
44%
State:
57%
(% for various income ranges: 36.2% for AGIs below $10k, 46.7% for AGIs $10k-25k, 46.5% for AGIs $25k-50k, 44.3% for AGIs $50k-75k, 41.1% for AGIs $75k-100k, 46.1% for AGIs over 100k)
Likely homosexual households (counted as self-reported same-sex unmarried-partner households)
Lesbian couples: 0.1% of all households
Gay men: 0.1% of all households
Household received Food Stamps/SNAP in the past 12 months: 1,191 Household did not receive Food Stamps/SNAP in the past 12 months: 31,083
Women who had a birth in the past 12 months: 1,133 (1,017 now married, 128 unmarried) Women who did not have a birth in the past 12 months: 21,156 (11,565 now married, 9,519 unmarried)
Housing units in zip code 77429 with a mortgage: 18,961 (1,029 second mortgage, 19 home equity loan, 748 both second mortgage and home equity loan) Houses without a mortgage: 759
Median monthly owner costs for units with a mortgage: $2,298 Median monthly owner costs for units without a mortgage: $879
Residents with income below the poverty level in 2022:
This zip code:
3.8%
Whole state:
14.0%
Residents with income below 50% of the poverty level in 2022:
This zip code:
1.8%
Whole state:
7.4%
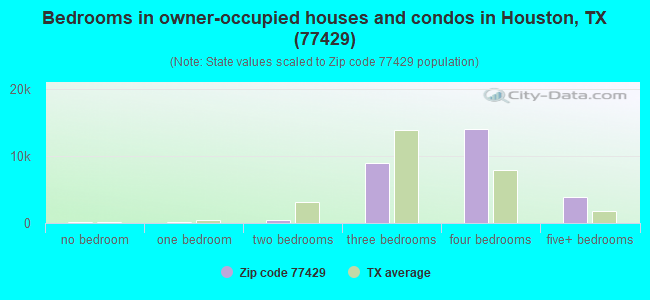
Median number of rooms in houses and condos:
Here:
7.8
State:
6.3
Median number of rooms in apartments:
Here:
4.4
State:
4.0
Notable locations in this zip code not listed on our city pages
Notable locations in zip code 77429: Letter M Ranch (A), Cypress Creek Volunteer Fire Department Station 22 (B), Cy - Fair Volunteer Fire Department Station 3 (C), Cy - Fair Volunteer Fire Department Station 4 (D), Cy-Fair Volunteer Fire Station 3 (E). Display/hide their locations on the map
Churches in zip code 77429 include: Cy Fair Baptist Church (A), Saint John Church (B), Trinity Church (C), Windwood Church (D), Christ the Redeemer Catholic Church (E), Cypress Mill Baptist Church (F), Cypress Pointe Baptist Church (G), Metropolitan Baptist Church (H), Saint Marys Episcopal Church (I). Display/hide their locations on the map
Cemeteries: Knigge Cemetery (1), Roeder Cemetery (2), Fritsche Cemetery (3), Meyer Cemetery (4), Dowdell Cemetery (5), Muller Cemetery (6). Display/hide their locations on the map
Parks in zip code 77429 include: Grant Woods Park (1), Cy-Fair High School Football Stadium and Track (2), Cy-Fair High School Baseball Field (3), Dyess County Park (4). Display/hide their locations on the map
20,618 married couples with children.
4,047 single-parent households (1,483 men, 2,564 women).
73.2% of residents of 77429 zip code speak English at home.
14.2% of residents speak Spanish at home (70% very well, 18% well, 9% not well, 3% not at all).
5.8% of residents speak other Indo-European language at home (89% very well, 7% well, 3% not well).
6.1% of residents speak Asian or Pacific Island language at home (64% very well, 26% well, 8% not well, 3% not at all).
0.8% of residents speak other language at home (75% very well, 16% well, 9% not well).
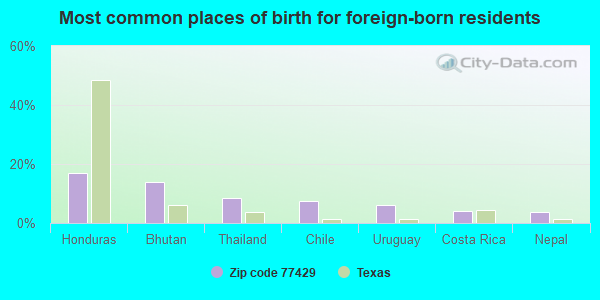
Foreign born population: 15,235 (16.3%) (57.5% of them are naturalized citizens)
This zip code:
16.3%
Whole state:
17.2%
17%Honduras
14%Bhutan
8%Thailand
7%Chile
6%Uruguay
4%Costa Rica
4%Nepal
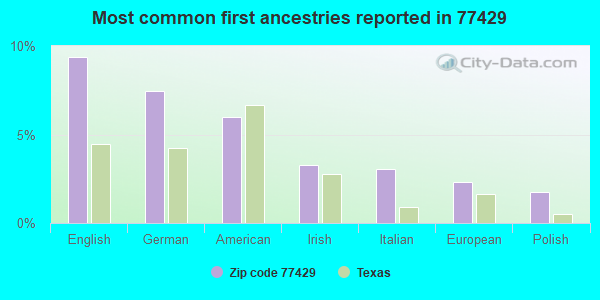
9%English
7%German
6%American
3%Irish
3%Italian
2%European
2%Polish
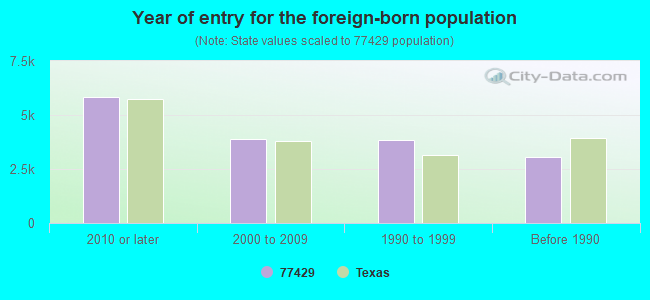
Year of entry for the foreign-born population
5,8282010 or later
3,8842000 to 2009
3,8321990 to 1999
3,062Before 1990
Public high schools in in zip code 77429 not listed on the city page:
CY-FAIR HIGH SCHOOL(Students: 3,194, Location: 22602 HEMPSTEAD HWY, Grades: 9-12)
CYPRESS WOODS H S(Students: 3,158, Location: 16825 SPRING CYPRESS RD, Grades: 9-12)
Private high school in in this zip code not listed on the city page:
THE OAKS ADVENTIST CHRISTIAN SCHOOL (Students: 112, Location: 11735 GRANT RD, Grades: PK-12)
Biggest public elementary/middle schools in in zip code 77429 not listed on the city page:
Facilities with environmental interests located in this zip code:
ARNOLD MIDDLE SCHOOL (11111 TELGE RD in CYPRESS, TX)
(National Center for Education Statistics) - STATE ID-101907041 Organizations: CYPRESS-FAIRBANKS IS (SCHOOL DISTRICT)
AULT EL (21010 MAPLE VILLAGE DR in CYPRESS, TX)
(National Center for Education Statistics) - STATE ID-101907133 Organizations: CYPRESS-FAIRBANKS IS (SCHOOL DISTRICT)
Housing units lacking complete plumbing facilities: 0.6% Housing units lacking complete kitchen facilities: 1.3%
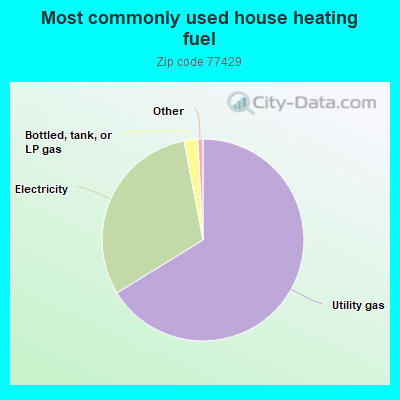
66.3%Utility gas
30.8%Electricity
2.2%Bottled, tank, or LP gas
Population in 1990: 18,527. Population change in the 1990s: +23,856 (+128.8%).
Place of birth for U.S.-born residents:
This state: 48,799
Northeast: 4,128
Midwest: 6,857
South: 9,529
West: 7,609
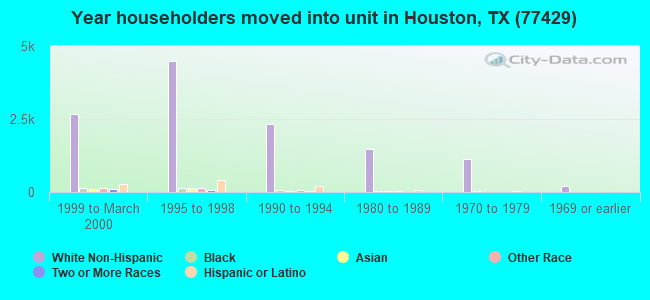
46% of the 77429 zip code residents lived in the same house 5 years ago. Out of people who lived in different houses, 66% lived in this county. Out of people who lived in different counties, 50% lived in Texas.
90% of the 77429 zip code residents lived in the same house 1 year ago. Out of people who lived in different houses, 57% moved from this county. Out of people who lived in different houses, 12% moved from different county within same state. Out of people who lived in different houses, 25% moved from different state. Out of people who lived in different houses, 7% moved from abroad.
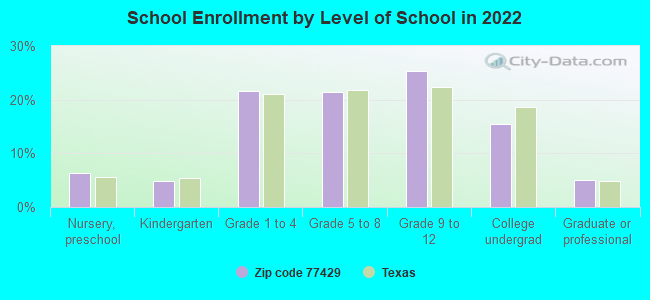
Private vs. public school enrollment:
Students in private schools in grades 1 to 8 (elementary and middle school): 1,904
Here:
16.6%
Texas:
8.8%
Students in private schools in grades 9 to 12 (high school): 665
Here:
9.9%
Texas:
8.0%
Students in private undergraduate colleges: 378
Here:
9.3%
Texas:
16.2%
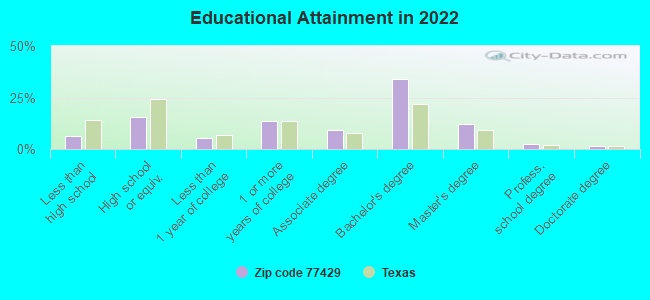
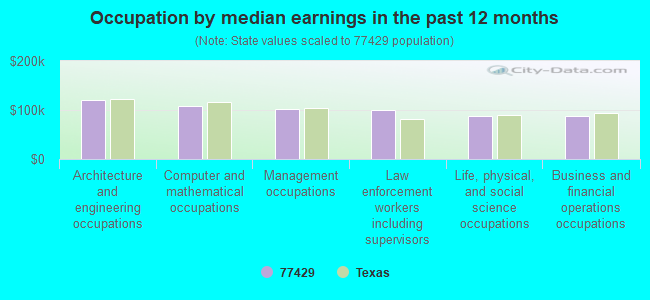
Occupation by median earnings in the past 12 months ($)
119,791Architecture and engineering occupations
108,282Computer and mathematical occupations
102,065Management occupations
100,259Law enforcement workers including supervisors
88,711Life, physical, and social science occupations
88,375Business and financial operations occupations
Companies with federal contracts located in this zip code (CYPRESS, TX):
GEOACOUSTICS INC (12626 WILLIAM DOWDELL; small business) 500 employees, $0 revenue. : $345,128 in 4 contractsfrom 2000 to 2004
$118,355 with Army for Underwater Sound Equipment. Signed on 2004-04-01. Completion date: 2004-05-14.
$118,355 with U.S. Army Corps of Engineers - civil program financing only for Underwater Sound Equipment. Signed on 2004-04-01. Completion date: 2004-05-14.
$59,418 with U.S. Army Corps of Engineers - civil program financing only for Geophysical Instruments. Taking place in MA. Signed on 2000-08-02. Completion date: 2000-09-05.
$49,000, same as above.Signed on 2000-08-02. Completion date: 2000-09-05.
BIONOMICS CORPORATION (18214 CYPRESS CHURCH ROAD; small business) : $241,354 in 3 contractsfrom 2000 to 2003
$295,120 with U.S. Army Corps of Engineers - civil program financing only for Construction of Structures and Facilities -- Other Conservation and Development Facilities. Signed on 2000-11-09. Completion date: 2001-09-28.
$50,000, same as above.Signed on 2000-09-05. Completion date: 2000-11-30.
-$103,766 with Army for Construction of Structures and Facilities -- Other Conservation and Development Facilities. Signed on 2003-10-22. Completion date: 2003-12-31.
ROBERTSON GEOLOGGING (USA) INC (11115 MILLS ROAD; small business) : $212,338 in 7 contractsfrom 2001 to 2006
Contracts for Radio and Television Communication Equipment, Except Airborne, Geophysical Instruments by Geological Survey, U.S. Army Corps of Engineers - civil program financing only, Army, EPA, and others Signed by year:2000: $0; 2001: $79,000; 2002: $20,938; 2003: $51,825; 2004: $0; 2005: $46,850; 2006: $13,725.
Biggest contracts:
$79,000 with Geological Survey for Radio and Television Communication Equipment, Except Airborne. Taking place in CA. Signed on 2001-08-15. Completion date: 2001-12-15.
$51,825 with Geological Survey for Geophysical Instruments. Taking place in VA. Signed on 2003-07-15. Completion date: 2003-09-15.
$23,425 with U.S. Army Corps of Engineers - civil program financing only for Geophysical Instruments. Signed on 2005-07-19. Completion date: 2005-08-31.
$23,425 with Army for Geophysical Instruments. Signed on 2005-07-19. Completion date: 2005-08-31.
SRINIVASAN JR , SETHURAMAN (12755 MILL RIDGE #108) : $54,000 in 2 contractsin 2004
$27,000 with U.S. Army Corps of Engineers - civil program financing only for Other Professional Services. Signed on 2004-10-21. Completion date: 2005-02-03.
$27,000 with Army for Other Professional Services. Signed on 2004-10-21. Completion date: 2005-02-03.
TEXAS OFFLINE INC (11702B GRANT, STE 630; small business) : $18,480 in 2 contractsin 2004
$15,460 with Navy for ADP Software. Signed on 2004-09-03. Completion date: 2004-09-30.
$3,020 with Army for ADP Software. Signed on 2004-06-16. Completion date: 2004-07-09.
IQS MEDICAL LTD (15506 KERRVILLE CT; small business) : $13,390 in 2 contractsin 2005
$7,472 with Army for Hospital Furniture, Equipment, Utensils, and Supplies. Signed on 2005-03-30. Completion date: 2005-03-31.
$5,918, same as above.Signed on 2005-09-14. Completion date: 2005-09-30.
BIOTHENTICA CORPORATION (11803 GRANT ROAD; small business)
$3,751 with Army for ADP Input/Output and Storage Devices. Signed on 2002-09-06. Completion date: 2002-08-17.
CHASEWOOD ENVIRONMENTAL SYSTEM (18623 TELGE RD; small business)
-$10,332 with Air Force for Miscellaneous Household and Commercial Furnishings and Appliances. Signed on 2005-01-12. Completion date: 2004-10-04.
Top industries in this zip code by the number of employees in 2005:
2003 - 2018 National Fire Incident Reporting System (NFIRS) incidents
Based on the data from the years 2003 - 2018 the average number of fires per year is 136. The highest number of fire incidents - 248 took place in 2011, and the least - 67 in 2003. The data has an increasing trend.
When looking into fire subcategories, the most reports belonged to: Outside Fires (55.4%), and Structure Fires (27.3%).
Fire incident types reported to NFIRS in Zip Code 77429


 Nearest zip codes: 77377, 77095, 77065, 77070, 77433, 77375.


 (Students: 3,194, Location: 22602 HEMPSTEAD HWY, Grades: 9-12)
 Based on the data from the years 2003 - 2018 the average number of fires per year is 136. The highest number of fire incidents - 248 took place in 2011, and the least - 67 in 2003. The data has an increasing trend.
 When looking into fire subcategories, the most reports belonged to: Outside Fires (55.4%), and Structure Fires (27.3%).