Estimated zip code population in 2022: 27,794 Zip code population in 2010: 4,809 Zip code population in 2000: 2,080
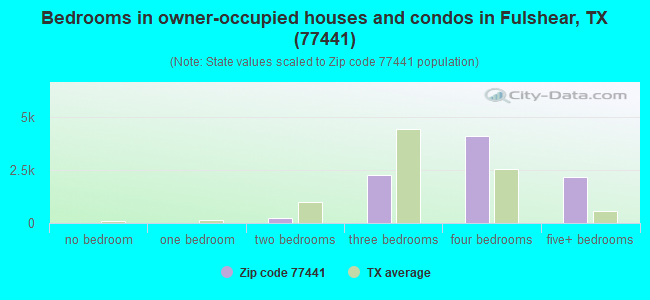
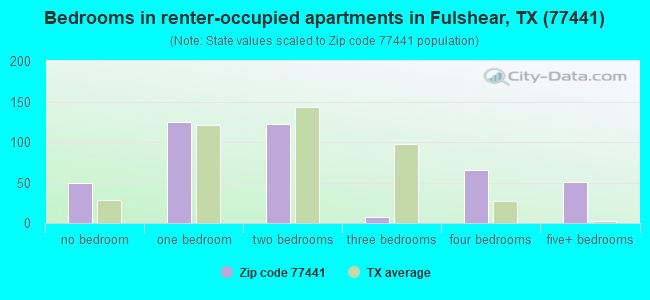
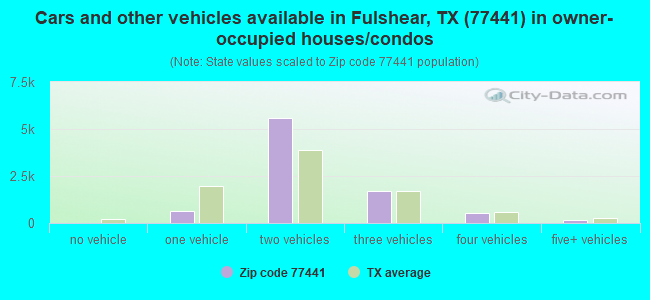
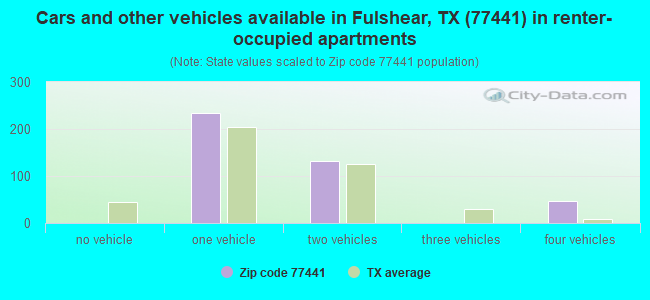
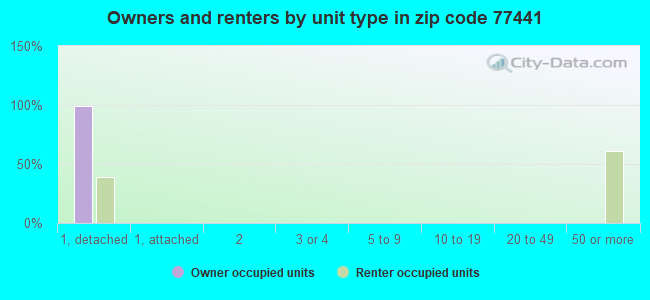
Houses and condos: 9,519 Renter-occupied apartments: 412
% of renters here:
5%
State:
38%
March 2022 cost of living index in zip code 77441: 97.6 (near average, U.S. average is 100)
Land area: 43.7 sq. mi. Water area: 1.4 sq. mi.
Population density: 636 people per square mile
(low).
OSM Map
General Map
Google Map
MSN Map
OSM Map
General Map
Google Map
MSN Map
OSM Map
General Map
Google Map
MSN Map
OSM Map
General Map
Google Map
MSN Map
Please wait while loading the map...
Real estate property taxes paid for housing units in 2022:
This zip code:
1.8% ($10,460)
Texas:
1.5% ($4,050)
Median real estate property taxes paid for housing units with mortgages in 2022: $10,505 (1.8%) Median real estate property taxes paid for housing units with no mortgage in 2022: $10,700 (1.9%)
Business Search- 14 Million verified businesses
Males: 13,850
(49.8%)
Females: 13,944
(50.2%)
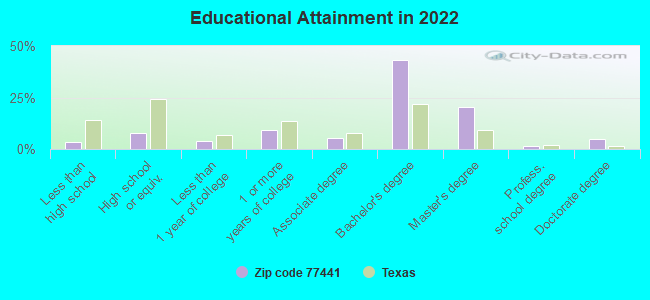
For population 25 years and over in 77441:
High school or higher: 99.2%
Bachelor's degree or higher: 72.2%
Graduate or professional degree: 27.6%
Unemployed: 4.1%
Mean travel time to work (commute): 37.9 minutes
For population 15 years and over in 77441:
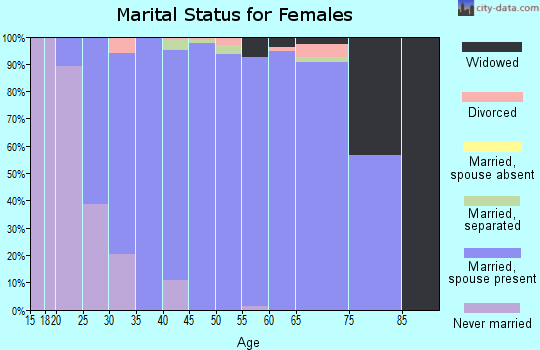
Never married: 22.2%
Now married: 72.0%
Separated: 0.2%
Widowed: 2.7%
Divorced: 2.9%
Zip code 77441 compared to state average:
Median household income significantly above state average.
Median house value above state average.
Black race population percentage significantly below state average.
Hispanic race population percentage below state average.
Foreign-born population percentage above state average.
Renting percentage significantly below state average.
Length of stay since moving in significantly below state average.
Number of rooms per house significantly above state average.
House age significantly below state average.
Percentage of population with a bachelor's degree or higher above state average.
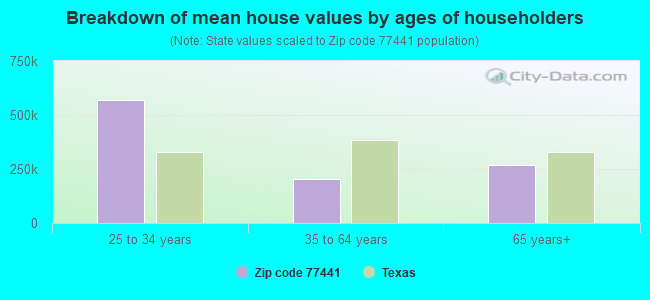
Estimated median house/condo value in 2022: $570,124
77441:
$570,124
Texas:
$275,400
According to our research of Texas and other state lists, there were 8 registered sex offenders living in 77441 zip code as of April 26, 2024. The ratio of all residents to sex offenders in zip code 77441 is 1,008 to 1. The ratio of registered sex offenders to all residents in this zip code is lower than the state average.
Median resident age:
This zip code:
39.4 years
Texas median age:
35.6 years
Average household size:
This zip code:
3.1 people
Texas:
2.6 people
Averages for the 2020 tax year for zip code 77441, filed in 2021:
Average Adjusted Gross Income (AGI) in 2020: $174,745 (Individual Income Tax Returns)
Here:
$174,745
State:
$77,054
Salary/wage: $152,087 (reported on 84.1% of returns)
Here:
$152,087
State:
$62,766
(% of AGI for various income ranges: 1144.2% for AGIs below $25k, 3242.0% for AGIs $25k-50k, 5979.7% for AGIs $50k-75k, 9129.2% for AGIs $75k-100k, 18829.9% for AGIs $100k-200k, 70800.9% for AGIs over 200k)
Taxable interest for individuals: $2,197 (reported on 46.4% of returns)
This zip code:
$2,197
Texas:
$2,665
(% of AGI for various income ranges: 24.5% for AGIs below $25k, 61.2% for AGIs $25k-50k, 74.5% for AGIs $50k-75k, 78.2% for AGIs $75k-100k, 139.6% for AGIs $100k-200k, 526.2% for AGIs over 200k)
Ordinary dividends: $8,954 (reported on 40.2% of returns)
Here:
$8,954
State:
$10,044
(% of AGI for various income ranges: 45.9% for AGIs below $25k, 150.9% for AGIs $25k-50k, 227.8% for AGIs $50k-75k, 253.7% for AGIs $75k-100k, 377.7% for AGIs $100k-200k, 2133.5% for AGIs over 200k)
Net capital gain/loss in AGI: +$18,807 (reported on 38.9% of returns)
Here:
+$18,807
State:
+$39,590
(% of AGI for various income ranges: 22.4% for AGIs below $25k, 76.8% for AGIs $25k-50k, 162.5% for AGIs $50k-75k, 330.6% for AGIs $75k-100k, 490.7% for AGIs $100k-200k, 5163.1% for AGIs over 200k)
Profit/loss from business: +$20,987 (reported on 23.0% of returns)
Here:
+$20,987
State:
+$10,888
(% of AGI for various income ranges: 164.4% for AGIs below $25k, 287.1% for AGIs $25k-50k, 323.8% for AGIs $50k-75k, 460.4% for AGIs $75k-100k, 721.0% for AGIs $100k-200k, 2326.7% for AGIs over 200k)
Taxable individual retirement arrangement distribution: $44,574 (reported on 11.5% of returns)
77441:
$44,574
Texas:
$24,740
(% of AGI for various income ranges: 54.0% for AGIs below $25k, 160.8% for AGIs $25k-50k, 397.3% for AGIs $50k-75k, 826.7% for AGIs $75k-100k, 1099.4% for AGIs $100k-200k, 2037.9% for AGIs over 200k)
Self-employed (Keogh) retirement plans: $25,438 (reported on 1.3% of returns)
77441:
$25,438
Texas:
$29,298
(% of AGI for various income ranges: 26.5% for AGIs $100k-200k, 235.5% for AGIs over 200k)
Total itemized deductions: $37,112 (reported on 24.6% of returns)
Here:
$37,112
State:
$40,428
(% of AGI for various income ranges: 121.8% for AGIs below $25k, 377.7% for AGIs $25k-50k, 687.7% for AGIs $50k-75k, 938.8% for AGIs $75k-100k, 1378.0% for AGIs $100k-200k, 4632.7% for AGIs over 200k)
Charity contributions: $13,086 (reported on 20.5% of returns)
Here:
$13,086
State:
$18,201
(% of AGI for various income ranges: 8.7% for AGIs below $25k, 51.6% for AGIs $25k-50k, 98.7% for AGIs $50k-75k, 179.2% for AGIs $75k-100k, 315.7% for AGIs $100k-200k, 1643.5% for AGIs over 200k)
Taxes paid: $9,302 (reported on 24.2% of returns)
77441:
$9,302
State:
$7,821
(% of AGI for various income ranges: 27.7% for AGIs below $25k, 90.9% for AGIs $25k-50k, 173.5% for AGIs $50k-75k, 259.2% for AGIs $75k-100k, 381.7% for AGIs $100k-200k, 1072.9% for AGIs over 200k)
Earned income credit: $2,309 (reported on 5.7% of returns)
Here:
$2,309
State:
$2,584
(% of AGI for various income ranges: 63.8% for AGIs below $25k, 73.1% for AGIs $25k-50k)
Percentage of individuals using paid preparers for their 2020 taxes: 93.2%
Here:
93%
State:
92%
(% for various income ranges: 91.8% for AGIs below $25k, 92.9% for AGIs $25k-50k, 92.7% for AGIs $50k-75k, 92.2% for AGIs $75k-100k, 93.0% for AGIs $100k-200k, 94.9% for AGIs over 200k)
Averages for the 2012 tax year for zip code 77441, filed in 2013:
Average Adjusted Gross Income (AGI) in 2012: $180,184 (Individual Income Tax Returns)
Here:
$180,184
State:
$65,384
Salary/wage: $148,468 (reported on 86.1% of returns)
Here:
$148,468
State:
$52,524
(% of AGI for various income ranges: 81.7% for AGIs below $25k, 69.3% for AGIs $25k-50k, 66.0% for AGIs $50k-75k, 71.7% for AGIs $75k-100k, 81.1% for AGIs $100k-200k, 67.0% for AGIs over 200k)
Taxable interest for individuals: $2,044 (reported on 56.1% of returns)
This zip code:
$2,044
Texas:
$2,372
(% of AGI for various income ranges: 1.9% for AGIs below $25k, 0.8% for AGIs $25k-50k, 1.7% for AGIs $50k-75k, 1.0% for AGIs $75k-100k, 0.8% for AGIs $100k-200k, 0.5% for AGIs over 200k)
Ordinary dividends: $7,900 (reported on 42.2% of returns)
Here:
$7,900
State:
$9,721
(% of AGI for various income ranges: 3.5% for AGIs below $25k, 3.3% for AGIs $25k-50k, 2.7% for AGIs $50k-75k, 2.0% for AGIs $75k-100k, 1.4% for AGIs $100k-200k, 1.9% for AGIs over 200k)
Net capital gain/loss in AGI: +$19,856 (reported on 36.2% of returns)
Here:
+$19,856
State:
+$35,319
(% of AGI for various income ranges: 1.4% for AGIs below $25k, 0.8% for AGIs $25k-50k, 0.3% for AGIs $50k-75k, 0.6% for AGIs $75k-100k, 1.3% for AGIs $100k-200k, 5.5% for AGIs over 200k)
Profit/loss from business: +$31,084 (reported on 20.3% of returns)
Here:
+$31,084
State:
+$13,732
(% of AGI for various income ranges: 7.8% for AGIs below $25k, 6.9% for AGIs $25k-50k, 4.4% for AGIs $50k-75k, 5.1% for AGIs $75k-100k, 3.8% for AGIs $100k-200k, 3.1% for AGIs over 200k)
Taxable individual retirement arrangement distribution: $36,051 (reported on 12.7% of returns)
77441:
$36,051
Texas:
$19,511
(% of AGI for various income ranges: 3.5% for AGIs below $25k, 4.0% for AGIs $25k-50k, 6.3% for AGIs $50k-75k, 5.3% for AGIs $75k-100k, 3.7% for AGIs $100k-200k, 1.7% for AGIs over 200k)
Self-employment retirement plans: $30,529 (reported on 1.7% of returns)
77441:
$30,529
Texas:
$23,938
(% of AGI for various income ranges: 0.4% for AGIs $100k-200k, 0.3% for AGIs over 200k)
Total itemized deductions: $30,426 (12% of AGI, reported on 63.5% of returns)
Here:
$30,426
State:
$24,724
Here:
12.2% of AGI
State:
15.9% of AGI
(% of AGI for various income ranges: 13.7% for AGIs below $25k, 17.7% for AGIs $25k-50k, 18.5% for AGIs $50k-75k, 17.7% for AGIs $75k-100k, 15.3% for AGIs $100k-200k, 8.1% for AGIs over 200k)
Charity contributions: $6,980 (reported on 54.6% of returns)
Here:
$6,980
State:
$6,808
(% of AGI for various income ranges: 1.4% for AGIs below $25k, 2.2% for AGIs $25k-50k, 2.4% for AGIs $50k-75k, 2.5% for AGIs $75k-100k, 2.3% for AGIs $100k-200k, 2.0% for AGIs over 200k)
Taxes paid: $11,010 (reported on 63.3% of returns)
77441:
$11,010
State:
$6,921
(% of AGI for various income ranges: 3.6% for AGIs below $25k, 5.6% for AGIs $25k-50k, 5.1% for AGIs $50k-75k, 5.9% for AGIs $75k-100k, 5.8% for AGIs $100k-200k, 2.9% for AGIs over 200k)
Earned income credit: $2,150 (reported on 5.5% of returns)
Here:
$2,150
State:
$2,570
(% of AGI for various income ranges: 4.7% for AGIs below $25k, 0.8% for AGIs $25k-50k)
Percentage of individuals using paid preparers for their 2012 taxes: 50.4%
Here:
50%
State:
51%
(% for various income ranges: 43.0% for AGIs below $25k, 48.5% for AGIs $25k-50k, 51.9% for AGIs $50k-75k, 48.4% for AGIs $75k-100k, 47.6% for AGIs $100k-200k, 59.8% for AGIs over 200k)
Averages for the 2004 tax year for zip code 77441, filed in 2005:
Average Adjusted Gross Income (AGI) in 2004: $97,552 (Individual Income Tax Returns)
Here:
$97,552
State:
$47,881
Salary/wage: $79,615 (reported on 81.9% of returns)
Here:
$79,615
State:
$41,947
(% of AGI for various income ranges: 130.8% for AGIs below $10k, 75.1% for AGIs $10k-25k, 80.7% for AGIs $25k-50k, 65.0% for AGIs $50k-75k, 70.7% for AGIs $75k-100k, 64.8% for AGIs over 100k)
Taxable interest for individuals: $3,556 (reported on 58.1% of returns)
This zip code:
$3,556
Texas:
$2,255
(% of AGI for various income ranges: 9.4% for AGIs below $10k, 3.6% for AGIs $10k-25k, 1.7% for AGIs $25k-50k, 3.2% for AGIs $50k-75k, 3.1% for AGIs $75k-100k, 1.8% for AGIs over 100k)
Taxable dividends: $5,776 (reported on 42.7% of returns)
Here:
$5,776
State:
$4,261
(% of AGI for various income ranges: 8.2% for AGIs below $10k, 2.2% for AGIs $10k-25k, 1.7% for AGIs $25k-50k, 4.0% for AGIs $50k-75k, 2.4% for AGIs $75k-100k, 2.4% for AGIs over 100k)
Net capital gain/loss: +$15,566 (reported on 37.5% of returns)
Here:
+$15,566
State:
+$16,110
(% of AGI for various income ranges: -2.3% for AGIs below $10k, -0.3% for AGIs $10k-25k, 0.5% for AGIs $25k-50k, 2.5% for AGIs $50k-75k, 1.7% for AGIs $75k-100k, 7.5% for AGIs over 100k)
Profit/loss from business: +$19,310 (reported on 22.8% of returns)
Here:
+$19,310
State:
+$11,013
(% of AGI for various income ranges: 7.9% for AGIs below $10k, 7.8% for AGIs $10k-25k, 5.4% for AGIs $25k-50k, 6.8% for AGIs $50k-75k, 2.2% for AGIs $75k-100k, 4.4% for AGIs over 100k)
IRA payment deduction: $3,862 (reported on 3.9% of returns)
77441:
$3,862
Texas:
$3,120
(% of AGI for various income ranges: 0.4% for AGIs $25k-50k, 0.6% for AGIs $50k-75k, 0.3% for AGIs $75k-100k, 0.1% for AGIs over 100k)
Self-employed pension: $16,036 (reported on 1.9% of returns)
Here:
$16,036
Texas:
$16,401
Total itemized deductions: $26,841 (18% of AGI, reported on 52.5% of returns)
Here:
$26,841
State:
$19,631
Here:
18.2% of AGI
State:
18.9% of AGI
(% of AGI for various income ranges: 19.2% for AGIs $10k-25k, 16.6% for AGIs $25k-50k, 23.0% for AGIs $50k-75k, 20.5% for AGIs $75k-100k, 12.8% for AGIs over 100k)
Charity contributions deductions: $6,018 (4% of AGI, reported on 48.0% of returns)
Here:
$6,018
State:
$4,753
Here:
4.0% of AGI
State:
4.2% of AGI
(% of AGI for various income ranges: 2.2% for AGIs $10k-25k, 1.6% for AGIs $25k-50k, 4.6% for AGIs $50k-75k, 2.9% for AGIs $75k-100k, 3.0% for AGIs over 100k)
Total tax: $19,808 (reported on 80.6% of returns)
77441:
$19,808
State:
$9,058
(% of AGI for various income ranges: 4.2% for AGIs below $10k, 4.0% for AGIs $10k-25k, 6.8% for AGIs $25k-50k, 9.2% for AGIs $50k-75k, 10.2% for AGIs $75k-100k, 18.9% for AGIs over 100k)
Earned income credit: $1,939 (reported on 11.0% of returns)
Here:
$1,939
State:
$2,024
Percentage of individuals using paid preparers for their 2004 taxes: 57.1%
Here:
57%
State:
57%
(% for various income ranges: 48.2% for AGIs below $10k, 59.4% for AGIs $10k-25k, 58.1% for AGIs $25k-50k, 55.3% for AGIs $50k-75k, 60.5% for AGIs $75k-100k, 59.6% for AGIs over 100k)
Household received Food Stamps/SNAP in the past 12 months: 292 Household did not receive Food Stamps/SNAP in the past 12 months: 8,746
Women who had a birth in the past 12 months: 157 (160 now married, 0 unmarried) Women who did not have a birth in the past 12 months: 6,718 (4,232 now married, 2,445 unmarried)
Housing units in zip code 77441 with a mortgage: 6,153 (296 second mortgage, 74 both second mortgage and home equity loan) Median monthly owner costs for units with a mortgage: $3,410 Median monthly owner costs for units without a mortgage: $1,537
Residents with income below the poverty level in 2022:
This zip code:
1.3%
Whole state:
14.0%
Residents with income below 50% of the poverty level in 2022:
This zip code:
0.9%
Whole state:
7.4%
Median number of rooms in houses and condos:
Here:
8.4
State:
6.3
Median number of rooms in apartments:
Here:
4.7
State:
4.0
Notable locations in this zip code not listed on our city pages
Notable locations in zip code 77441: Weston Lakes Country Club (A), Fulshear Simonton Fire Department Station 1 (B), Bob Lutts Fulshear/Simonton Branch Library (C), Fulshear Police Department (D). Display/hide their locations on the map
Churches in zip code 77441 include: Saint Johns Church (A), Saint Pauls Church (B), Zion Chapel (C), Jerusalem Starlight Church (D). Display/hide their locations on the map
In group quarters: 8 (-1 institutionalized population)
Size of family households: 2,781 2-persons, 1,982 3-persons, 2,230 4-persons, 1,071 5-persons, 139 6-persons, 65 7-or-more-persons
Size of nonfamily households: 573 1-person, 112 2-persons
7,412 married couples with children.
651 single-parent households (591 men, 60 women).
66.9% of residents of 77441 zip code speak English at home.
17.7% of residents speak Spanish at home (86% very well, 11% well, 2% not well).
8.6% of residents speak other Indo-European language at home (96% very well, 2% well, 1% not well, 1% not at all).
6.5% of residents speak Asian or Pacific Island language at home (70% very well, 18% well, 9% not well, 4% not at all).
0.5% of residents speak other language at home (78% very well, 22% well).
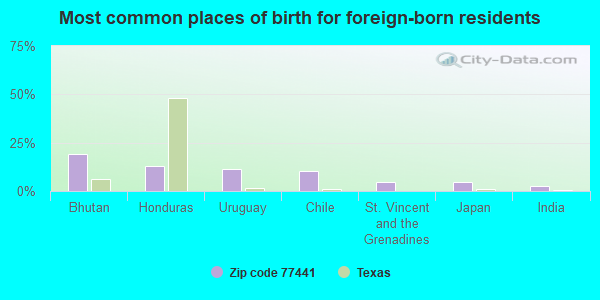
Foreign born population: 7,743 (27.9%) (66.8% of them are naturalized citizens)
This zip code:
27.9%
Whole state:
17.2%
19%Bhutan
13%Honduras
11%Uruguay
10%Chile
4%St. Vincent and the Grenadines
4%Japan
2%India
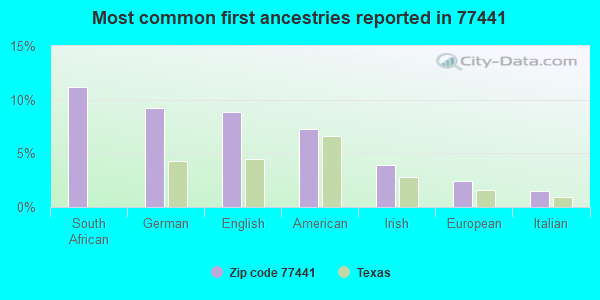
11%South African
9%German
9%English
7%American
4%Irish
2%European
2%Italian
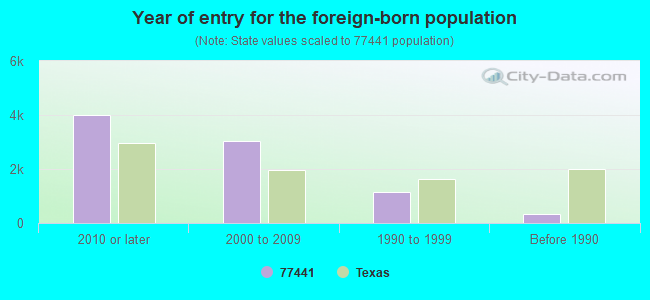
Year of entry for the foreign-born population
4,0062010 or later
3,0512000 to 2009
1,1541990 to 1999
346Before 1990
Housing units lacking complete plumbing facilities: 2.8% Housing units lacking complete kitchen facilities: 2.6%
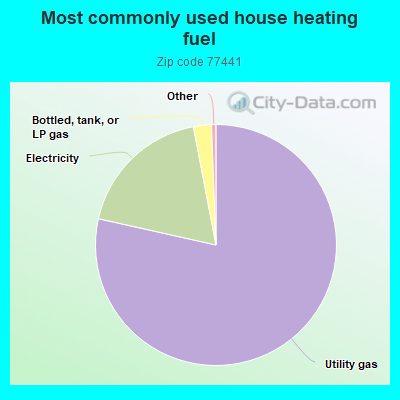
78.5%Utility gas
18.5%Electricity
2.4%Bottled, tank, or LP gas
Population in 1990: 193. Population change in the 1990s: +1,887 (+977.7%).
Place of birth for U.S.-born residents:
This state: 10,300
Northeast: 852
Midwest: 2,355
South: 3,454
West: 2,790
59% of the 77441 zip code residents lived in the same house 5 years ago. Out of people who lived in different houses, 46% lived in this county. Out of people who lived in different counties, 50% lived in Texas.
90% of the 77441 zip code residents lived in the same house 1 year ago. Out of people who lived in different houses, 54% moved from this county. Out of people who lived in different houses, 24% moved from different county within same state. Out of people who lived in different houses, 17% moved from different state. Out of people who lived in different houses, 5% moved from abroad.
Private vs. public school enrollment:
Students in private schools in grades 1 to 8 (elementary and middle school): 318
Here:
7.5%
Texas:
8.8%
Students in private schools in grades 9 to 12 (high school): 256
Here:
10.4%
Texas:
8.0%
Students in private undergraduate colleges: 210
Here:
18.5%
Texas:
16.2%
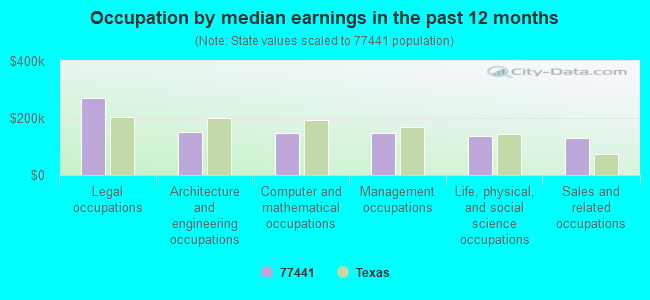
Occupation by median earnings in the past 12 months ($)
269,524Legal occupations
150,648Architecture and engineering occupations
147,928Computer and mathematical occupations
146,985Management occupations
137,377Life, physical, and social science occupations
131,519Sales and related occupations
Companies with federal contracts located in this zip code:
SPECTRUM BATTERIES INC (6910 SPRIGG ST in FULSHEAR, TX; small business)
$9,981 with Air Force for Batteries, Nonrechargeable. Signed on 2005-08-02. Completion date: 2005-08-09.
Top industries in this zip code by the number of employees in 2005:
Construction: New Single-Family Housing Construction (except Operative Builders) (50-99 employees: 1 establishment)
Administrative and Support and Waste Management and Remediation Services: Temporary Help Services (20-49: 2)
Arts, Entertainment, and Recreation: Golf Courses and Country Clubs (20-49: 1)
Construction: Electrical Contractors (20-49: 1)
Administrative and Support and Waste Management and Remediation Services: Office Administrative Services (20-49: 1)
Administrative and Support and Waste Management and Remediation Services: Landscaping Services (10-19: 1, 1-4: 1)
Health Care and Social Assistance: Child Day Care Services (10-19: 1)
People in group quarters in 2010:
6 people in workers' group living quarters and job corps centers
Fatal accident statistics in 2013:
Fatal accident count: 1
Vehicles involved in fatal accidents: 1
Fatal accidents caused by drunken drivers: 0
Fatalities: 1
Persons involved in fatal accidents: 1
Pedestrians involved in fatal accidents: 0
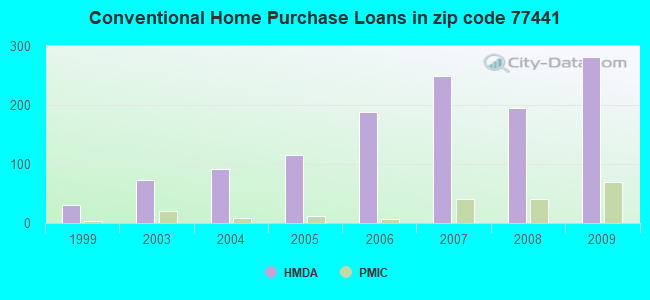
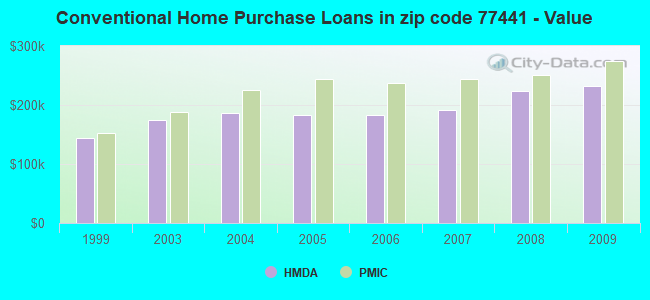
Home Mortgage Disclosure Act Aggregated Statistics For Year 2009 (Based on 4 partial tracts)
A) FHA, FSA/RHS & VA Home Purchase Loans
B) Conventional Home Purchase Loans
C) Refinancings
D) Home Improvement Loans
F) Non-occupant Loans on < 5 Family Dwellings (A B C & D)
G) Loans On Manufactured Home Dwelling (A B C & D)
Number
Average Value
Number
Average Value
Number
Average Value
Number
Average Value
Number
Average Value
Number
Average Value
LOANS ORIGINATED
70
$236,531
282
$232,927
182
$230,114
14
$99,132
6
$214,470
0
$0
APPLICATIONS APPROVED, NOT ACCEPTED
3
$207,373
28
$252,502
17
$224,285
1
$66,540
1
$105,530
0
$0
APPLICATIONS DENIED
8
$282,435
36
$222,914
56
$256,017
14
$68,875
1
$346,460
1
$58,320
APPLICATIONS WITHDRAWN
11
$224,782
35
$249,794
36
$232,194
1
$87,100
3
$199,230
0
$0
FILES CLOSED FOR INCOMPLETENESS
5
$227,838
5
$230,428
6
$279,472
1
$23,760
0
$0
0
$0
Aggregated Statistics For Year 2008 (Based on 4 partial tracts)
A) FHA, FSA/RHS & VA Home Purchase Loans
B) Conventional Home Purchase Loans
C) Refinancings
D) Home Improvement Loans
F) Non-occupant Loans on < 5 Family Dwellings (A B C & D)
G) Loans On Manufactured Home Dwelling (A B C & D)
Number
Average Value
Number
Average Value
Number
Average Value
Number
Average Value
Number
Average Value
Number
Average Value
LOANS ORIGINATED
35
$218,466
195
$224,524
68
$254,616
15
$46,311
16
$238,331
1
$79,300
APPLICATIONS APPROVED, NOT ACCEPTED
1
$207,670
23
$241,537
10
$241,869
5
$65,580
2
$256,715
0
$0
APPLICATIONS DENIED
3
$212,177
25
$213,988
51
$306,524
15
$69,899
9
$367,559
3
$78,427
APPLICATIONS WITHDRAWN
5
$256,468
39
$175,615
16
$238,858
3
$133,800
2
$249,900
0
$0
FILES CLOSED FOR INCOMPLETENESS
2
$212,315
6
$231,603
1
$898,560
0
$0
0
$0
0
$0
Aggregated Statistics For Year 2007 (Based on 4 partial tracts)
A) FHA, FSA/RHS & VA Home Purchase Loans
B) Conventional Home Purchase Loans
C) Refinancings
D) Home Improvement Loans
F) Non-occupant Loans on < 5 Family Dwellings (A B C & D)
G) Loans On Manufactured Home Dwelling (A B C & D)
Number
Average Value
Number
Average Value
Number
Average Value
Number
Average Value
Number
Average Value
Number
Average Value
LOANS ORIGINATED
14
$198,334
249
$191,967
47
$228,437
21
$66,476
12
$169,856
0
$0
APPLICATIONS APPROVED, NOT ACCEPTED
0
$0
37
$217,549
12
$228,179
3
$92,637
6
$185,985
1
$59,090
APPLICATIONS DENIED
1
$132,540
46
$254,173
41
$285,986
10
$63,531
6
$292,823
2
$18,870
APPLICATIONS WITHDRAWN
0
$0
35
$211,853
17
$248,595
3
$63,750
3
$356,173
0
$0
FILES CLOSED FOR INCOMPLETENESS
0
$0
6
$366,298
12
$244,961
0
$0
1
$288,140
0
$0
Aggregated Statistics For Year 2006 (Based on 4 partial tracts)
A) FHA, FSA/RHS & VA Home Purchase Loans
B) Conventional Home Purchase Loans
C) Refinancings
D) Home Improvement Loans
F) Non-occupant Loans on < 5 Family Dwellings (A B C & D)
G) Loans On Manufactured Home Dwelling (A B C & D)
Number
Average Value
Number
Average Value
Number
Average Value
Number
Average Value
Number
Average Value
Number
Average Value
LOANS ORIGINATED
4
$251,588
188
$182,252
45
$217,892
12
$133,101
5
$160,430
2
$32,925
APPLICATIONS APPROVED, NOT ACCEPTED
0
$0
29
$149,226
14
$180,584
4
$58,198
3
$118,663
3
$36,750
APPLICATIONS DENIED
1
$100,460
35
$204,873
33
$172,866
12
$37,132
13
$203,699
3
$30,713
APPLICATIONS WITHDRAWN
0
$0
23
$210,962
23
$229,880
2
$24,595
6
$210,455
0
$0
FILES CLOSED FOR INCOMPLETENESS
0
$0
3
$130,143
9
$217,972
0
$0
0
$0
0
$0
Aggregated Statistics For Year 2005 (Based on 4 partial tracts)
A) FHA, FSA/RHS & VA Home Purchase Loans
B) Conventional Home Purchase Loans
C) Refinancings
D) Home Improvement Loans
F) Non-occupant Loans on < 5 Family Dwellings (A B C & D)
G) Loans On Manufactured Home Dwelling (A B C & D)
Number
Average Value
Number
Average Value
Number
Average Value
Number
Average Value
Number
Average Value
Number
Average Value
LOANS ORIGINATED
1
$66,690
116
$182,642
72
$228,193
11
$106,235
10
$172,879
1
$16,420
APPLICATIONS APPROVED, NOT ACCEPTED
0
$0
22
$178,262
14
$259,831
3
$60,650
3
$87,923
0
$0
APPLICATIONS DENIED
0
$0
34
$136,963
41
$221,445
10
$39,268
4
$126,162
6
$39,163
APPLICATIONS WITHDRAWN
0
$0
30
$202,395
22
$225,475
4
$311,170
2
$150,120
0
$0
FILES CLOSED FOR INCOMPLETENESS
0
$0
3
$219,330
18
$182,298
2
$53,520
0
$0
0
$0
Aggregated Statistics For Year 2004 (Based on 4 partial tracts)
A) FHA, FSA/RHS & VA Home Purchase Loans
B) Conventional Home Purchase Loans
C) Refinancings
D) Home Improvement Loans
F) Non-occupant Loans on < 5 Family Dwellings (A B C & D)
G) Loans On Manufactured Home Dwelling (A B C & D)
Number
Average Value
Number
Average Value
Number
Average Value
Number
Average Value
Number
Average Value
Number
Average Value
LOANS ORIGINATED
1
$26,170
91
$186,068
89
$200,662
11
$51,438
4
$159,618
2
$37,565
APPLICATIONS APPROVED, NOT ACCEPTED
0
$0
15
$170,965
12
$191,041
2
$22,385
0
$0
3
$32,873
APPLICATIONS DENIED
0
$0
17
$188,322
55
$234,834
8
$71,439
1
$227,330
3
$35,737
APPLICATIONS WITHDRAWN
2
$128,870
17
$166,333
27
$221,267
1
$33,770
0
$0
1
$42,210
FILES CLOSED FOR INCOMPLETENESS
0
$0
2
$422,930
24
$230,474
1
$102,990
0
$0
0
$0
Aggregated Statistics For Year 2003 (Based on 4 partial tracts)
A) FHA, FSA/RHS & VA Home Purchase Loans
B) Conventional Home Purchase Loans
C) Refinancings
D) Home Improvement Loans
F) Non-occupant Loans on < 5 Family Dwellings (A B C & D)
Number
Average Value
Number
Average Value
Number
Average Value
Number
Average Value
Number
Average Value
LOANS ORIGINATED
1
$201,900
73
$173,768
165
$177,762
15
$63,333
10
$97,524
APPLICATIONS APPROVED, NOT ACCEPTED
0
$0
11
$202,247
27
$160,323
4
$120,058
0
$0
APPLICATIONS DENIED
0
$0
16
$146,155
76
$182,576
9
$50,516
0
$0
APPLICATIONS WITHDRAWN
0
$0
9
$197,878
32
$161,341
1
$17,280
1
$228,530
FILES CLOSED FOR INCOMPLETENESS
0
$0
2
$254,330
2
$174,960
0
$0
0
$0
Aggregated Statistics For Year 1999 (Based on 1 partial tract)
B) Conventional Home Purchase Loans
C) Refinancings
D) Home Improvement Loans
F) Non-occupant Loans on < 5 Family Dwellings (A B C & D)
Detailed PMIC statistics for the following Tracts:6732.00
, 6733.00
2002 - 2018 National Fire Incident Reporting System (NFIRS) incidents
Based on the data from the years 2002 - 2018 the average number of fires per year is 43. The highest number of reported fire incidents - 99 took place in 2011, and the least - 10 in 2018. The data has a declining trend.
When looking into fire subcategories, the most incidents belonged to: Outside Fires (64.1%), and Structure Fires (21.0%).
Fire incident types reported to NFIRS in Zip Code 77441


 Nearest zip codes: 77476, 77464, 77494, 77406, 77471, 77485.


 Based on the data from the years 2002 - 2018 the average number of fires per year is 43. The highest number of reported fire incidents - 99 took place in 2011, and the least - 10 in 2018. The data has a declining trend.
 When looking into fire subcategories, the most incidents belonged to: Outside Fires (64.1%), and Structure Fires (21.0%).