Cities: Thompsons, TX (5.87%) ,
Richmond, TX (2.59%) ,
Rosenberg, TX (2.34%) ,
Fairchilds, TX (0.91%) ,
Pleak, TX (0.45%) ,
Sugar Land, TX (0.38%) ,
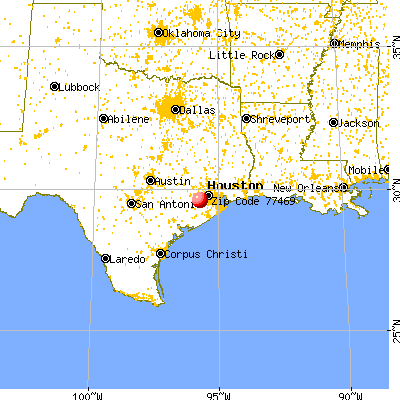
Missouri City, TX (0.14%) County: Fort Bend County, TX Estimated zip code population in 2022: 62,610
Zip code population in 2010: 35,321
Zip code population in 2000: 44,646
Houses and condos: 22,412
Renter-occupied apartments: 4,520
% of renters here:
20%State:
38%
March 2022 cost of living index in zip code 77469: 96.6
(near average, U.S. average is 100)
Land area: 130.8
sq. mi.
Water area: 6.2
sq. mi.
Population density: 479 people per square mile (low).
OSM Map
General Map
Google Map
MSN Map
OSM Map
General Map
Google Map
MSN Map
OSM Map
General Map
Google Map
MSN Map
OSM Map
General Map
Google Map
MSN Map
Please wait while loading the map...
Real estate property taxes paid for housing units in 2022:
This zip code:
1.9% ($6,058)Texas:
1.5% ($4,050)
Median real estate property taxes paid for housing units with mortgages in 2022: $6,534 (1.9%)
Median real estate property taxes paid for housing units with no mortgage in 2022: $5,555 (1.8%)
Profiles of local businesses
Business Search - 14 Million verified businesses
Males: 31,398 Females: 31,211
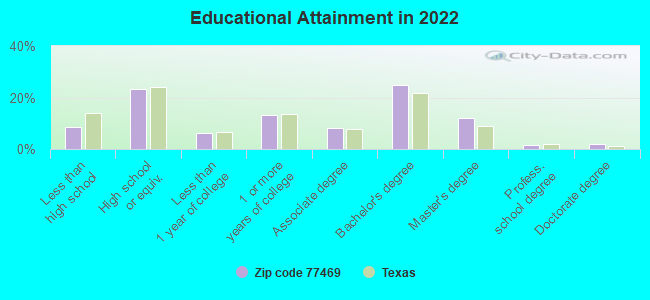
For population 25 years and over in 77469:
High school or higher: 92.2%Bachelor's degree or higher: 40.7%Graduate or professional degree: 15.6%Unemployed: 3.9%Mean travel time to work (commute): 28.4 minutes
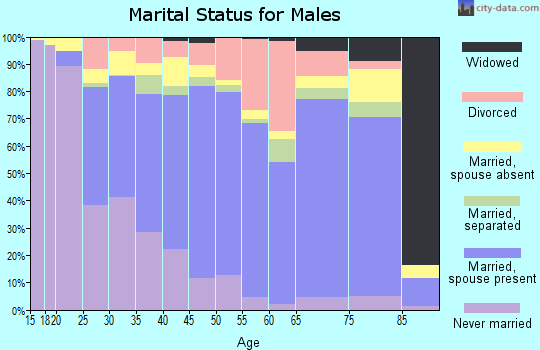
For population 15 years and over in 77469:
Never married: 31.4%Now married: 55.1%Separated: 1.5%Widowed: 4.0%Divorced: 8.1%
Zip code 77469 compared to state average:
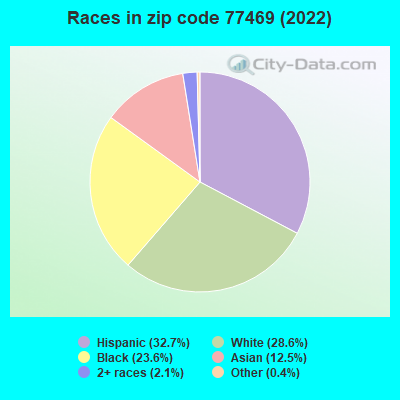
Black race population percentage above state average. Renting percentage below state average. Length of stay since moving in significantly below state average. House age significantly below state average. 20,459 32.7% Hispanic or Latino 17,930 28.6% White 14,803 23.6% Black 7,828 12.5% Asian 1,338 2.1% Two or more races 234 0.4% Some other race 15 0.02% American Indian
Data:
Median household income ($)
Median household income (% change since 2000)
Household income diversity
Ratio of average income to average house value (%)
Ratio of average income to average rent
Median household income ($) - White
Median household income ($) - Black or African American
Median household income ($) - Asian
Median household income ($) - Hispanic or Latino
Median household income ($) - American Indian and Alaska Native
Median household income ($) - Multirace
Median household income ($) - Other Race
Median household income for houses/condos with a mortgage ($)
Median household income for apartments without a mortgage ($)
Races - White alone (%)
Races - White alone (% change since 2000)
Races - Black alone (%)
Races - Black alone (% change since 2000)
Races - American Indian alone (%)
Races - American Indian alone (% change since 2000)
Races - Asian alone (%)
Races - Asian alone (% change since 2000)
Races - Hispanic (%)
Races - Hispanic (% change since 2000)
Races - Native Hawaiian and Other Pacific Islander alone (%)
Races - Native Hawaiian and Other Pacific Islander alone (% change since 2000)
Races - Two or more races (%)
Races - Two or more races (% change since 2000)
Races - Other race alone (%)
Races - Other race alone (% change since 2000)
Racial diversity
Unemployment (%)
Unemployment (% change since 2000)
Unemployment (%) - White
Unemployment (%) - Black or African American
Unemployment (%) - Asian
Unemployment (%) - Hispanic or Latino
Unemployment (%) - American Indian and Alaska Native
Unemployment (%) - Multirace
Unemployment (%) - Other Race
Population density (people per square mile)
Population - Males (%)
Population - Females (%)
Population - Males (%) - White
Population - Males (%) - Black or African American
Population - Males (%) - Asian
Population - Males (%) - Hispanic or Latino
Population - Males (%) - American Indian and Alaska Native
Population - Males (%) - Multirace
Population - Males (%) - Other Race
Population - Females (%) - White
Population - Females (%) - Black or African American
Population - Females (%) - Asian
Population - Females (%) - Hispanic or Latino
Population - Females (%) - American Indian and Alaska Native
Population - Females (%) - Multirace
Population - Females (%) - Other Race
Coronavirus confirmed cases (Apr 27, 2024)
Deaths caused by coronavirus (Apr 27, 2024)
Coronavirus confirmed cases (per 100k population) (Apr 27, 2024)
Deaths caused by coronavirus (per 100k population) (Apr 27, 2024)
Daily increase in number of cases (Apr 27, 2024)
Weekly increase in number of cases (Apr 27, 2024)
Cases doubled (in days) (Apr 27, 2024)
Hospitalized patients (Apr 18, 2022)
Negative test results (Apr 18, 2022)
Total test results (Apr 18, 2022)
COVID Vaccine doses distributed (per 100k population) (Sep 19, 2023)
COVID Vaccine doses administered (per 100k population) (Sep 19, 2023)
COVID Vaccine doses distributed (Sep 19, 2023)
COVID Vaccine doses administered (Sep 19, 2023)
Likely homosexual households (%)
Likely homosexual households (% change since 2000)
Likely homosexual households - Lesbian couples (%)
Likely homosexual households - Lesbian couples (% change since 2000)
Likely homosexual households - Gay men (%)
Likely homosexual households - Gay men (% change since 2000)
Cost of living index
Median gross rent ($)
Median contract rent ($)
Median monthly housing costs ($)
Median house or condo value ($)
Median house or condo value ($ change since 2000)
Mean house or condo value by units in structure - 1, detached ($)
Mean house or condo value by units in structure - 1, attached ($)
Mean house or condo value by units in structure - 2 ($)
Mean house or condo value by units in structure by units in structure - 3 or 4 ($)
Mean house or condo value by units in structure - 5 or more ($)
Mean house or condo value by units in structure - Boat, RV, van, etc. ($)
Mean house or condo value by units in structure - Mobile home ($)
Median house or condo value ($) - White
Median house or condo value ($) - Black or African American
Median house or condo value ($) - Asian
Median house or condo value ($) - Hispanic or Latino
Median house or condo value ($) - American Indian and Alaska Native
Median house or condo value ($) - Multirace
Median house or condo value ($) - Other Race
Median resident age
Resident age diversity
Median resident age - Males
Median resident age - Females
Median resident age - White
Median resident age - Black or African American
Median resident age - Asian
Median resident age - Hispanic or Latino
Median resident age - American Indian and Alaska Native
Median resident age - Multirace
Median resident age - Other Race
Median resident age - Males - White
Median resident age - Males - Black or African American
Median resident age - Males - Asian
Median resident age - Males - Hispanic or Latino
Median resident age - Males - American Indian and Alaska Native
Median resident age - Males - Multirace
Median resident age - Males - Other Race
Median resident age - Females - White
Median resident age - Females - Black or African American
Median resident age - Females - Asian
Median resident age - Females - Hispanic or Latino
Median resident age - Females - American Indian and Alaska Native
Median resident age - Females - Multirace
Median resident age - Females - Other Race
Commute - mean travel time to work (minutes)
Travel time to work - Less than 5 minutes (%)
Travel time to work - Less than 5 minutes (% change since 2000)
Travel time to work - 5 to 9 minutes (%)
Travel time to work - 5 to 9 minutes (% change since 2000)
Travel time to work - 10 to 19 minutes (%)
Travel time to work - 10 to 19 minutes (% change since 2000)
Travel time to work - 20 to 29 minutes (%)
Travel time to work - 20 to 29 minutes (% change since 2000)
Travel time to work - 30 to 39 minutes (%)
Travel time to work - 30 to 39 minutes (% change since 2000)
Travel time to work - 40 to 59 minutes (%)
Travel time to work - 40 to 59 minutes (% change since 2000)
Travel time to work - 60 to 89 minutes (%)
Travel time to work - 60 to 89 minutes (% change since 2000)
Travel time to work - 90 or more minutes (%)
Travel time to work - 90 or more minutes (% change since 2000)
Marital status - Never married (%)
Marital status - Now married (%)
Marital status - Separated (%)
Marital status - Widowed (%)
Marital status - Divorced (%)
Median family income ($)
Median family income (% change since 2000)
Median non-family income ($)
Median non-family income (% change since 2000)
Median per capita income ($)
Median per capita income (% change since 2000)
Median family income ($) - White
Median family income ($) - Black or African American
Median family income ($) - Asian
Median family income ($) - Hispanic or Latino
Median family income ($) - American Indian and Alaska Native
Median family income ($) - Multirace
Median family income ($) - Other Race
Median year house/condo built
Median year apartment built
Year house built - Built 2005 or later (%)
Year house built - Built 2000 to 2004 (%)
Year house built - Built 1990 to 1999 (%)
Year house built - Built 1980 to 1989 (%)
Year house built - Built 1970 to 1979 (%)
Year house built - Built 1960 to 1969 (%)
Year house built - Built 1950 to 1959 (%)
Year house built - Built 1940 to 1949 (%)
Year house built - Built 1939 or earlier (%)
Average household size
Household density (households per square mile)
Average household size - White
Average household size - Black or African American
Average household size - Asian
Average household size - Hispanic or Latino
Average household size - American Indian and Alaska Native
Average household size - Multirace
Average household size - Other Race
Occupied housing units (%)
Vacant housing units (%)
Owner occupied housing units (%)
Renter occupied housing units (%)
Vacancy status - For rent (%)
Vacancy status - For sale only (%)
Vacancy status - Rented or sold, not occupied (%)
Vacancy status - For seasonal, recreational, or occasional use (%)
Vacancy status - For migrant workers (%)
Vacancy status - Other vacant (%)
Residents with income below the poverty level (%)
Residents with income below 50% of the poverty level (%)
Children below poverty level (%)
Poor families by family type - Married-couple family (%)
Poor families by family type - Male, no wife present (%)
Poor families by family type - Female, no husband present (%)
Poverty status for native-born residents (%)
Poverty status for foreign-born residents (%)
Poverty among high school graduates not in families (%)
Poverty among people who did not graduate high school not in families (%)
Residents with income below the poverty level (%) - White
Residents with income below the poverty level (%) - Black or African American
Residents with income below the poverty level (%) - Asian
Residents with income below the poverty level (%) - Hispanic or Latino
Residents with income below the poverty level (%) - American Indian and Alaska Native
Residents with income below the poverty level (%) - Multirace
Residents with income below the poverty level (%) - Other Race
Air pollution - Air Quality Index (AQI)
Air pollution - CO
Air pollution - NO2
Air pollution - SO2
Air pollution - Ozone
Air pollution - PM10
Air pollution - PM25
Air pollution - Pb
Crime - Murders per 100,000 population
Crime - Rapes per 100,000 population
Crime - Robberies per 100,000 population
Crime - Assaults per 100,000 population
Crime - Burglaries per 100,000 population
Crime - Thefts per 100,000 population
Crime - Auto thefts per 100,000 population
Crime - Arson per 100,000 population
Crime - City-data.com crime index
Crime - Violent crime index
Crime - Property crime index
Crime - Murders per 100,000 population (5 year average)
Crime - Rapes per 100,000 population (5 year average)
Crime - Robberies per 100,000 population (5 year average)
Crime - Assaults per 100,000 population (5 year average)
Crime - Burglaries per 100,000 population (5 year average)
Crime - Thefts per 100,000 population (5 year average)
Crime - Auto thefts per 100,000 population (5 year average)
Crime - Arson per 100,000 population (5 year average)
Crime - City-data.com crime index (5 year average)
Crime - Violent crime index (5 year average)
Crime - Property crime index (5 year average)
1996 Presidential Elections Results (%) - Democratic Party (Clinton)
1996 Presidential Elections Results (%) - Republican Party (Dole)
1996 Presidential Elections Results (%) - Other
2000 Presidential Elections Results (%) - Democratic Party (Gore)
2000 Presidential Elections Results (%) - Republican Party (Bush)
2000 Presidential Elections Results (%) - Other
2004 Presidential Elections Results (%) - Democratic Party (Kerry)
2004 Presidential Elections Results (%) - Republican Party (Bush)
2004 Presidential Elections Results (%) - Other
2008 Presidential Elections Results (%) - Democratic Party (Obama)
2008 Presidential Elections Results (%) - Republican Party (McCain)
2008 Presidential Elections Results (%) - Other
2012 Presidential Elections Results (%) - Democratic Party (Obama)
2012 Presidential Elections Results (%) - Republican Party (Romney)
2012 Presidential Elections Results (%) - Other
2016 Presidential Elections Results (%) - Democratic Party (Clinton)
2016 Presidential Elections Results (%) - Republican Party (Trump)
2016 Presidential Elections Results (%) - Other
2020 Presidential Elections Results (%) - Democratic Party (Biden)
2020 Presidential Elections Results (%) - Republican Party (Trump)
2020 Presidential Elections Results (%) - Other
Ancestries Reported - Arab (%)
Ancestries Reported - Czech (%)
Ancestries Reported - Danish (%)
Ancestries Reported - Dutch (%)
Ancestries Reported - English (%)
Ancestries Reported - French (%)
Ancestries Reported - French Canadian (%)
Ancestries Reported - German (%)
Ancestries Reported - Greek (%)
Ancestries Reported - Hungarian (%)
Ancestries Reported - Irish (%)
Ancestries Reported - Italian (%)
Ancestries Reported - Lithuanian (%)
Ancestries Reported - Norwegian (%)
Ancestries Reported - Polish (%)
Ancestries Reported - Portuguese (%)
Ancestries Reported - Russian (%)
Ancestries Reported - Scotch-Irish (%)
Ancestries Reported - Scottish (%)
Ancestries Reported - Slovak (%)
Ancestries Reported - Subsaharan African (%)
Ancestries Reported - Swedish (%)
Ancestries Reported - Swiss (%)
Ancestries Reported - Ukrainian (%)
Ancestries Reported - United States (%)
Ancestries Reported - Welsh (%)
Ancestries Reported - West Indian (%)
Ancestries Reported - Other (%)
Educational Attainment - No schooling completed (%)
Educational Attainment - Less than high school (%)
Educational Attainment - High school or equivalent (%)
Educational Attainment - Less than 1 year of college (%)
Educational Attainment - 1 or more years of college (%)
Educational Attainment - Associate degree (%)
Educational Attainment - Bachelor's degree (%)
Educational Attainment - Master's degree (%)
Educational Attainment - Professional school degree (%)
Educational Attainment - Doctorate degree (%)
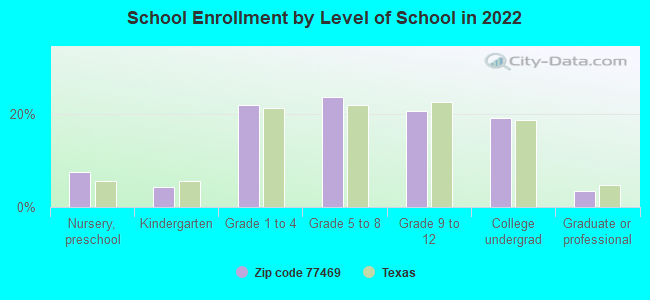
School Enrollment - Nursery, preschool (%)
School Enrollment - Kindergarten (%)
School Enrollment - Grade 1 to 4 (%)
School Enrollment - Grade 5 to 8 (%)
School Enrollment - Grade 9 to 12 (%)
School Enrollment - College undergrad (%)
School Enrollment - Graduate or professional (%)
School Enrollment - Not enrolled in school (%)
School enrollment - Public schools (%)
School enrollment - Private schools (%)
School enrollment - Not enrolled (%)
Median number of rooms in houses and condos
Median number of rooms in apartments
Housing units lacking complete plumbing facilities (%)
Housing units lacking complete kitchen facilities (%)
Density of houses
Urban houses (%)
Rural houses (%)
Households with people 60 years and over (%)
Households with people 65 years and over (%)
Households with people 75 years and over (%)
Households with one or more nonrelatives (%)
Households with no nonrelatives (%)
Population in households (%)
Family households (%)
Nonfamily households (%)
Population in families (%)
Family households with own children (%)
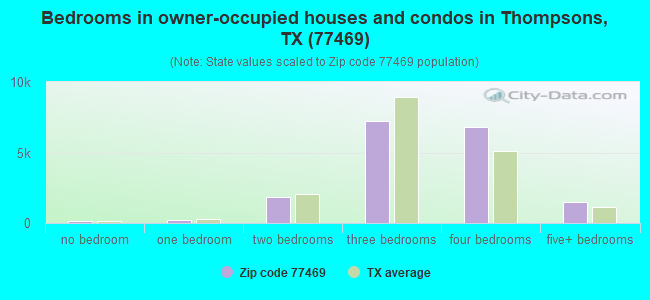
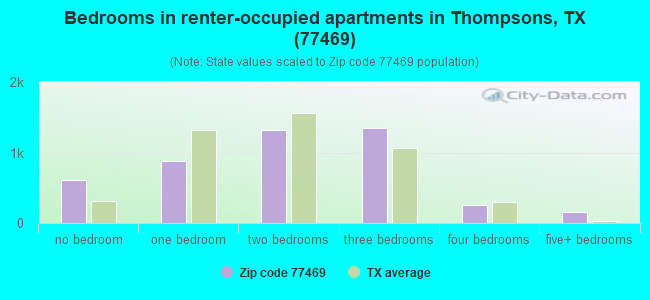
Median number of bedrooms in owner occupied houses
Mean number of bedrooms in owner occupied houses
Median number of bedrooms in renter occupied houses
Mean number of bedrooms in renter occupied houses
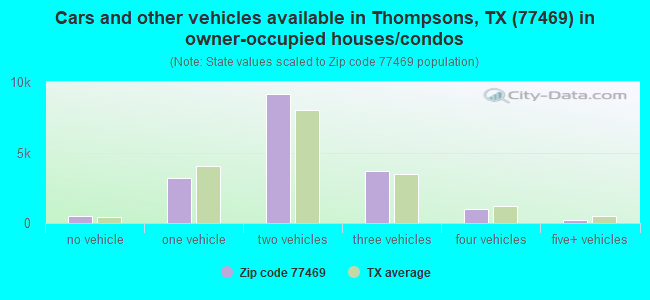
Median number of vehichles in owner occupied houses
Mean number of vehichles in owner occupied houses
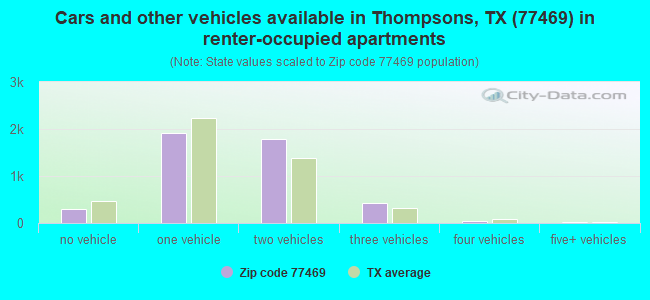
Median number of vehichles in renter occupied houses
Mean number of vehichles in renter occupied houses
Mortgage status - with mortgage (%)
Mortgage status - with second mortgage (%)
Mortgage status - with home equity loan (%)
Mortgage status - with both second mortgage and home equity loan (%)
Mortgage status - without a mortgage (%)
Average family size
Average family size - White
Average family size - Black or African American
Average family size - Asian
Average family size - Hispanic or Latino
Average family size - American Indian and Alaska Native
Average family size - Multirace
Average family size - Other Race
Geographical mobility - Same house 1 year ago (%)
Geographical mobility - Moved within same county (%)
Geographical mobility - Moved from different county within same state (%)
Geographical mobility - Moved from different state (%)
Geographical mobility - Moved from abroad (%)
Place of birth - Born in state of residence (%)
Place of birth - Born in other state (%)
Place of birth - Native, outside of US (%)
Place of birth - Foreign born (%)
Housing units in structures - 1, detached (%)
Housing units in structures - 1, attached (%)
Housing units in structures - 2 (%)
Housing units in structures - 3 or 4 (%)
Housing units in structures - 5 to 9 (%)
Housing units in structures - 10 to 19 (%)
Housing units in structures - 20 to 49 (%)
Housing units in structures - 50 or more (%)
Housing units in structures - Mobile home (%)
Housing units in structures - Boat, RV, van, etc. (%)
House/condo owner moved in on average (years ago)
Renter moved in on average (years ago)
Year householder moved into unit - Moved in 1999 to March 2000 (%)
Year householder moved into unit - Moved in 1995 to 1998 (%)
Year householder moved into unit - Moved in 1990 to 1994 (%)
Year householder moved into unit - Moved in 1980 to 1989 (%)
Year householder moved into unit - Moved in 1970 to 1979 (%)
Year householder moved into unit - Moved in 1969 or earlier (%)
Means of transportation to work - Drove car alone (%)
Means of transportation to work - Carpooled (%)
Means of transportation to work - Public transportation (%)
Means of transportation to work - Bus or trolley bus (%)
Means of transportation to work - Streetcar or trolley car (%)
Means of transportation to work - Subway or elevated (%)
Means of transportation to work - Railroad (%)
Means of transportation to work - Ferryboat (%)
Means of transportation to work - Taxicab (%)
Means of transportation to work - Motorcycle (%)
Means of transportation to work - Bicycle (%)
Means of transportation to work - Walked (%)
Means of transportation to work - Other means (%)
Working at home (%)
Industry diversity
Most Common Industries - Agriculture, forestry, fishing and hunting, and mining (%)
Most Common Industries - Agriculture, forestry, fishing and hunting (%)
Most Common Industries - Mining, quarrying, and oil and gas extraction (%)
Most Common Industries - Construction (%)
Most Common Industries - Manufacturing (%)
Most Common Industries - Wholesale trade (%)
Most Common Industries - Retail trade (%)
Most Common Industries - Transportation and warehousing, and utilities (%)
Most Common Industries - Transportation and warehousing (%)
Most Common Industries - Utilities (%)
Most Common Industries - Information (%)
Most Common Industries - Finance and insurance, and real estate and rental and leasing (%)
Most Common Industries - Finance and insurance (%)
Most Common Industries - Real estate and rental and leasing (%)
Most Common Industries - Professional, scientific, and management, and administrative and waste management services (%)
Most Common Industries - Professional, scientific, and technical services (%)
Most Common Industries - Management of companies and enterprises (%)
Most Common Industries - Administrative and support and waste management services (%)
Most Common Industries - Educational services, and health care and social assistance (%)
Most Common Industries - Educational services (%)
Most Common Industries - Health care and social assistance (%)
Most Common Industries - Arts, entertainment, and recreation, and accommodation and food services (%)
Most Common Industries - Arts, entertainment, and recreation (%)
Most Common Industries - Accommodation and food services (%)
Most Common Industries - Other services, except public administration (%)
Most Common Industries - Public administration (%)
Occupation diversity
Most Common Occupations - Management, business, science, and arts occupations (%)
Most Common Occupations - Management, business, and financial occupations (%)
Most Common Occupations - Management occupations (%)
Most Common Occupations - Business and financial operations occupations (%)
Most Common Occupations - Computer, engineering, and science occupations (%)
Most Common Occupations - Computer and mathematical occupations (%)
Most Common Occupations - Architecture and engineering occupations (%)
Most Common Occupations - Life, physical, and social science occupations (%)
Most Common Occupations - Education, legal, community service, arts, and media occupations (%)
Most Common Occupations - Community and social service occupations (%)
Most Common Occupations - Legal occupations (%)
Most Common Occupations - Education, training, and library occupations (%)
Most Common Occupations - Arts, design, entertainment, sports, and media occupations (%)
Most Common Occupations - Healthcare practitioners and technical occupations (%)
Most Common Occupations - Health diagnosing and treating practitioners and other technical occupations (%)
Most Common Occupations - Health technologists and technicians (%)
Most Common Occupations - Service occupations (%)
Most Common Occupations - Healthcare support occupations (%)
Most Common Occupations - Protective service occupations (%)
Most Common Occupations - Fire fighting and prevention, and other protective service workers including supervisors (%)
Most Common Occupations - Law enforcement workers including supervisors (%)
Most Common Occupations - Food preparation and serving related occupations (%)
Most Common Occupations - Building and grounds cleaning and maintenance occupations (%)
Most Common Occupations - Personal care and service occupations (%)
Most Common Occupations - Sales and office occupations (%)
Most Common Occupations - Sales and related occupations (%)
Most Common Occupations - Office and administrative support occupations (%)
Most Common Occupations - Natural resources, construction, and maintenance occupations (%)
Most Common Occupations - Farming, fishing, and forestry occupations (%)
Most Common Occupations - Construction and extraction occupations (%)
Most Common Occupations - Installation, maintenance, and repair occupations (%)
Most Common Occupations - Production, transportation, and material moving occupations (%)
Most Common Occupations - Production occupations (%)
Most Common Occupations - Transportation occupations (%)
Most Common Occupations - Material moving occupations (%)
People in Group quarters - Institutionalized population (%)
People in Group quarters - Correctional institutions (%)
People in Group quarters - Federal prisons and detention centers (%)
People in Group quarters - Halfway houses (%)
People in Group quarters - Local jails and other confinement facilities (including police lockups) (%)
People in Group quarters - Military disciplinary barracks (%)
People in Group quarters - State prisons (%)
People in Group quarters - Other types of correctional institutions (%)
People in Group quarters - Nursing homes (%)
People in Group quarters - Hospitals/wards, hospices, and schools for the handicapped (%)
People in Group quarters - Hospitals/wards and hospices for chronically ill (%)
People in Group quarters - Hospices or homes for chronically ill (%)
People in Group quarters - Military hospitals or wards for chronically ill (%)
People in Group quarters - Other hospitals or wards for chronically ill (%)
People in Group quarters - Hospitals or wards for drug/alcohol abuse (%)
People in Group quarters - Mental (Psychiatric) hospitals or wards (%)
People in Group quarters - Schools, hospitals, or wards for the mentally retarded (%)
People in Group quarters - Schools, hospitals, or wards for the physically handicapped (%)
People in Group quarters - Institutions for the deaf (%)
People in Group quarters - Institutions for the blind (%)
People in Group quarters - Orthopedic wards and institutions for the physically handicapped (%)
People in Group quarters - Wards in general hospitals for patients who have no usual home elsewhere (%)
People in Group quarters - Wards in military hospitals for patients who have no usual home elsewhere (%)
People in Group quarters - Juvenile institutions (%)
People in Group quarters - Long-term care (%)
People in Group quarters - Homes for abused, dependent, and neglected children (%)
People in Group quarters - Residential treatment centers for emotionally disturbed children (%)
People in Group quarters - Training schools for juvenile delinquents (%)
People in Group quarters - Short-term care, detention or diagnostic centers for delinquent children (%)
People in Group quarters - Type of juvenile institution unknown (%)
People in Group quarters - Noninstitutionalized population (%)
People in Group quarters - College dormitories (includes college quarters off campus) (%)
People in Group quarters - Military quarters (%)
People in Group quarters - On base (%)
People in Group quarters - Barracks, unaccompanied personnel housing (UPH), (Enlisted/Officer), ;and similar group living quarters for military personnel (%)
People in Group quarters - Transient quarters for temporary residents (%)
People in Group quarters - Military ships (%)
People in Group quarters - Group homes (%)
People in Group quarters - Homes or halfway houses for drug/alcohol abuse (%)
People in Group quarters - Homes for the mentally ill (%)
People in Group quarters - Homes for the mentally retarded (%)
People in Group quarters - Homes for the physically handicapped (%)
People in Group quarters - Other group homes (%)
People in Group quarters - Religious group quarters (%)
People in Group quarters - Dormitories (%)
People in Group quarters - Agriculture workers' dormitories on farms (%)
People in Group quarters - Job Corps and vocational training facilities (%)
People in Group quarters - Other workers' dormitories (%)
People in Group quarters - Crews of maritime vessels (%)
People in Group quarters - Other nonhousehold living situations (%)
People in Group quarters - Other noninstitutional group quarters (%)
Residents speaking English at home (%)
Residents speaking English at home - Born in the United States (%)
Residents speaking English at home - Native, born elsewhere (%)
Residents speaking English at home - Foreign born (%)
Residents speaking Spanish at home (%)
Residents speaking Spanish at home - Born in the United States (%)
Residents speaking Spanish at home - Native, born elsewhere (%)
Residents speaking Spanish at home - Foreign born (%)
Residents speaking other language at home (%)
Residents speaking other language at home - Born in the United States (%)
Residents speaking other language at home - Native, born elsewhere (%)
Residents speaking other language at home - Foreign born (%)
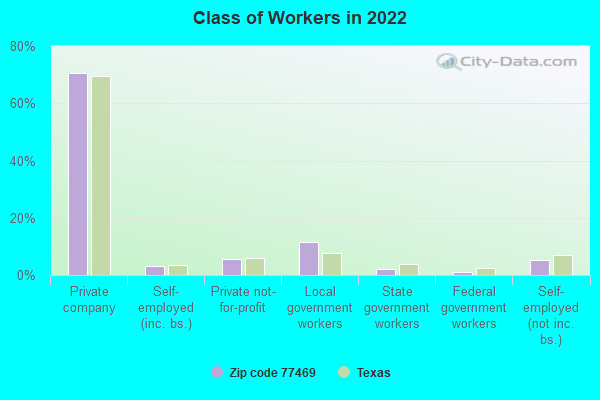
Class of Workers - Employee of private company (%)
Class of Workers - Self-employed in own incorporated business (%)
Class of Workers - Private not-for-profit wage and salary workers (%)
Class of Workers - Local government workers (%)
Class of Workers - State government workers (%)
Class of Workers - Federal government workers (%)
Class of Workers - Self-employed workers in own not incorporated business and Unpaid family workers (%)
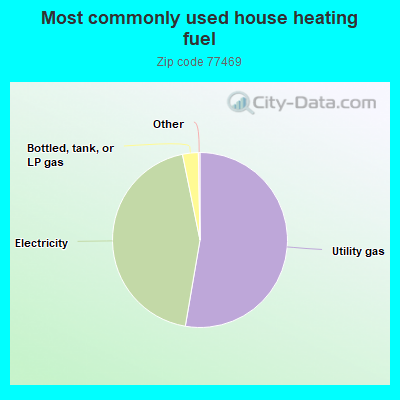
House heating fuel used in houses and condos - Utility gas (%)
House heating fuel used in houses and condos - Bottled, tank, or LP gas (%)
House heating fuel used in houses and condos - Electricity (%)
House heating fuel used in houses and condos - Fuel oil, kerosene, etc. (%)
House heating fuel used in houses and condos - Coal or coke (%)
House heating fuel used in houses and condos - Wood (%)
House heating fuel used in houses and condos - Solar energy (%)
House heating fuel used in houses and condos - Other fuel (%)
House heating fuel used in houses and condos - No fuel used (%)
House heating fuel used in apartments - Utility gas (%)
House heating fuel used in apartments - Bottled, tank, or LP gas (%)
House heating fuel used in apartments - Electricity (%)
House heating fuel used in apartments - Fuel oil, kerosene, etc. (%)
House heating fuel used in apartments - Coal or coke (%)
House heating fuel used in apartments - Wood (%)
House heating fuel used in apartments - Solar energy (%)
House heating fuel used in apartments - Other fuel (%)
House heating fuel used in apartments - No fuel used (%)
Armed forces status - In Armed Forces (%)
Armed forces status - Civilian (%)
Armed forces status - Civilian - Veteran (%)
Armed forces status - Civilian - Nonveteran (%)
Fatal accidents locations in years 2005-2021
Fatal accidents locations in 2005
Fatal accidents locations in 2006
Fatal accidents locations in 2007
Fatal accidents locations in 2008
Fatal accidents locations in 2009
Fatal accidents locations in 2010
Fatal accidents locations in 2011
Fatal accidents locations in 2012
Fatal accidents locations in 2013
Fatal accidents locations in 2014
Fatal accidents locations in 2015
Fatal accidents locations in 2016
Fatal accidents locations in 2017
Fatal accidents locations in 2018
Fatal accidents locations in 2019
Fatal accidents locations in 2020
Fatal accidents locations in 2021
Alcohol use - People drinking some alcohol every month (%)
Alcohol use - People not drinking at all (%)
Alcohol use - Average days/month drinking alcohol
Alcohol use - Average drinks/week
Alcohol use - Average days/year people drink much
Audiometry - Average condition of hearing (%)
Audiometry - People that can hear a whisper from across a quiet room (%)
Audiometry - People that can hear normal voice from across a quiet room (%)
Audiometry - Ears ringing, roaring, buzzing (%)
Audiometry - Had a job exposure to loud noise (%)
Audiometry - Had off-work exposure to loud noise (%)
Blood Pressure & Cholesterol - Has high blood pressure (%)
Blood Pressure & Cholesterol - Checking blood pressure at home (%)
Blood Pressure & Cholesterol - Frequently checking blood cholesterol (%)
Blood Pressure & Cholesterol - Has high cholesterol level (%)
Consumer Behavior - Money monthly spent on food at supermarket/grocery store
Consumer Behavior - Money monthly spent on food at other stores
Consumer Behavior - Money monthly spent on eating out
Consumer Behavior - Money monthly spent on carryout/delivered foods
Consumer Behavior - Income spent on food at supermarket/grocery store (%)
Consumer Behavior - Income spent on food at other stores (%)
Consumer Behavior - Income spent on eating out (%)
Consumer Behavior - Income spent on carryout/delivered foods (%)
Current Health Status - General health condition (%)
Current Health Status - Blood donors (%)
Current Health Status - Has blood ever tested for HIV virus (%)
Current Health Status - Left-handed people (%)
Dermatology - People using sunscreen (%)
Diabetes - Diabetics (%)
Diabetes - Had a blood test for high blood sugar (%)
Diabetes - People taking insulin (%)
Diet Behavior & Nutrition - Diet health (%)
Diet Behavior & Nutrition - Milk product consumption (# of products/month)
Diet Behavior & Nutrition - Meals not home prepared (#/week)
Diet Behavior & Nutrition - Meals from fast food or pizza place (#/week)
Diet Behavior & Nutrition - Ready-to-eat foods (#/month)
Diet Behavior & Nutrition - Frozen meals/pizza (#/month)
Drug Use - People that ever used marijuana or hashish (%)
Drug Use - Ever used hard drugs (%)
Drug Use - Ever used any form of cocaine (%)
Drug Use - Ever used heroin (%)
Drug Use - Ever used methamphetamine (%)
Health Insurance - People covered by health insurance (%)
Kidney Conditions-Urology - Avg. # of times urinating at night
Medical Conditions - People with asthma (%)
Medical Conditions - People with anemia (%)
Medical Conditions - People with psoriasis (%)
Medical Conditions - People with overweight (%)
Medical Conditions - Elderly people having difficulties in thinking or remembering (%)
Medical Conditions - People who ever received blood transfusion (%)
Medical Conditions - People having trouble seeing even with glass/contacts (%)
Medical Conditions - People with arthritis (%)
Medical Conditions - People with gout (%)
Medical Conditions - People with congestive heart failure (%)
Medical Conditions - People with coronary heart disease (%)
Medical Conditions - People with angina pectoris (%)
Medical Conditions - People who ever had heart attack (%)
Medical Conditions - People who ever had stroke (%)
Medical Conditions - People with emphysema (%)
Medical Conditions - People with thyroid problem (%)
Medical Conditions - People with chronic bronchitis (%)
Medical Conditions - People with any liver condition (%)
Medical Conditions - People who ever had cancer or malignancy (%)
Mental Health - People who have little interest in doing things (%)
Mental Health - People feeling down, depressed, or hopeless (%)
Mental Health - People who have trouble sleeping or sleeping too much (%)
Mental Health - People feeling tired or having little energy (%)
Mental Health - People with poor appetite or overeating (%)
Mental Health - People feeling bad about themself (%)
Mental Health - People who have trouble concentrating on things (%)
Mental Health - People moving or speaking slowly or too fast (%)
Mental Health - People having thoughts they would be better off dead (%)
Oral Health - Average years since last visit a dentist
Oral Health - People embarrassed because of mouth (%)
Oral Health - People with gum disease (%)
Oral Health - General health of teeth and gums (%)
Oral Health - Average days a week using dental floss/device
Oral Health - Average days a week using mouthwash for dental problem
Oral Health - Average number of teeth
Pesticide Use - Households using pesticides to control insects (%)
Pesticide Use - Households using pesticides to kill weeds (%)
Physical Activity - People doing vigorous-intensity work activities (%)
Physical Activity - People doing moderate-intensity work activities (%)
Physical Activity - People walking or bicycling (%)
Physical Activity - People doing vigorous-intensity recreational activities (%)
Physical Activity - People doing moderate-intensity recreational activities (%)
Physical Activity - Average hours a day doing sedentary activities
Physical Activity - Average hours a day watching TV or videos
Physical Activity - Average hours a day using computer
Physical Functioning - People having limitations keeping them from working (%)
Physical Functioning - People limited in amount of work they can do (%)
Physical Functioning - People that need special equipment to walk (%)
Physical Functioning - People experiencing confusion/memory problems (%)
Physical Functioning - People requiring special healthcare equipment (%)
Prescription Medications - Average number of prescription medicines taking
Preventive Aspirin Use - Adults 40+ taking low-dose aspirin (%)
Reproductive Health - Vaginal deliveries (%)
Reproductive Health - Cesarean deliveries (%)
Reproductive Health - Deliveries resulted in a live birth (%)
Reproductive Health - Pregnancies resulted in a delivery (%)
Reproductive Health - Women breastfeeding newborns (%)
Reproductive Health - Women that had a hysterectomy (%)
Reproductive Health - Women that had both ovaries removed (%)
Reproductive Health - Women that have ever taken birth control pills (%)
Reproductive Health - Women taking birth control pills (%)
Reproductive Health - Women that have ever used Depo-Provera or injectables (%)
Reproductive Health - Women that have ever used female hormones (%)
Sexual Behavior - People 18+ that ever had sex (vaginal, anal, or oral) (%)
Sexual Behavior - Males 18+ that ever had vaginal sex with a woman (%)
Sexual Behavior - Males 18+ that ever performed oral sex on a woman (%)
Sexual Behavior - Males 18+ that ever had anal sex with a woman (%)
Sexual Behavior - Males 18+ that ever had any sex with a man (%)
Sexual Behavior - Females 18+ that ever had vaginal sex with a man (%)
Sexual Behavior - Females 18+ that ever performed oral sex on a man (%)
Sexual Behavior - Females 18+ that ever had anal sex with a man (%)
Sexual Behavior - Females 18+ that ever had any kind of sex with a woman (%)
Sexual Behavior - Average age people first had sex
Sexual Behavior - Average number of female sex partners in lifetime (males 18+)
Sexual Behavior - Average number of female vaginal sex partners in lifetime (males 18+)
Sexual Behavior - Average age people first performed oral sex on a woman (18+)
Sexual Behavior - Average number of woman performed oral sex on in lifetime (18+)
Sexual Behavior - Average number of male sex partners in lifetime (males 18+)
Sexual Behavior - Average number of male anal sex partners in lifetime (males 18+)
Sexual Behavior - Average age people first performed oral sex on a man (18+)
Sexual Behavior - Average number of male oral sex partners in lifetime (18+)
Sexual Behavior - People using protection when performing oral sex (%)
Sexual Behavior - Average number of times people have vaginal or anal sex a year
Sexual Behavior - People having sex without condom (%)
Sexual Behavior - Average number of male sex partners in lifetime (females 18+)
Sexual Behavior - Average number of male vaginal sex partners in lifetime (females 18+)
Sexual Behavior - Average number of female sex partners in lifetime (females 18+)
Sexual Behavior - Circumcised males 18+ (%)
Sleep Disorders - Average hours sleeping at night
Sleep Disorders - People that has trouble sleeping (%)
Smoking-Cigarette Use - People smoking cigarettes (%)
Taste & Smell - People 40+ having problems with smell (%)
Taste & Smell - People 40+ having problems with taste (%)
Taste & Smell - People 40+ that ever had wisdom teeth removed (%)
Taste & Smell - People 40+ that ever had tonsils teeth removed (%)
Taste & Smell - People 40+ that ever had a loss of consciousness because of a head injury (%)
Taste & Smell - People 40+ that ever had a broken nose or other serious injury to face or skull (%)
Taste & Smell - People 40+ that ever had two or more sinus infections (%)
Weight - Average height (inches)
Weight - Average weight (pounds)
Weight - Average BMI
Weight - People that are obese (%)
Weight - People that ever were obese (%)
Weight - People trying to lose weight (%)
Urban population: 50,149
Rural population: 12,460
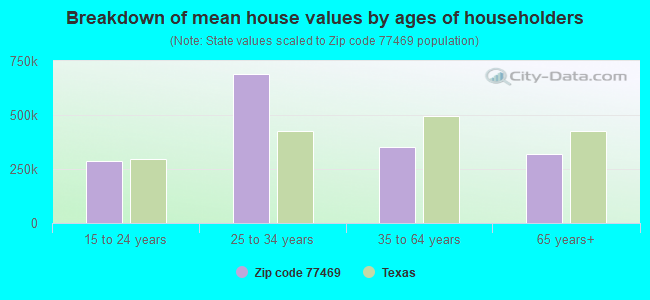
Estimated median house/condo value in 2022: $323,653
77469:
$323,653Texas:
$275,400
According to our research of Texas and other state lists, there were 81 registered sex offenders living in 77469 zip code as of April 27, 2024 . The ratio of all residents to sex offenders in zip code 77469 is 545 to 1.The ratio of registered sex offenders to all residents in this zip code is lower than the state average.
Median resident age: This zip code:
35.8 yearsTexas median age:
35.6 years
Average household size: This zip code:
2.7 peopleTexas:
2.6 people
Averages for the 2020 tax year for zip code 77469, filed in 2021:
Average Adjusted Gross Income (AGI) in 2020: $71,226 (Individual Income Tax Returns) Here:
$71,226State:
$77,054
Salary/wage: $63,066 (reported on 83.9% of returns )Here:
$63,066State:
$62,766
(% of AGI for various income ranges: 1222.6% for AGIs below $25k , 3673.0% for AGIs $25k-50k , 6722.2% for AGIs $50k-75k , 9740.0% for AGIs $75k-100k , 17389.4% for AGIs $100k-200k , 58685.0% for AGIs over 200k ) Taxable interest for individuals: $1,729 (reported on 22.0% of returns )This zip code:
$1,729Texas:
$2,665
(% of AGI for various income ranges: 9.3% for AGIs below $25k , 16.5% for AGIs $25k-50k , 32.8% for AGIs $50k-75k , 54.6% for AGIs $75k-100k , 88.1% for AGIs $100k-200k , 927.5% for AGIs over 200k ) Ordinary dividends: $5,262 (reported on 15.0% of returns )(% of AGI for various income ranges: 13.3% for AGIs below $25k , 23.5% for AGIs $25k-50k , 52.2% for AGIs $50k-75k , 104.0% for AGIs $75k-100k , 223.9% for AGIs $100k-200k , 2012.1% for AGIs over 200k ) Net capital gain/loss in AGI: +$20,152 (reported on 15.0% of returns )Here:
+$20,152State:
+$39,590
(% of AGI for various income ranges: 5.4% for AGIs below $25k , 17.3% for AGIs $25k-50k , 42.9% for AGIs $50k-75k , 132.1% for AGIs $75k-100k , 353.8% for AGIs $100k-200k , 14566.7% for AGIs over 200k ) Profit/loss from business: +$6,437 (reported on 23.1% of returns )Here:
+$6,437State:
+$10,888
(% of AGI for various income ranges: 93.1% for AGIs below $25k , 55.3% for AGIs $25k-50k , 149.7% for AGIs $50k-75k , 179.7% for AGIs $75k-100k , 370.3% for AGIs $100k-200k , 2777.7% for AGIs over 200k ) Taxable individual retirement arrangement distribution: $28,895 (reported on 7.0% of returns )77469:
$28,895Texas:
$24,740
(% of AGI for various income ranges: 33.8% for AGIs below $25k , 74.1% for AGIs $25k-50k , 136.2% for AGIs $50k-75k , 318.6% for AGIs $75k-100k , 752.9% for AGIs $100k-200k , 3666.0% for AGIs over 200k ) Self-employed (Keogh) retirement plans: $19,062 (reported on 0.3% of returns )77469:
$19,062Texas:
$29,298
(% of AGI for various income ranges: 19.5% for AGIs $100k-200k , 197.1% for AGIs over 200k ) Total itemized deductions: $32,429 (reported on 11.2% of returns )Here:
$32,429State:
$40,428
(% of AGI for various income ranges: 50.2% for AGIs below $25k , 197.0% for AGIs $25k-50k , 531.4% for AGIs $50k-75k , 766.3% for AGIs $75k-100k , 1050.5% for AGIs $100k-200k , 5023.3% for AGIs over 200k ) Charity contributions: $11,352 (reported on 8.8% of returns )Here:
$11,352State:
$18,201
(% of AGI for various income ranges: 4.4% for AGIs below $25k , 34.8% for AGIs $25k-50k , 102.5% for AGIs $50k-75k , 177.9% for AGIs $75k-100k , 310.1% for AGIs $100k-200k , 2078.5% for AGIs over 200k ) Taxes paid: $8,702 (reported on 10.7% of returns )(% of AGI for various income ranges: 12.0% for AGIs below $25k , 55.6% for AGIs $25k-50k , 172.4% for AGIs $50k-75k , 218.3% for AGIs $75k-100k , 268.5% for AGIs $100k-200k , 944.0% for AGIs over 200k ) Earned income credit: $2,538 (reported on 18.1% of returns )(% of AGI for various income ranges: 122.6% for AGIs below $25k , 89.7% for AGIs $25k-50k , 1.6% for AGIs $50k-75k ) Percentage of individuals using paid preparers for their 2020 taxes: 91.2%(% for various income ranges: 89.4% for AGIs below $25k , 92.3% for AGIs $25k-50k , 91.2% for AGIs $50k-75k , 92.4% for AGIs $75k-100k , 92.1% for AGIs $100k-200k , 91.0% for AGIs over 200k )
Averages for the 2012 tax year for zip code 77469, filed in 2013:
Average Adjusted Gross Income (AGI) in 2012: $64,838 (Individual Income Tax Returns) Here:
$64,838State:
$65,384
Salary/wage: $55,747 (reported on 88.5% of returns )Here:
$55,747State:
$52,524
(% of AGI for various income ranges: 81.3% for AGIs below $25k , 87.5% for AGIs $25k-50k , 85.0% for AGIs $50k-75k , 82.9% for AGIs $75k-100k , 84.0% for AGIs $100k-200k , 52.9% for AGIs over 200k ) Taxable interest for individuals: $1,250 (reported on 24.4% of returns )This zip code:
$1,250Texas:
$2,372
(% of AGI for various income ranges: 0.6% for AGIs below $25k , 0.4% for AGIs $25k-50k , 0.3% for AGIs $50k-75k , 0.7% for AGIs $75k-100k , 0.4% for AGIs $100k-200k , 0.6% for AGIs over 200k ) Ordinary dividends: $4,741 (reported on 13.2% of returns )(% of AGI for various income ranges: 1.1% for AGIs below $25k , 0.5% for AGIs $25k-50k , 0.6% for AGIs $50k-75k , 1.1% for AGIs $75k-100k , 0.7% for AGIs $100k-200k , 1.6% for AGIs over 200k ) Net capital gain/loss in AGI: +$19,563 (reported on 10.8% of returns )Here:
+$19,563State:
+$35,319
(% of AGI for various income ranges: 0.1% for AGIs $25k-50k , 0.3% for AGIs $50k-75k , 0.3% for AGIs $75k-100k , 0.7% for AGIs $100k-200k , 11.4% for AGIs over 200k ) Profit/loss from business: +$13,414 (reported on 19.8% of returns )Here:
+$13,414State:
+$13,732
(% of AGI for various income ranges: 10.8% for AGIs below $25k , 2.9% for AGIs $25k-50k , 3.0% for AGIs $50k-75k , 2.6% for AGIs $75k-100k , 2.6% for AGIs $100k-200k , 5.6% for AGIs over 200k ) Taxable individual retirement arrangement distribution: $18,654 (reported on 6.5% of returns )77469:
$18,654Texas:
$19,511
(% of AGI for various income ranges: 1.3% for AGIs below $25k , 1.6% for AGIs $25k-50k , 1.9% for AGIs $50k-75k , 2.2% for AGIs $75k-100k , 2.6% for AGIs $100k-200k , 1.3% for AGIs over 200k ) Self-employment retirement plans: $23,571 (reported on 0.4% of returns )77469:
$23,571Texas:
$23,938
(% of AGI for various income ranges: 0.1% for AGIs $25k-50k , 0.1% for AGIs $100k-200k , 0.4% for AGIs over 200k ) Total itemized deductions: $21,326 (18% of AGI, reported on 33.1% of returns )Here:
$21,326State:
$24,724
Here:
18.0% of AGIState:
15.9% of AGI
(% of AGI for various income ranges: 7.6% for AGIs below $25k , 11.2% for AGIs $25k-50k , 13.9% for AGIs $50k-75k , 13.8% for AGIs $75k-100k , 12.7% for AGIs $100k-200k , 6.8% for AGIs over 200k ) Charity contributions: $5,006 (reported on 25.4% of returns )(% of AGI for various income ranges: 0.6% for AGIs below $25k , 1.3% for AGIs $25k-50k , 1.9% for AGIs $50k-75k , 2.2% for AGIs $75k-100k , 2.4% for AGIs $100k-200k , 2.2% for AGIs over 200k ) Taxes paid: $6,422 (reported on 32.4% of returns )(% of AGI for various income ranges: 1.8% for AGIs below $25k , 2.8% for AGIs $25k-50k , 3.8% for AGIs $50k-75k , 4.2% for AGIs $75k-100k , 4.1% for AGIs $100k-200k , 2.1% for AGIs over 200k ) Earned income credit: $2,552 (reported on 21.8% of returns )(% of AGI for various income ranges: 9.5% for AGIs below $25k , 1.4% for AGIs $25k-50k ) Percentage of individuals using paid preparers for their 2012 taxes: 51.4%(% for various income ranges: 52.1% for AGIs below $25k , 51.2% for AGIs $25k-50k , 49.4% for AGIs $50k-75k , 49.7% for AGIs $75k-100k , 49.1% for AGIs $100k-200k , 64.5% for AGIs over 200k )
Averages for the 2004 tax year for zip code 77469, filed in 2005:
Average Adjusted Gross Income (AGI) in 2004: $60,279 (Individual Income Tax Returns) Here:
$60,279State:
$47,881
Salary/wage: $55,825 (reported on 88.8% of returns )Here:
$55,825State:
$41,947
(% of AGI for various income ranges: 175.7% for AGIs below $10k , 83.4% for AGIs $10k-25k , 88.8% for AGIs $25k-50k , 87.8% for AGIs $50k-75k , 88.3% for AGIs $75k-100k , 75.8% for AGIs over 100k ) Taxable interest for individuals: $1,714 (reported on 39.7% of returns )This zip code:
$1,714Texas:
$2,255
(% of AGI for various income ranges: 5.3% for AGIs below $10k , 1.6% for AGIs $10k-25k , 1.0% for AGIs $25k-50k , 0.7% for AGIs $50k-75k , 0.7% for AGIs $75k-100k , 1.3% for AGIs over 100k ) Taxable dividends: $2,972 (reported on 22.5% of returns )(% of AGI for various income ranges: 8.2% for AGIs below $10k , 0.8% for AGIs $10k-25k , 0.6% for AGIs $25k-50k , 0.6% for AGIs $50k-75k , 0.5% for AGIs $75k-100k , 1.5% for AGIs over 100k ) Net capital gain/loss: +$8,164 (reported on 19.4% of returns )Here:
+$8,164State:
+$16,110
(% of AGI for various income ranges: -4.0% for AGIs below $10k , 0.3% for AGIs $10k-25k , 0.2% for AGIs $25k-50k , 0.7% for AGIs $50k-75k , 0.7% for AGIs $75k-100k , 4.7% for AGIs over 100k ) Profit/loss from business: +$11,354 (reported on 19.9% of returns )Here:
+$11,354State:
+$11,013
(% of AGI for various income ranges: 4.2% for AGIs below $10k , 7.1% for AGIs $10k-25k , 2.7% for AGIs $25k-50k , 2.8% for AGIs $50k-75k , 2.8% for AGIs $75k-100k , 4.2% for AGIs over 100k ) IRA payment deduction: $3,424 (reported on 2.3% of returns )(% of AGI for various income ranges: 0.5% for AGIs below $10k , 0.1% for AGIs $10k-25k , 0.2% for AGIs $25k-50k , 0.1% for AGIs $50k-75k , 0.1% for AGIs $75k-100k , 0.1% for AGIs over 100k ) Self-employed pension: $14,740 (reported on 1.0% of returns )Here:
$14,740Texas:
$16,401
(% of AGI for various income ranges: 0.1% for AGIs $25k-50k , 0.1% for AGIs $50k-75k , 0.1% for AGIs $75k-100k , 0.4% for AGIs over 100k ) Total itemized deductions: $19,714 (19% of AGI, reported on 40.7% of returns )Here:
$19,714State:
$19,631
Here:
19.3% of AGIState:
18.9% of AGI
(% of AGI for various income ranges: 17.3% for AGIs below $10k , 10.4% for AGIs $10k-25k , 14.1% for AGIs $25k-50k , 16.2% for AGIs $50k-75k , 16.1% for AGIs $75k-100k , 11.7% for AGIs over 100k ) Charity contributions deductions: $4,151 (4% of AGI, reported on 34.2% of returns )Here:
3.8% of AGIState:
4.2% of AGI
(% of AGI for various income ranges: 0.9% for AGIs below $10k , 0.9% for AGIs $10k-25k , 1.8% for AGIs $25k-50k , 2.1% for AGIs $50k-75k , 2.3% for AGIs $75k-100k , 2.8% for AGIs over 100k ) Total tax: $10,786 (reported on 75.2% of returns )77469:
$10,786State:
$9,058
(% of AGI for various income ranges: 5.9% for AGIs below $10k , 3.7% for AGIs $10k-25k , 6.1% for AGIs $25k-50k , 8.5% for AGIs $50k-75k , 10.2% for AGIs $75k-100k , 18.8% for AGIs over 100k ) Earned income credit: $1,974 (reported on 16.0% of returns )Percentage of individuals using paid preparers for their 2004 taxes: 51.6%(% for various income ranges: 44.3% for AGIs below $10k , 59.1% for AGIs $10k-25k , 54.2% for AGIs $25k-50k , 50.7% for AGIs $50k-75k , 46.3% for AGIs $75k-100k , 51.3% for AGIs over 100k )
Estimated median household income in 2022: This zip code:
$97,200Texas:
$72,284
Nearest zip codes: 77479 ,
77481 ,
77478 ,
77459 ,
77461 ,
77498 .
Thompsons Zip Code Map
Percentage of family households: This zip code:
56.9%Texas:
50.5%
Percentage of households with unmarried partners: This zip code:
3.3%Texas:
48.7%
Likely homosexual households (counted as self-reported same-sex unmarried-partner households)
Lesbian couples: 0.1% of all households Gay men: 0.0% of all households
Household received Food Stamps/SNAP in the past 12 months: 1,899Household did not receive Food Stamps/SNAP in the past 12 months: 20,232
Women who had a birth in the past 12 months: 1,252 (931 now married , 324 unmarried) Women who did not have a birth in the past 12 months: 13,929 (7,670 now married , 6,210 unmarried)
Housing units in zip code 77469 with a mortgage: 10,654 (305
second mortgage , 1
home equity loan , 306
both second mortgage and home equity loan )
Houses without a mortgage: 103
Median monthly owner costs for units with a mortgage: $2,104
Median monthly owner costs for units without a mortgage: $837
Residents with income below the poverty level in 2022:
This zip code:
5.6%Whole state:
14.0%
Residents with income below 50% of the poverty level in 2022:
This zip code:
2.9%Whole state:
7.4%
Median number of rooms in houses and condos: Median number of rooms in apartments:
Year house built (houses)
1,329 2020 or later11,122 2010 to 20194,845 2000 to 20091,214 1990 to 19991,601 1980 to 19891,711 1970 to 1979818 1960 to 1969617 1950 to 195978 1940 to 1949139 1939 or earlier
Zip code 77469 household income distribution in 2022 348 Less than $10,000497 $10,000 to $14,999414 $15,000 to $19,999515 $20,000 to $24,999933 $25,000 to $29,999449 $30,000 to $34,999633 $35,000 to $39,999601 $40,000 to $44,999737 $45,000 to $49,9991,202 $50,000 to $59,9991,683 $60,000 to $74,9993,473 $75,000 to $99,9992,742 $100,000 to $124,9991,953 $125,000 to $149,9993,048 $150,000 to $199,9992,791 $200,000 or moreEstimate of home value of owner-occupied houses/condos in 2022 in zip code 77469 214 Less than $10,000116 $10,000 to $14,99947 $15,000 to $19,99979 $20,000 to $24,99973 $25,000 to $29,99934 $30,000 to $34,9997 $35,000 to $39,99988 $40,000 to $49,99968 $50,000 to $59,99986 $60,000 to $69,999111 $70,000 to $79,99964 $80,000 to $89,999152 $90,000 to $99,999385 $100,000 to $124,999188 $125,000 to $149,999542 $150,000 to $174,9991,173 $175,000 to $199,9992,610 $200,000 to $249,9993,010 $250,000 to $299,9995,542 $300,000 to $399,9991,673 $400,000 to $499,9991,029 $500,000 to $749,999403 $750,000 to $999,999111 $1,500,000 to $1,999,999381 $2,000,000 or moreRent paid by renters in 2022 in zip code 77469 21 $150 to $19931 $250 to $2998 $450 to $49910 $500 to $549134 $600 to $64953 $650 to $699328 $700 to $74971 $750 to $799223 $800 to $899424 $900 to $999585 $1,000 to $1,249569 $1,250 to $1,4991,232 $1,500 to $1,999589 $2,000 to $2,4992 $2,500 to $2,999357 No cash rent
Median gross rent in 2022: $1,493.
Median price asked for vacant for-sale houses and condos in 2022: $244,392.
Estimated median house (or condo) value in 2022 for: White Non-Hispanic householders: $371,367Black or African American householders: $234,260American Indian or Alaska Native householders: $198,330Asian householders: $325,664Some other race householders: $194,594Two or more races householders: $303,244Hispanic or Latino householders: $205,516Estimated median house or condo value in 2022: $323,653
77469:
$323,653Texas:
$275,400
Lower value quartile - upper value quartile: $240,706 - $418,805
Mean price in 2022: Detached houses: $285,210Here:
$285,210State:
$369,058
Mobile homes: $95,004Here:
$95,004State:
$124,413
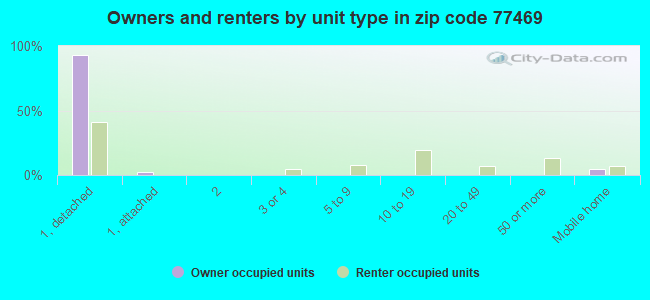
Housing units in structures:
One, detached: 18,268One, attached: 408Two: 393 or 4: 1965 to 9: 38010 to 19: 85020 to 49: 30550 or more: 667Mobile homes: 1,147Boats, RVs, vans, etc.: 75Unemployment : 3.9%
Means of transportation to work in zip code 77469 73.2% 22,748 Drove a car alone9.9% 3,066 Carpooled0.1% 34 Bus or trolley bus0.0% 14 Bicycle1.0% 309 Walked1.9% 594 Other means13.8% 4,295 Worked at homeTravel time to work (commute) in zip code 77469 449 Less than 5 minutes1,519 5 to 9 minutes3,026 10 to 14 minutes4,328 15 to 19 minutes2,950 20 to 24 minutes2,068 25 to 29 minutes3,616 30 to 34 minutes793 35 to 39 minutes1,772 40 to 44 minutes4,517 45 to 59 minutes1,253 60 to 89 minutes439 90 or more minutes
Percentage of zip code residents living and working in this county: 60.9%
Household type by relationship:
Households: 62,610
Male householders: 11,430 (1,987 living alone ), Female householders: 10,735 (2,587 living alone )12,203 spouses (12,179 opposite-sex spouses ), 1,737 unmarried partners , (1,620 opposite-sex unmarried partners ), 18,950 children (17,792 natural , 450 adopted , 708 stepchildren ), 1,662 grandchildren , 912 brothers or sisters , 1,141 parents , 0 foster children , 1,675 other relatives , 652 non-relatives In group quarters: 1,576 (-1 institutionalized population )
Size of family households: 6,101 2-persons , 3,656 3-persons , 4,412 4-persons , 1,538 5-persons , 586 6-persons , 357 7-or-more-persons
Size of nonfamily households: 4,573 1-person , 818 2-persons , 19 3-persons
10,645 married couples with children. single-parent households (610 men , 2,294 women ).
67.2% of residents of 77469 zip code speak English at home. of residents speak Spanish at home (69% very well, 14% well, 12% not well, 6% not at all ).of residents speak other Indo-European language at home (82% very well, 14% well, 2% not well, 2% not at all ).of residents speak Asian or Pacific Island language at home (55% very well, 28% well, 16% not well, 2% not at all ).of residents speak other language at home (91% very well, 8% well, 1% not well ).
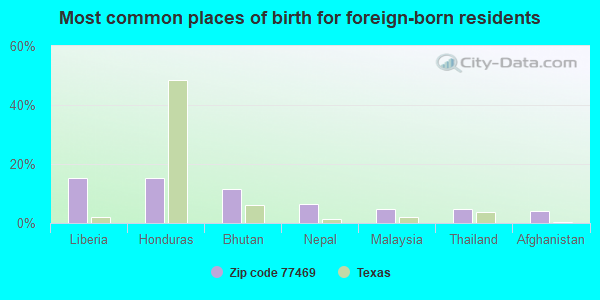
Foreign born population: 14,914 (23.8%)
(66.2%
of them are naturalized citizens )
This zip code:
23.8%Whole state:
17.2%
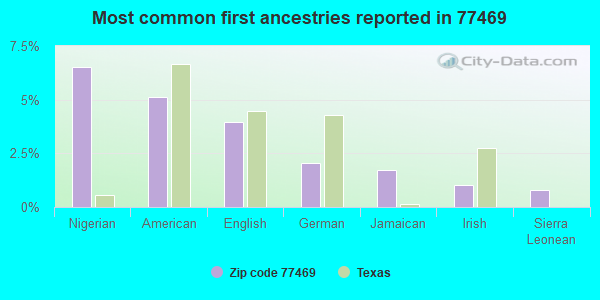
15% Liberia 15% Honduras 11% Bhutan 6% Nepal 5% Malaysia 5% Thailand 4% Afghanistan 7% Nigerian 5% American 4% English 2% German 2% Jamaican 1% Irish 1% Sierra Leonean
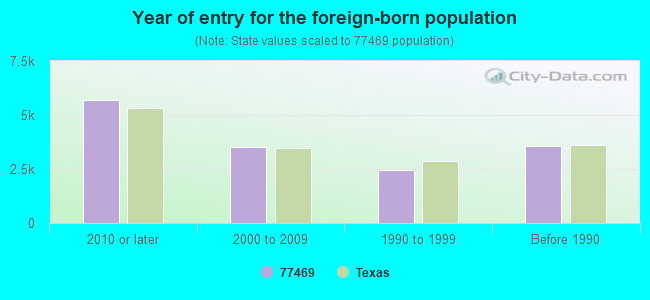
Year of entry for the foreign-born population
5,697 2010 or later 3,535 2000 to 2009 2,475 1990 to 1999 3,584 Before 1990
There are
220 Medical Specialists in Zip Code 77469 .
Facilities with environmental interests located in this zip code:
ARROYO SECO HISTORICAL PARK (1500F W. FMR 762 & DRY CREEK in RICHMOND, TX)
National Pollutant Discharge Elimination System NON-MAJOR (Tracking pollutant discharge elimination systems) - permit Business SIC classification: SEWERAGE SYSTEMSOrganizations: THE GEORGE FOUNDATION (CONTACT/OWNER)
Alternative names: GEORGE FOUNDATION, THE
ADDICKS SERVICES INCORPORATED (19710 FM 1093 in RICHMOND, TX)
Small Quantity Generators, between 100 kg and 1000 kg of hazardous waste/month (Resource Conservation and Recovery Act (tracking hazardous waste)) - notification Organizations: NORRISDAVID B (CONTACT/OPERATOR)
AMERICAN BULK CARRIERS INC (902 HWY 90 A in RICHMOND, TX)
TRANSPORTER (Resource Conservation and Recovery Act (tracking hazardous waste)) Organizations: POTTER GENE G DELAY WILLIAM G (CONTACT/OWNER)
Housing units lacking complete plumbing facilities: 1.2%
Housing units lacking complete kitchen facilities: 0.7%
52.7% Utility gas 44.1% Electricity 2.9% Bottled, tank, or LP gas
Population in 1990: 36,014. Population change in the 1990s: +8,632 (+24.0%).
Place of birth for U.S.-born residents:
This state: 35,013Northeast: 1,618Midwest: 3,675South: 4,790West: 2,260
52% of the 77469 zip code residents lived in the same house 5 years ago.
Out of people who lived in different houses, 46% lived in this county.
Out of people who lived in different counties, 50% lived in Texas.
83% of the 77469 zip code residents lived in the same house 1 year ago.
Out of people who lived in different houses, 41% moved from this county.
Out of people who lived in different houses, 44% moved from different county within same state.
Out of people who lived in different houses, 13% moved from different state.
Out of people who lived in different houses, 3% moved from abroad.
Private vs. public school enrollment:
Students in private schools in grades 1 to 8 (elementary and middle school): 530
Students in private schools in grades 9 to 12 (high school): 103
Students in private undergraduate colleges: 235
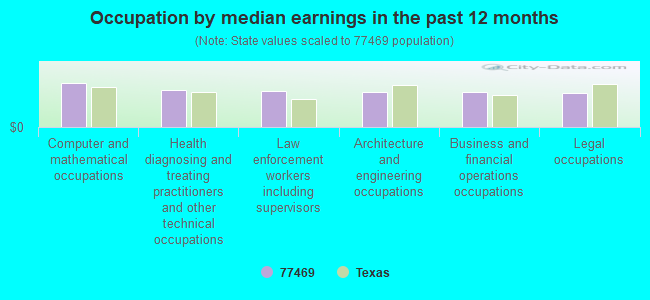
Occupation by median earnings in the past 12 months ($)
103,333 Computer and mathematical occupations 85,806 Health diagnosing and treating practitioners and other technical occupations 84,971 Law enforcement workers including supervisors 82,416 Architecture and engineering occupations 81,545 Business and financial operations occupations 79,584 Legal occupations
Companies with federal contracts located in this zip code (RICHMOND, TX):
BALANCING SYSTEMS GROUP, INC (1706 SABINE LANE; small business)
$60,965 with Navy for Machine Shop Sets, Kits, and Outfits. Signed on 2005-08-01. Completion date: 2005-11-01.
CARSAREZ JR,JOHNNY (7307 RED RIVER DR; small business)
$25,807 with Army for Fiber Optic Cables. Signed on 2005-03-04. Completion date: 2005-03-25.
B & S WARBIRDS, LLC (23 W KITTY HAWK; small business)
$12,000 with Army for Other Professional Services. Signed on 2003-03-10. Completion date: 2003-05-10.
LOLLEY, HELEN (5607 POWER LINE RD; small business)
$8,910 with Army for Recreation Site Maintenance Services (non-construction). Signed on 2006-02-16. Completion date: 2006-02-06.
Top industries in this zip code by the number of employees in 2005:
Health Care and Social Assistance: General Medical and Surgical Hospitals (500-999 employees: 1 establishment)Construction: Highway, Street, and Bridge Construction (100-249: 3, 5-9: 1)Accommodation and Food Services: Limited-Service Restaurants (50-99: 1, 20-49: 8, 10-19: 2, 5-9: 1, 1-4: 8)Accommodation and Food Services: Full-Service Restaurants (50-99: 1, 20-49: 5, 10-19: 4, 5-9: 2, 1-4: 3)Administrative and Support and Waste Management and Remediation Services: Landscaping Services (50-99: 1, 20-49: 3, 10-19: 2, 5-9: 4, 1-4: 7)Health Care and Social Assistance: Child Day Care Services (20-49: 5, 10-19: 3, 5-9: 2, 1-4: 1)Health Care and Social Assistance: Offices of Physicians (except Mental Health Specialists) (50-99: 1, 20-49: 1, 10-19: 1, 5-9: 10, 1-4: 14)
People in group quarters in 2010:
997 people in local jails and other municipal confinement facilities
419 people in state prisons
207 people in nursing facilities/skilled-nursing facilities
54 people in correctional facilities intended for juveniles
30 people in residential treatment centers for juveniles (non-correctional)
2 people in college/university student housing
People in group quarters in 2000:
2,162 people in state prisons
620 people in other nonhousehold living situations
218 people in nursing homes
64 people in short-term care, detention or diagnostic centers for delinquent children
49 people in other noninstitutional group quarters
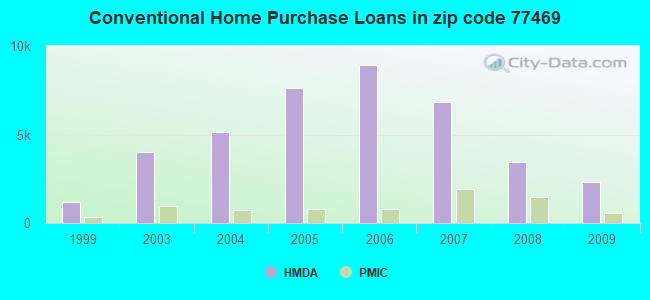
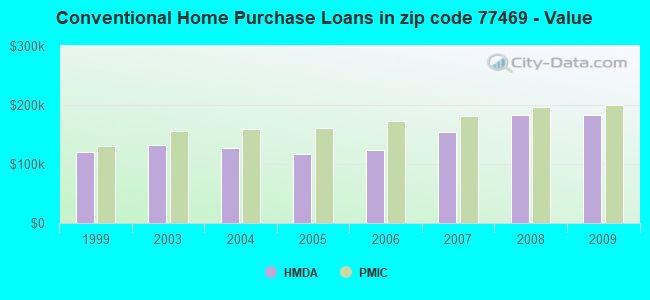
Home Mortgage Disclosure Act Aggregated Statistics For Year 2009(Based on 9 full and 22 partial tracts) A) FHA, FSA/RHS & VA B) Conventional C) Refinancings D) Home Improvement Loans F) Non-occupant Loans on G) Loans On Manufactured Number Average Value Number Average Value Number Average Value Number Average Value Number Average Value Number Average Value
LOANS ORIGINATED 2,467 $168,941 2,309 $183,734 3,393 $183,867 176 $68,409 223 $147,279 8 $67,322 APPLICATIONS APPROVED, NOT ACCEPTED 100 $165,770 192 $160,836 335 $179,300 47 $73,880 13 $115,051 3 $33,073 APPLICATIONS DENIED 408 $170,729 353 $204,105 1,545 $185,382 281 $46,866 85 $128,287 20 $70,096 APPLICATIONS WITHDRAWN 311 $169,282 370 $216,601 927 $178,733 69 $99,165 37 $129,333 6 $90,195 FILES CLOSED FOR INCOMPLETENESS 53 $167,461 62 $220,638 233 $192,694 26 $49,997 7 $140,443 1 $61,220
Aggregated Statistics For Year 2008(Based on 9 full and 22 partial tracts) A) FHA, FSA/RHS & VA B) Conventional C) Refinancings D) Home Improvement Loans E) Loans on Dwellings For 5+ Families F) Non-occupant Loans on G) Loans On Manufactured Number Average Value Number Average Value Number Average Value Number Average Value Number Average Value Number Average Value Number Average Value
LOANS ORIGINATED 1,915 $168,341 3,466 $182,977 1,413 $181,257 376 $52,154 8 $6,968,240 327 $140,029 11 $43,473 APPLICATIONS APPROVED, NOT ACCEPTED 88 $160,773 383 $188,370 296 $150,830 112 $47,149 0 $0 37 $172,753 12 $72,528 APPLICATIONS DENIED 341 $164,654 773 $192,930 1,438 $175,273 488 $37,989 0 $0 148 $178,684 32 $40,286 APPLICATIONS WITHDRAWN 263 $173,764 730 $174,997 611 $173,008 80 $61,699 0 $0 55 $157,523 1 $35,850 FILES CLOSED FOR INCOMPLETENESS 55 $177,870 148 $187,050 133 $189,768 28 $101,444 0 $0 16 $195,702 2 $37,515
Aggregated Statistics For Year 2007(Based on 9 full and 22 partial tracts) A) FHA, FSA/RHS & VA B) Conventional C) Refinancings D) Home Improvement Loans E) Loans on Dwellings For 5+ Families F) Non-occupant Loans on G) Loans On Manufactured Number Average Value Number Average Value Number Average Value Number Average Value Number Average Value Number Average Value Number Average Value
LOANS ORIGINATED 667 $154,398 6,822 $154,218 1,434 $163,722 458 $57,346 1 $555,150 542 $131,128 23 $40,983 APPLICATIONS APPROVED, NOT ACCEPTED 36 $141,386 927 $145,265 388 $162,785 164 $64,633 0 $0 84 $144,226 16 $51,062 APPLICATIONS DENIED 170 $152,862 1,477 $160,909 1,912 $165,056 658 $51,127 0 $0 191 $125,346 49 $38,137 APPLICATIONS WITHDRAWN 126 $165,515 1,263 $159,524 763 $161,691 104 $54,977 0 $0 104 $144,680 4 $62,185 FILES CLOSED FOR INCOMPLETENESS 9 $177,341 288 $187,158 290 $185,597 17 $170,392 0 $0 17 $162,732 0 $0
Aggregated Statistics For Year 2006(Based on 9 full and 22 partial tracts) A) FHA, FSA/RHS & VA B) Conventional C) Refinancings D) Home Improvement Loans E) Loans on Dwellings For 5+ Families F) Non-occupant Loans on G) Loans On Manufactured Number Average Value Number Average Value Number Average Value Number Average Value Number Average Value Number Average Value Number Average Value
LOANS ORIGINATED 609 $146,808 8,948 $124,239 1,321 $150,418 461 $51,150 0 $0 756 $113,420 28 $41,498 APPLICATIONS APPROVED, NOT ACCEPTED 23 $161,512 1,508 $113,548 383 $154,318 131 $39,783 0 $0 154 $107,577 22 $45,560 APPLICATIONS DENIED 90 $144,025 2,072 $139,417 1,661 $142,812 546 $35,400 3 $22,597 257 $139,036 60 $32,690 APPLICATIONS WITHDRAWN 97 $151,761 1,666 $142,434 1,044 $152,628 87 $53,396 0 $0 175 $126,629 3 $126,047 FILES CLOSED FOR INCOMPLETENESS 14 $152,431 329 $138,465 334 $158,664 7 $82,169 0 $0 39 $138,265 0 $0
Aggregated Statistics For Year 2005(Based on 9 full and 22 partial tracts) A) FHA, FSA/RHS & VA B) Conventional C) Refinancings D) Home Improvement Loans E) Loans on Dwellings For 5+ Families F) Non-occupant Loans on G) Loans On Manufactured Number Average Value Number Average Value Number Average Value Number Average Value Number Average Value Number Average Value Number Average Value
LOANS ORIGINATED 459 $144,956 7,614 $116,296 1,780 $151,360 339 $51,944 3 $1,257,387 541 $99,928 28 $44,141 APPLICATIONS APPROVED, NOT ACCEPTED 45 $146,306 1,293 $114,254 385 $151,946 104 $35,334 0 $0 93 $94,493 34 $42,251 APPLICATIONS DENIED 83 $135,176 1,855 $126,137 1,961 $140,073 523 $38,304 0 $0 208 $112,953 86 $41,491 APPLICATIONS WITHDRAWN 70 $151,873 1,228 $129,151 919 $175,822 182 $195,487 1 $756,680 121 $132,853 2 $89,310 FILES CLOSED FOR INCOMPLETENESS 7 $140,423 316 $137,668 594 $157,760 4 $132,165 0 $0 43 $128,307 0 $0
Aggregated Statistics For Year 2004(Based on 9 full and 22 partial tracts) A) FHA, FSA/RHS & VA B) Conventional C) Refinancings D) Home Improvement Loans E) Loans on Dwellings For 5+ Families F) Non-occupant Loans on G) Loans On Manufactured Number Average Value Number Average Value Number Average Value Number Average Value Number Average Value Number Average Value Number Average Value
LOANS ORIGINATED 491 $136,017 5,115 $127,152 2,658 $142,761 301 $59,208 5 $1,637,824 263 $104,301 33 $48,354 APPLICATIONS APPROVED, NOT ACCEPTED 25 $127,328 914 $126,883 450 $142,041 88 $60,833 0 $0 39 $130,588 32 $54,000 APPLICATIONS DENIED 75 $130,162 1,117 $123,910 1,868 $137,401 359 $40,294 0 $0 85 $116,143 91 $43,451 APPLICATIONS WITHDRAWN 72 $132,154 753 $136,415 991 $140,293 67 $46,825 0 $0 40 $118,082 4 $78,908 FILES CLOSED FOR INCOMPLETENESS 5 $103,942 202 $128,699 765 $154,298 13 $58,603 0 $0 6 $126,765 0 $0
Aggregated Statistics For Year 2003(Based on 9 full and 22 partial tracts) A) FHA, FSA/RHS & VA B) Conventional C) Refinancings D) Home Improvement Loans E) Loans on Dwellings For 5+ Families F) Non-occupant Loans on Number Average Value Number Average Value Number Average Value Number Average Value Number Average Value Number Average Value
LOANS ORIGINATED 499 $131,638 4,039 $131,871 5,797 $135,354 348 $34,565 4 $7,492,662 222 $103,381 APPLICATIONS APPROVED, NOT ACCEPTED 42 $111,943 531 $136,218 772 $127,470 95 $51,274 0 $0 29 $92,840 APPLICATIONS DENIED 89 $131,149 714 $111,228 2,724 $124,113 311 $31,066 0 $0 70 $126,164 APPLICATIONS WITHDRAWN 95 $132,949 506 $143,431 1,262 $125,945 60 $43,810 0 $0 44 $106,169 FILES CLOSED FOR INCOMPLETENESS 10 $139,981 181 $128,562 244 $139,562 7 $61,931 0 $0 10 $81,117
Aggregated Statistics For Year 1999(Based on 3 full and 12 partial tracts) A) FHA, FSA/RHS & VA B) Conventional C) Refinancings D) Home Improvement Loans E) Loans on Dwellings For 5+ Families F) Non-occupant Loans on Number Average Value Number Average Value Number Average Value Number Average Value Number Average Value Number Average Value
LOANS ORIGINATED 186 $107,294 1,189 $120,528 426 $109,608 174 $28,871 1 $2,564,640 36 $75,224 APPLICATIONS APPROVED, NOT ACCEPTED 8 $102,008 171 $91,725 90 $92,312 43 $22,697 0 $0 12 $56,482 APPLICATIONS DENIED 18 $101,802 428 $64,654 159 $97,814 125 $16,453 0 $0 38 $67,024 APPLICATIONS WITHDRAWN 26 $106,065 129 $124,657 115 $101,817 16 $23,681 0 $0 8 $71,989 FILES CLOSED FOR INCOMPLETENESS 5 $90,752 44 $143,695 86 $110,725 7 $16,996 0 $0 3 $144,030
Private Mortgage Insurance Companies Aggregated Statistics For Year 2009(Based on 5 full and 20 partial tracts) A) Conventional B) Refinancings C) Non-occupant Loans on Number Average Value Number Average Value Number Average Value
LOANS ORIGINATED 564 $200,455 217 $190,440 2 $185,720 APPLICATIONS APPROVED, NOT ACCEPTED 167 $213,838 60 $182,060 2 $96,855 APPLICATIONS DENIED 61 $250,503 50 $191,072 0 $0 APPLICATIONS WITHDRAWN 22 $183,286 30 $189,474 1 $171,250 FILES CLOSED FOR INCOMPLETENESS 21 $220,927 4 $180,475 5 $156,530
Aggregated Statistics For Year 2008(Based on 7 full and 22 partial tracts) A) Conventional B) Refinancings C) Non-occupant Loans on Number Average Value Number Average Value Number Average Value
LOANS ORIGINATED 1,470 $196,942 208 $185,670 71 $148,410 APPLICATIONS APPROVED, NOT ACCEPTED 499 $209,502 111 $192,687 26 $204,257 APPLICATIONS DENIED 115 $203,392 24 $212,197 37 $161,530 APPLICATIONS WITHDRAWN 55 $210,917 17 $240,655 8 $176,959 FILES CLOSED FOR INCOMPLETENESS 36 $182,321 6 $246,387 19 $170,949
Aggregated Statistics For Year 2007(Based on 7 full and 22 partial tracts) A) Conventional B) Refinancings C) Non-occupant Loans on Number Average Value Number Average Value Number Average Value
LOANS ORIGINATED 1,930 $180,928 208 $194,883 80 $144,572 APPLICATIONS APPROVED, NOT ACCEPTED 312 $196,695 57 $183,496 15 $158,001 APPLICATIONS DENIED 43 $194,534 2 $156,950 10 $198,017 APPLICATIONS WITHDRAWN 131 $202,051 8 $208,229 8 $176,299 FILES CLOSED FOR INCOMPLETENESS 13 $165,820 0 $0 0 $0
Aggregated Statistics For Year 2006(Based on 7 full and 22 partial tracts) A) Conventional B) Refinancings C) Non-occupant Loans on Number Average Value Number Average Value Number Average Value
LOANS ORIGINATED 816 $173,282 80 $207,303 62 $169,143 APPLICATIONS APPROVED, NOT ACCEPTED 145 $205,122 35 $198,039 10 $141,245 APPLICATIONS DENIED 18 $193,011 5 $278,068 6 $342,107 APPLICATIONS WITHDRAWN 49 $212,562 13 $237,745 7 $214,200 FILES CLOSED FOR INCOMPLETENESS 8 $143,380 0 $0 0 $0
Aggregated Statistics For Year 2005(Based on 7 full and 22 partial tracts) A) Conventional B) Refinancings C) Non-occupant Loans on D) Loans On Manufactured Number Average Value Number Average Value Number Average Value Number Average Value
LOANS ORIGINATED 763 $161,394 106 $180,635 29 $159,311 1 $100,500 APPLICATIONS APPROVED, NOT ACCEPTED 167 $172,194 60 $176,902 11 $182,172 0 $0 APPLICATIONS DENIED 10 $165,674 3 $302,443 2 $168,790 0 $0 APPLICATIONS WITHDRAWN 47 $180,859 11 $232,245 5 $146,272 1 $88,890 FILES CLOSED FOR INCOMPLETENESS 7 $191,999 9 $177,873 0 $0 0 $0
Aggregated Statistics For Year 2004(Based on 7 full and 22 partial tracts) A) Conventional B) Refinancings C) Non-occupant Loans on D) Loans On Manufactured Number Average Value Number Average Value Number Average Value Number Average Value
LOANS ORIGINATED 744 $159,787 187 $163,207 34 $118,789 1 $208,180 APPLICATIONS APPROVED, NOT ACCEPTED 214 $154,910 103 $199,639 10 $126,709 2 $119,115 APPLICATIONS DENIED 11 $187,322 5 $153,182 3 $185,937 0 $0 APPLICATIONS WITHDRAWN 60 $183,091 22 $159,179 7 $160,106 0 $0 FILES CLOSED FOR INCOMPLETENESS 9 $139,189 2 $143,525 0 $0 0 $0
Aggregated Statistics For Year 2003(Based on 7 full and 22 partial tracts) A) Conventional B) Refinancings C) Non-occupant Loans on Number Average Value Number Average Value Number Average Value
LOANS ORIGINATED 970 $156,349 516 $161,291 40 $98,149 APPLICATIONS APPROVED, NOT ACCEPTED 187 $166,790 160 $172,682 8 $106,821 APPLICATIONS DENIED 24 $169,722 9 $138,748 3 $125,083 APPLICATIONS WITHDRAWN 38 $142,899 32 $146,202 5 $120,772 FILES CLOSED FOR INCOMPLETENESS 7 $159,541 7 $144,193 0 $0
Aggregated Statistics For Year 1999(Based on 3 full and 10 partial tracts) A) Conventional B) Refinancings C) Non-occupant Loans on Number Average Value Number Average Value Number Average Value
LOANS ORIGINATED 362 $130,524 75 $126,042 7 $87,039 APPLICATIONS APPROVED, NOT ACCEPTED 47 $139,995 21 $125,438 2 $64,505 APPLICATIONS DENIED 33 $148,514 5 $94,178 0 $0 APPLICATIONS WITHDRAWN 12 $124,866 4 $174,268 0 $0 FILES CLOSED FOR INCOMPLETENESS 10 $134,152 2 $97,975 1 $88,960
2002 - 2018 National Fire Incident Reporting System (NFIRS) incidents See full 2006 National Fire Incident Reporting System statistics for zip code 77469, Texas
Most common first names in zip code 77469 among deceased individuals Name Count Lived (average)
Mary 100 78.4 years John 82 70.9 years James 71 67.0 years Robert 68 68.3 years William 65 74.5 years Charles 50 68.2 years George 43 72.5 years Joe 43 73.7 years Willie 41 75.4 years Thomas 40 66.5 years
Most common last names in zip code 77469 among deceased individuals Last name Count Lived (average)
Smith 43 74.0 years Martinez 41 65.5 years Davis 38 72.6 years Williams 36 72.1 years Johnson 35 74.9 years Brown 35 66.6 years Jones 33 71.3 years Garcia 27 65.6 years Anderson 24 76.8 years Wilson 23 70.6 years
Businesses in zip code 77469
Name Count Name Count
Academy Sports + Outdoors 1 Popeyes 1 AutoZone 2 SONIC Drive-In 2 Burger King 1 Safeway 1 CVS 1 Sears 1 Domino's Pizza 1 Sephora 1 FedEx 4 Starbucks 2 GNC 1 Taco Bell 1 Goodwill 5 Toyota 1 Jack In The Box 1 U-Haul 3 KFC 1 UPS 4 Lane Furniture 2 Vons 1 Little Caesars Pizza 1 Walgreens 2 McDonald's 2 Walmart 1 Office Depot 1 YMCA 1 Papa John's Pizza 1


 Nearest zip codes: 77479, 77481, 77478, 77459, 77461, 77498.
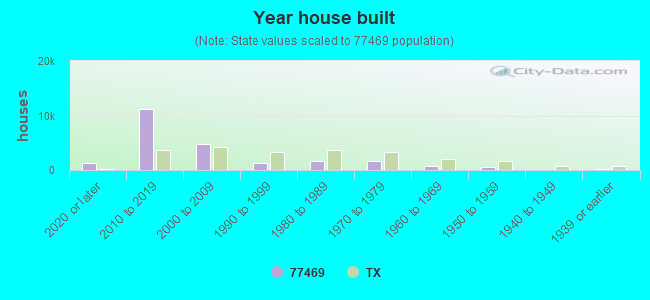


 According to the data from the years 2002 - 2018 the average number of fires per year is 177. The highest number of fires - 296 took place in 2011, and the least - 105 in 2014. The data has a dropping trend.
 When looking into fire subcategories, the most reports belonged to: Outside Fires (44.6%), and Structure Fires (38.6%).