Estimated zip code population in 2022: 24,877 Zip code population in 2010: 23,288 Zip code population in 2000: 20,721
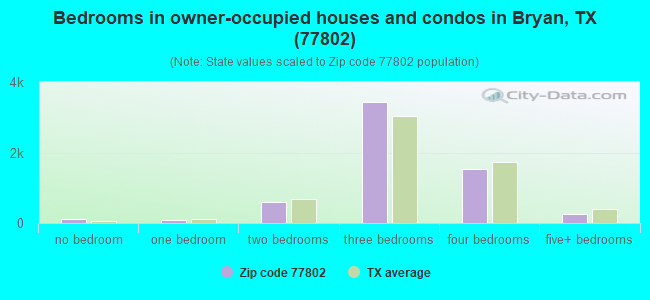
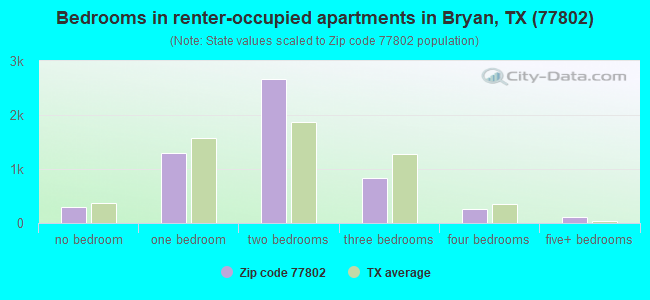
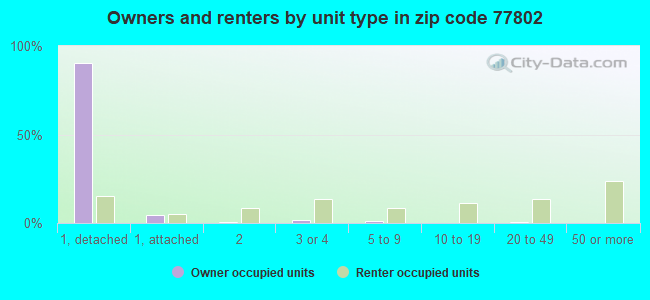
Houses and condos: 12,355 Renter-occupied apartments: 5,501
% of renters here:
48%
State:
38%
March 2022 cost of living index in zip code 77802: 88.3 (less than average, U.S. average is 100)
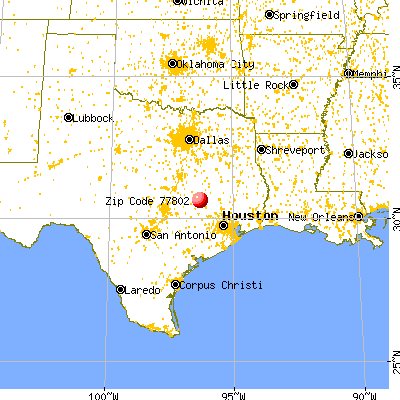
Land area: 11.7 sq. mi. Water area: 0.0 sq. mi.
Population density: 2,118 people per square mile
(low).
OSM Map
General Map
Google Map
MSN Map
OSM Map
General Map
Google Map
MSN Map
OSM Map
General Map
Google Map
MSN Map
OSM Map
General Map
Google Map
MSN Map
Please wait while loading the map...
Real estate property taxes paid for housing units in 2022:
This zip code:
1.7% ($4,331)
Texas:
1.5% ($4,050)
Median real estate property taxes paid for housing units with mortgages in 2022: $4,326 (1.7%) Median real estate property taxes paid for housing units with no mortgage in 2022: $4,477 (1.7%)
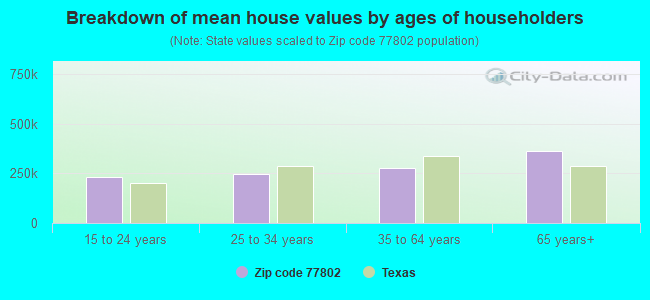
Estimated median house/condo value in 2022: $258,043
77802:
$258,043
Texas:
$275,400
According to our research of Texas and other state lists, there were 30 registered sex offenders living in 77802 zip code as of April 26, 2024. The ratio of all residents to sex offenders in zip code 77802 is 856 to 1. The ratio of registered sex offenders to all residents in this zip code is lower than the state average.
Median resident age:
This zip code:
37.9 years
Texas median age:
35.6 years
Average household size:
This zip code:
2.1 people
Texas:
2.6 people
Averages for the 2020 tax year for zip code 77802, filed in 2021:
Average Adjusted Gross Income (AGI) in 2020: $69,324 (Individual Income Tax Returns)
Here:
$69,324
State:
$77,054
Salary/wage: $51,472 (reported on 81.2% of returns)
Here:
$51,472
State:
$62,766
(% of AGI for various income ranges: 1242.3% for AGIs below $25k, 3571.9% for AGIs $25k-50k, 6201.6% for AGIs $50k-75k, 9454.7% for AGIs $75k-100k, 16802.3% for AGIs $100k-200k, 67383.6% for AGIs over 200k)
Taxable interest for individuals: $2,376 (reported on 28.7% of returns)
This zip code:
$2,376
Texas:
$2,665
(% of AGI for various income ranges: 14.5% for AGIs below $25k, 22.2% for AGIs $25k-50k, 61.4% for AGIs $50k-75k, 81.3% for AGIs $75k-100k, 179.2% for AGIs $100k-200k, 3795.5% for AGIs over 200k)
Ordinary dividends: $12,369 (reported on 20.6% of returns)
Here:
$12,369
State:
$10,044
(% of AGI for various income ranges: 21.0% for AGIs below $25k, 43.9% for AGIs $25k-50k, 114.7% for AGIs $50k-75k, 186.2% for AGIs $75k-100k, 595.2% for AGIs $100k-200k, 18782.7% for AGIs over 200k)
Net capital gain/loss in AGI: +$23,868 (reported on 19.2% of returns)
Here:
+$23,868
State:
+$39,590
(% of AGI for various income ranges: 6.5% for AGIs below $25k, 34.3% for AGIs $25k-50k, 77.9% for AGIs $50k-75k, 225.7% for AGIs $75k-100k, 916.0% for AGIs $100k-200k, 39063.6% for AGIs over 200k)
Profit/loss from business: +$12,846 (reported on 15.5% of returns)
Here:
+$12,846
State:
+$10,888
(% of AGI for various income ranges: 83.3% for AGIs below $25k, 67.1% for AGIs $25k-50k, 128.1% for AGIs $50k-75k, 346.6% for AGIs $75k-100k, 620.7% for AGIs $100k-200k, 9220.0% for AGIs over 200k)
Taxable individual retirement arrangement distribution: $24,697 (reported on 9.2% of returns)
77802:
$24,697
Texas:
$24,740
(% of AGI for various income ranges: 41.5% for AGIs below $25k, 72.8% for AGIs $25k-50k, 203.7% for AGIs $50k-75k, 365.8% for AGIs $75k-100k, 920.4% for AGIs $100k-200k, 9701.8% for AGIs over 200k)
Self-employed (Keogh) retirement plans: $26,675 (reported on 0.3% of returns)
77802:
$26,675
Texas:
$29,298
(% of AGI for various income ranges: 28.2% for AGIs $75k-100k, 775.5% for AGIs over 200k)
Total itemized deductions: $39,737 (reported on 6.8% of returns)
Here:
$39,737
State:
$40,428
(% of AGI for various income ranges: 36.2% for AGIs below $25k, 111.1% for AGIs $25k-50k, 277.8% for AGIs $50k-75k, 428.4% for AGIs $75k-100k, 1057.2% for AGIs $100k-200k, 11348.2% for AGIs over 200k)
Charity contributions: $18,007 (reported on 5.6% of returns)
Here:
$18,007
State:
$18,201
(% of AGI for various income ranges: 5.0% for AGIs below $25k, 19.1% for AGIs $25k-50k, 55.3% for AGIs $50k-75k, 132.4% for AGIs $75k-100k, 379.2% for AGIs $100k-200k, 5931.8% for AGIs over 200k)
Taxes paid: $6,765 (reported on 6.6% of returns)
77802:
$6,765
State:
$7,821
(% of AGI for various income ranges: 6.1% for AGIs below $25k, 16.3% for AGIs $25k-50k, 51.6% for AGIs $50k-75k, 90.0% for AGIs $75k-100k, 197.5% for AGIs $100k-200k, 1508.2% for AGIs over 200k)
Earned income credit: $2,329 (reported on 14.6% of returns)
Here:
$2,329
State:
$2,584
(% of AGI for various income ranges: 88.1% for AGIs below $25k, 59.3% for AGIs $25k-50k, 1.5% for AGIs $50k-75k)
Percentage of individuals using paid preparers for their 2020 taxes: 92.9%
Here:
93%
State:
92%
(% for various income ranges: 92.2% for AGIs below $25k, 94.6% for AGIs $25k-50k, 93.0% for AGIs $50k-75k, 92.2% for AGIs $75k-100k, 91.7% for AGIs $100k-200k, 91.3% for AGIs over 200k)
Averages for the 2012 tax year for zip code 77802, filed in 2013:
Average Adjusted Gross Income (AGI) in 2012: $63,075 (Individual Income Tax Returns)
Here:
$63,075
State:
$65,384
Salary/wage: $46,832 (reported on 80.9% of returns)
Here:
$46,832
State:
$52,524
(% of AGI for various income ranges: 77.7% for AGIs below $25k, 78.7% for AGIs $25k-50k, 73.1% for AGIs $50k-75k, 70.3% for AGIs $75k-100k, 62.3% for AGIs $100k-200k, 31.1% for AGIs over 200k)
Taxable interest for individuals: $2,128 (reported on 35.3% of returns)
This zip code:
$2,128
Texas:
$2,372
(% of AGI for various income ranges: 1.4% for AGIs below $25k, 0.8% for AGIs $25k-50k, 1.1% for AGIs $50k-75k, 0.8% for AGIs $75k-100k, 1.3% for AGIs $100k-200k, 1.5% for AGIs over 200k)
Ordinary dividends: $7,467 (reported on 21.5% of returns)
Here:
$7,467
State:
$9,721
(% of AGI for various income ranges: 1.6% for AGIs below $25k, 1.3% for AGIs $25k-50k, 1.5% for AGIs $50k-75k, 1.5% for AGIs $75k-100k, 3.0% for AGIs $100k-200k, 4.2% for AGIs over 200k)
Net capital gain/loss in AGI: +$18,254 (reported on 17.8% of returns)
Here:
+$18,254
State:
+$35,319
(% of AGI for various income ranges: 0.5% for AGIs $25k-50k, 0.6% for AGIs $50k-75k, 1.5% for AGIs $75k-100k, 2.7% for AGIs $100k-200k, 15.5% for AGIs over 200k)
Profit/loss from business: +$15,972 (reported on 15.4% of returns)
Here:
+$15,972
State:
+$13,732
(% of AGI for various income ranges: 6.0% for AGIs below $25k, 2.5% for AGIs $25k-50k, 2.4% for AGIs $50k-75k, 2.4% for AGIs $75k-100k, 4.0% for AGIs $100k-200k, 5.6% for AGIs over 200k)
Taxable individual retirement arrangement distribution: $21,465 (reported on 12.5% of returns)
77802:
$21,465
Texas:
$19,511
(% of AGI for various income ranges: 3.1% for AGIs below $25k, 2.1% for AGIs $25k-50k, 2.8% for AGIs $50k-75k, 3.7% for AGIs $75k-100k, 4.5% for AGIs $100k-200k, 6.6% for AGIs over 200k)
Self-employment retirement plans: $16,333 (reported on 0.8% of returns)
77802:
$16,333
Texas:
$23,938
(% of AGI for various income ranges: 0.3% for AGIs below $25k, 0.2% for AGIs $100k-200k, 0.5% for AGIs over 200k)
Total itemized deductions: $22,116 (18% of AGI, reported on 26.8% of returns)
Here:
$22,116
State:
$24,724
Here:
17.6% of AGI
State:
15.9% of AGI
(% of AGI for various income ranges: 8.9% for AGIs below $25k, 8.7% for AGIs $25k-50k, 10.6% for AGIs $50k-75k, 9.4% for AGIs $75k-100k, 10.9% for AGIs $100k-200k, 7.8% for AGIs over 200k)
Charity contributions: $7,460 (reported on 21.7% of returns)
Here:
$7,460
State:
$6,808
(% of AGI for various income ranges: 0.8% for AGIs below $25k, 1.3% for AGIs $25k-50k, 2.0% for AGIs $50k-75k, 2.0% for AGIs $75k-100k, 3.4% for AGIs $100k-200k, 3.5% for AGIs over 200k)
Taxes paid: $6,024 (reported on 26.4% of returns)
77802:
$6,024
State:
$6,921
(% of AGI for various income ranges: 1.7% for AGIs below $25k, 2.2% for AGIs $25k-50k, 2.3% for AGIs $50k-75k, 2.7% for AGIs $75k-100k, 3.2% for AGIs $100k-200k, 2.4% for AGIs over 200k)
Earned income credit: $2,175 (reported on 15.4% of returns)
Here:
$2,175
State:
$2,570
(% of AGI for various income ranges: 5.6% for AGIs below $25k, 0.9% for AGIs $25k-50k)
Percentage of individuals using paid preparers for their 2012 taxes: 43.3%
Here:
43%
State:
51%
(% for various income ranges: 36.9% for AGIs below $25k, 39.9% for AGIs $25k-50k, 44.9% for AGIs $50k-75k, 46.5% for AGIs $75k-100k, 56.7% for AGIs $100k-200k, 81.2% for AGIs over 200k)
Averages for the 2004 tax year for zip code 77802, filed in 2005:
Average Adjusted Gross Income (AGI) in 2004: $56,585 (Individual Income Tax Returns)
Here:
$56,585
State:
$47,881
Salary/wage: $39,982 (reported on 81.1% of returns)
Here:
$39,982
State:
$41,947
(% of AGI for various income ranges: 103.3% for AGIs below $10k, 77.5% for AGIs $10k-25k, 78.0% for AGIs $25k-50k, 73.0% for AGIs $50k-75k, 70.3% for AGIs $75k-100k, 36.6% for AGIs over 100k)
Taxable interest for individuals: $2,319 (reported on 45.1% of returns)
This zip code:
$2,319
Texas:
$2,255
(% of AGI for various income ranges: 4.8% for AGIs below $10k, 2.8% for AGIs $10k-25k, 2.2% for AGIs $25k-50k, 1.6% for AGIs $50k-75k, 1.9% for AGIs $75k-100k, 1.6% for AGIs over 100k)
Taxable dividends: $4,494 (reported on 27.0% of returns)
Here:
$4,494
State:
$4,261
(% of AGI for various income ranges: 3.2% for AGIs below $10k, 1.7% for AGIs $10k-25k, 1.2% for AGIs $25k-50k, 1.4% for AGIs $50k-75k, 1.6% for AGIs $75k-100k, 3.0% for AGIs over 100k)
Net capital gain/loss: +$9,947 (reported on 22.4% of returns)
Here:
+$9,947
State:
+$16,110
(% of AGI for various income ranges: -2.3% for AGIs below $10k, 0.1% for AGIs $10k-25k, 0.7% for AGIs $25k-50k, 1.2% for AGIs $50k-75k, 1.6% for AGIs $75k-100k, 7.4% for AGIs over 100k)
Profit/loss from business: +$6,087 (reported on 16.6% of returns)
Here:
+$6,087
State:
+$11,013
(% of AGI for various income ranges: -6.2% for AGIs below $10k, 4.2% for AGIs $10k-25k, 3.1% for AGIs $25k-50k, 3.7% for AGIs $50k-75k, 4.0% for AGIs $75k-100k, -0.1% for AGIs over 100k)
IRA payment deduction: $3,489 (reported on 2.5% of returns)
77802:
$3,489
Texas:
$3,120
(% of AGI for various income ranges: 0.2% for AGIs $10k-25k, 0.3% for AGIs $25k-50k, 0.2% for AGIs $50k-75k, 0.2% for AGIs $75k-100k, 0.1% for AGIs over 100k)
Self-employed pension: $15,622 (reported on 0.9% of returns)
Here:
$15,622
Texas:
$16,401
Total itemized deductions: $17,399 (16% of AGI, reported on 30.4% of returns)
Here:
$17,399
State:
$19,631
Here:
16.0% of AGI
State:
18.9% of AGI
(% of AGI for various income ranges: 11.2% for AGIs below $10k, 8.5% for AGIs $10k-25k, 10.5% for AGIs $25k-50k, 12.1% for AGIs $50k-75k, 12.3% for AGIs $75k-100k, 7.2% for AGIs over 100k)
Charity contributions deductions: $5,602 (5% of AGI, reported on 26.3% of returns)
Here:
$5,602
State:
$4,753
Here:
4.8% of AGI
State:
4.2% of AGI
(% of AGI for various income ranges: 0.6% for AGIs below $10k, 1.2% for AGIs $10k-25k, 1.9% for AGIs $25k-50k, 2.8% for AGIs $50k-75k, 3.2% for AGIs $75k-100k, 2.8% for AGIs over 100k)
Total tax: $9,847 (reported on 75.9% of returns)
77802:
$9,847
State:
$9,058
(% of AGI for various income ranges: 2.6% for AGIs below $10k, 4.0% for AGIs $10k-25k, 7.3% for AGIs $25k-50k, 9.3% for AGIs $50k-75k, 11.2% for AGIs $75k-100k, 18.8% for AGIs over 100k)
Earned income credit: $1,851 (reported on 13.5% of returns)
Here:
$1,851
State:
$2,024
Percentage of individuals using paid preparers for their 2004 taxes: 49.4%
Here:
49%
State:
57%
(% for various income ranges: 40.4% for AGIs below $10k, 50.9% for AGIs $10k-25k, 46.8% for AGIs $25k-50k, 50.8% for AGIs $50k-75k, 52.1% for AGIs $75k-100k, 66.1% for AGIs over 100k)
Likely homosexual households (counted as self-reported same-sex unmarried-partner households)
Lesbian couples: 0.7% of all households
Gay men: 0.1% of all households
Household received Food Stamps/SNAP in the past 12 months: 484 Household did not receive Food Stamps/SNAP in the past 12 months: 10,996
Women who had a birth in the past 12 months: 269 (268 now married, 5 unmarried) Women who did not have a birth in the past 12 months: 6,050 (2,187 now married, 3,877 unmarried)
Housing units in zip code 77802 with a mortgage: 3,580 (97 second mortgage, 68 both second mortgage and home equity loan) Houses without a mortgage: 20
Median monthly owner costs for units with a mortgage: $1,614 Median monthly owner costs for units without a mortgage: $704
Residents with income below the poverty level in 2022:
This zip code:
13.5%
Whole state:
14.0%
Residents with income below 50% of the poverty level in 2022:
This zip code:
6.9%
Whole state:
7.4%
Median number of rooms in houses and condos:
Here:
6.5
State:
6.3
Median number of rooms in apartments:
Here:
4.0
State:
4.0
Notable locations in this zip code not listed on our city pages
Notable locations in zip code 77802: Briarcrest Country Club (A), Brazos Valley Museum of Natural History (B), Bryan Fire Department / Briarcrest Drive Station 3 (C). Display/hide their locations on the map
Parks in zip code 77802 include: Sul Ross Park (1), Tanglewood Park (2), Viking Park Softball - Bryan High School (3), Viking Stadium (4), Viking Park Baseball - Bryan High School (5), Baker Field (6), Bunton Park (7), Brazos County Park (8). Display/hide their locations on the map
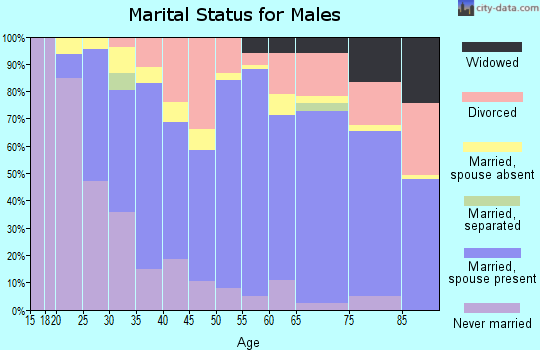
2,579 married couples with children.
1,422 single-parent households (278 men, 1,144 women).
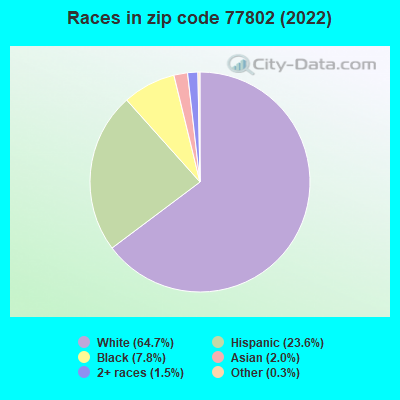
85.9% of residents of 77802 zip code speak English at home.
11.4% of residents speak Spanish at home (69% very well, 22% well, 8% not well, 2% not at all).
1.3% of residents speak other Indo-European language at home (93% very well, 7% well).
1.6% of residents speak Asian or Pacific Island language at home (46% very well, 54% well).
0.1% of residents speak other language at home (100% very well).
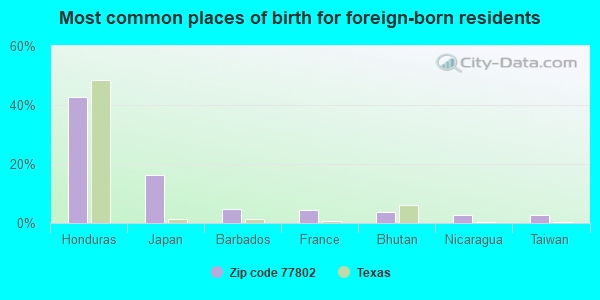
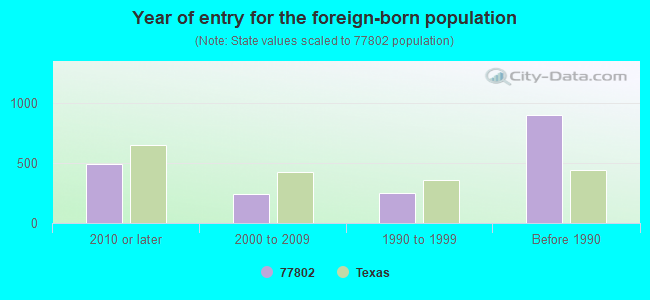
Foreign born population: 1,616 (6.5%) (44.6% of them are naturalized citizens)
Facilities with environmental interests located in this zip code:
ALENCO, DIVISION OF RELIANT BUILDING PRODUCTS (615 CARSON STREET in BRYAN, TX)
AIR MINOR (AIRS/AFS) Conditionally Exempt Small Quantity Generators, less than 100 kg/month of hazardous waste (Resource Conservation and Recovery Act (tracking hazardous waste)) HAZARDOUS WASTE BIENNIAL REPORTER (Resource Conservation and Recovery Act (tracking hazardous waste)) TRI REPORTER (Tracking of toxic chemicals releasing facilities) Business SIC classification: METAL DOORS, SASH, FRAMES, MOLDING, AND TRIM; COATING, ENGRAVING, AND ALLIED SERVICES; FABRICATED METAL PRODUCTS Business NAICS classification: METAL WINDOW AND DOOR MANUFACTURING. Organizations: ALENCO HOLDING CORPORATION (CONTACT/OPERATOR)
Alternative names: ALENCO, DIVOF RELIANT BLDG PRODUCTS, RELIANT BUILDING PRODS.
ACE CAMPUS (1307 MEMORIAL DR in BRYAN, TX)
(National Center for Education Statistics) - STATE ID-021902011 Organizations: BRYAN ISD (SCHOOL DISTRICT)
Housing units lacking complete plumbing facilities: 1.0% Housing units lacking complete kitchen facilities: 0.7%
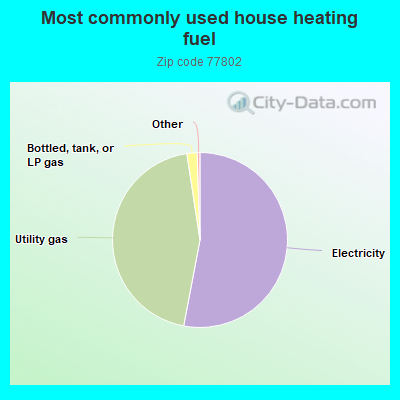
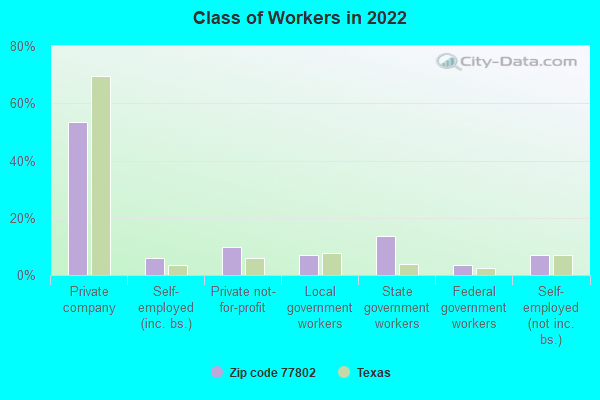
53.0%Electricity
44.6%Utility gas
1.9%Bottled, tank, or LP gas
Population in 1990: 19,306. Population change in the 1990s: +1,415 (+7.3%).
Place of birth for U.S.-born residents:
This state: 17,266
Northeast: 485
Midwest: 1,530
South: 1,820
West: 1,778
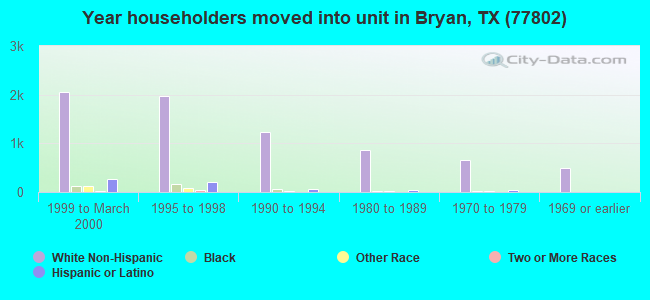
42% of the 77802 zip code residents lived in the same house 5 years ago. Out of people who lived in different houses, 43% lived in this county. Out of people who lived in different counties, 50% lived in Texas.
84% of the 77802 zip code residents lived in the same house 1 year ago. Out of people who lived in different houses, 58% moved from this county. Out of people who lived in different houses, 28% moved from different county within same state. Out of people who lived in different houses, 10% moved from different state. Out of people who lived in different houses, 2% moved from abroad.
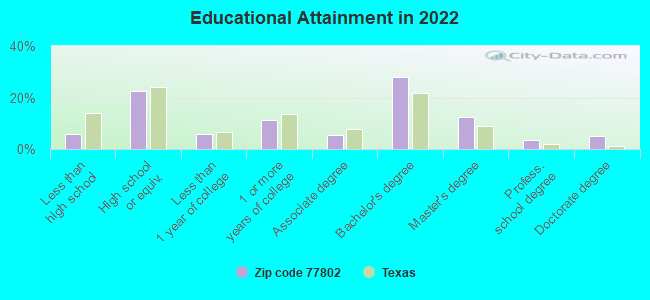
Private vs. public school enrollment:
Students in private schools in grades 1 to 8 (elementary and middle school): 164
Here:
8.0%
Texas:
8.8%
Students in private schools in grades 9 to 12 (high school): 81
Here:
8.2%
Texas:
8.0%
Students in private undergraduate colleges: 79
Here:
4.3%
Texas:
16.2%
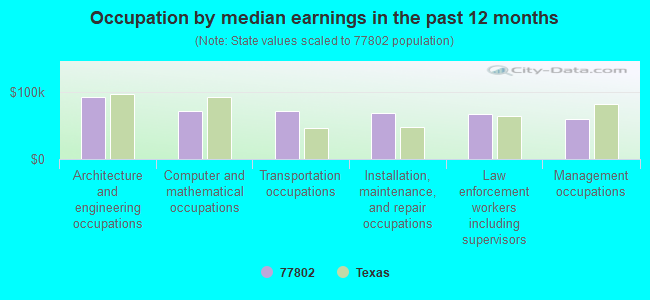
Occupation by median earnings in the past 12 months ($)
93,059Architecture and engineering occupations
72,867Computer and mathematical occupations
71,756Transportation occupations
69,069Installation, maintenance, and repair occupations
68,289Law enforcement workers including supervisors
59,708Management occupations
Companies with federal contracts located in this zip code:
TRAJEN, INC (3131 BRIARCREST in BRYAN, TX; small business) : $27,904,821 in 74 contractsfrom 1999 to 2006
Contracts for Operation of Government-Owned Facilities -- Fuel Storage Buildings, Liquid Propellants and Fuels, Petroleum Base, Other Environmental Services, Studies, and Analytical Support, ADP Systems Analysis Services, and moreby Defense Logistics Agency, Air Force, Federal Technology Service Signed by year:2000: $9,416,947; 2001: $3,669,782; 2002: $6,752,848; 2003: $2,073,935; 2004: $924,192; 2005: $1,395,873; 2006: $3,564,166.
Biggest contracts:
$5,462,284 with Defense Logistics Agency for Operation of Government-Owned Facilities -- Fuel Storage Buildings. Taking place in VA. Signed on 2002-08-21. Completion date: 2002-09-30.
$4,772,972, same as above.Signed on 2000-07-27. Completion date: 2001-09-01.
$4,135,500 with Defense Logistics Agency for Liquid Propellants and Fuels, Petroleum Base. Taking place in CA. Signed on 2000-08-29. Completion date: 2003-03-31.
$3,167,503 with Defense Logistics Agency for Operation of Government-Owned Facilities -- Fuel Storage Buildings. Taking place in VA. Signed on 2001-10-01. Completion date: 2002-09-30.
TRAJEN FLIGHT SUPPORT, LP (3131 BRIARCREST DR # 100 in BRYAN, TX) : $4,234,869 in 5 contractsfrom 2003 to 2006
Contracts for Liquid Propellants and Fuels, Petroleum Base by Defense Logistics Agency Signed by year:2000: $0; 2001: $0; 2002: $0; 2003: $73,991; 2004: $1,503,382; 2005: $0; 2006: $2,657,496.
Biggest contracts:
$1,596,167 with Defense Logistics Agency for Liquid Propellants and Fuels, Petroleum Base. Taking place in AK. Signed on 2006-03-15. Completion date: 2010-03-31.
$1,061,329, same as above.Signed on 2006-02-22. Completion date: 2010-03-31.
$937,392 with Defense Logistics Agency for Liquid Propellants and Fuels, Petroleum Base. Taking place in WY. Signed on 2004-10-19. Completion date: 2008-09-30.
$565,990 with Defense Logistics Agency for Liquid Propellants and Fuels, Petroleum Base. Taking place in AZ. Signed on 2004-02-05. Completion date: 2007-03-31.
CLEARLEAF HILLS, LTD ., (3000 Briarcrest Dr in Bryan, TX) : $116,035 in 28 contractsfrom 2003 to 2006
Contracts for Lease or Rental of Facilities -- Office Buildings by Public Buildings Service Signed by year:2000: $0; 2001: $0; 2002: $0; 2003: $36,995; 2004: $8,320; 2005: $37,440; 2006: $33,280.
Biggest contracts:
$4,160 with Public Buildings Service for Lease or Rental of Facilities -- Office Buildings. Signed on 2006-04-01. Completion date: 2006-09-30.
$4,160, same as above.Signed on 2006-04-01. Completion date: 2006-09-30.
$4,160, same as above.Signed on 2006-04-01. Completion date: 2006-09-30.
$4,160, same as above.Signed on 2006-04-01. Completion date: 2006-09-30.
DOMINION LASERCOM, INC (1716 BRIARCREST DR STE 210 in BRYAN, TX; small business)
$70,527 with Army for Miscellaneous Communication Equipment. Signed on 2004-06-16. Completion date: 2004-07-16.
chapman's paint (1700 Villa Maria Road in Bryan, TX; small business) : $8,214 in 8 contractsin 2005
Contracts for Construction of Structures and Facilities -- Miscellaneous Buildings by Agricultural Research Service Signed by year:2000: $0; 2001: $0; 2002: $0; 2003: $0; 2004: $0; 2005: $8,214; 2006: $0.
Biggest contracts:
$1,835 with Agricultural Research Service for Construction of Structures and Facilities -- Miscellaneous Buildings. Signed on 2005-01-04. Completion date: 2005-01-04.
$1,835, same as above.Signed on 2005-01-04. Completion date: 2005-01-04.
$1,053, same as above.Signed on 2005-08-30. Completion date: 2005-08-30.
$1,002, same as above.Signed on 2005-09-14. Completion date: 2005-09-14.
BLACO CONSTRUCTION (2901 OAKSIDE DRIVE in BRYAN, TX; small business) : $8,000 in 2 contractsin 2000
$7,400 with Army for Maintenance, Repair or Alteration of Real Property -- Miscellaneous Buildings. Signed on 2000-03-22. Completion date: 2000-05-06.
$600, same as above.Signed on 2000-05-10. Completion date: 2000-05-11.
ELITE SOFTWARE DEVELOPMENT INC (4444 CARTER CREEK SUITE 20 in BRYAN, TX; small business)
$2,935 with U.S. Army Corps of Engineers - civil program financing only for Office Information System Equipment. Signed on 2002-09-20. Completion date: 2002-09-30.
thomas rakowitz (101 South Gordon in Brayn, TX; small business)
$1,935 with Agricultural Research Service for Construction of Structures and Facilities -- Miscellaneous Buildings. Signed on 2004-03-06. Completion date: 2004-03-06.
Top industries in this zip code by the number of employees in 2005:
Health Care and Social Assistance: General Medical and Surgical Hospitals (over 1000 employees: 1 establishment)
Administrative and Support and Waste Management and Remediation Services: Temporary Help Services (250-499: 2, 50-99: 1, 20-49: 2)
Health Care and Social Assistance: Offices of Physicians (except Mental Health Specialists) (50-99: 1, 20-49: 8, 10-19: 17, 5-9: 18, 1-4: 35)
2002 - 2018 National Fire Incident Reporting System (NFIRS) incidents
According to the data from the years 2002 - 2018 the average number of fires per year is 83. The highest number of reported fire incidents - 120 took place in 2011, and the least - 39 in 2007. The data has a growing trend.
When looking into fire subcategories, the most reports belonged to: Structure Fires (42.8%), and Outside Fires (39.7%).
Fire incident types reported to NFIRS in Zip Code 77802


 Nearest zip codes: 77801, 77840, 77803, 77845, 77808, 77807.
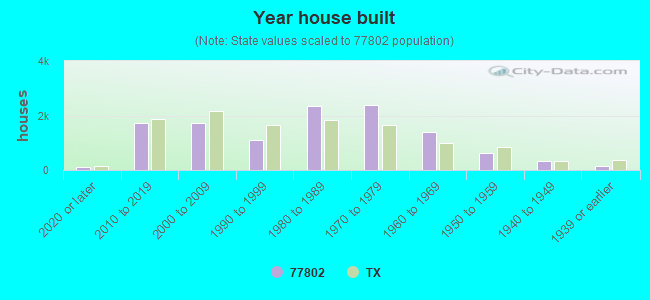


 According to the data from the years 2002 - 2018 the average number of fires per year is 83. The highest number of reported fire incidents - 120 took place in 2011, and the least - 39 in 2007. The data has a growing trend.
 When looking into fire subcategories, the most reports belonged to: Structure Fires (42.8%), and Outside Fires (39.7%).