Estimated zip code population in 2022: 32,993 Zip code population in 2010: 30,252 Zip code population in 2000: 27,930
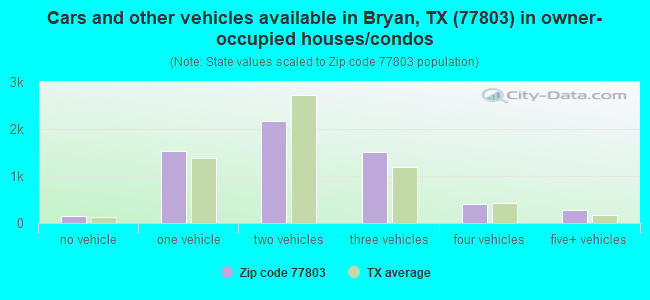
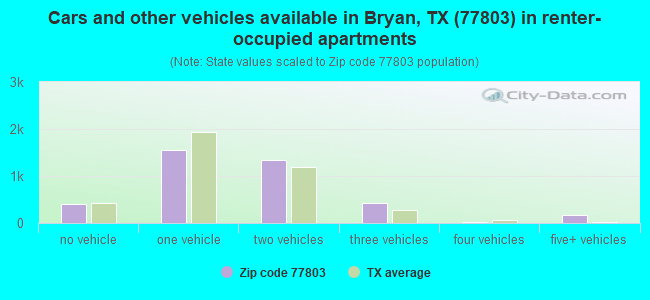
Houses and condos: 10,651 Renter-occupied apartments: 3,923
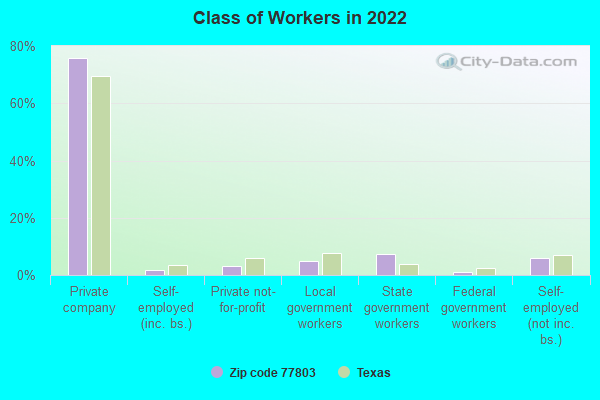
% of renters here:
39%
State:
38%
March 2022 cost of living index in zip code 77803: 86.8 (less than average, U.S. average is 100)
Land area: 12.9 sq. mi. Water area: 0.0 sq. mi.
Population density: 2,567 people per square mile
(average).
OSM Map
General Map
Google Map
MSN Map
OSM Map
General Map
Google Map
MSN Map
OSM Map
General Map
Google Map
MSN Map
OSM Map
General Map
Google Map
MSN Map
Please wait while loading the map...
Real estate property taxes paid for housing units in 2022:
This zip code:
1.5% ($2,066)
Texas:
1.5% ($4,050)
Median real estate property taxes paid for housing units with mortgages in 2022: $2,378 (1.4%) Median real estate property taxes paid for housing units with no mortgage in 2022: $1,748 (1.9%)
Averages for the 2020 tax year for zip code 77803, filed in 2021:
Average Adjusted Gross Income (AGI) in 2020: $35,000 (Individual Income Tax Returns)
Here:
$35,000
State:
$77,054
Salary/wage: $32,732 (reported on 87.6% of returns)
Here:
$32,732
State:
$62,766
(% of AGI for various income ranges: 1337.3% for AGIs below $25k, 3905.7% for AGIs $25k-50k, 6974.2% for AGIs $50k-75k, 10026.2% for AGIs $75k-100k, 15449.5% for AGIs $100k-200k)
Taxable interest for individuals: $648 (reported on 8.5% of returns)
This zip code:
$648
Texas:
$2,665
(% of AGI for various income ranges: 2.3% for AGIs below $25k, 4.6% for AGIs $25k-50k, 12.2% for AGIs $50k-75k, 12.3% for AGIs $75k-100k, 43.2% for AGIs $100k-200k)
Ordinary dividends: $1,757 (reported on 3.3% of returns)
Here:
$1,757
State:
$10,044
(% of AGI for various income ranges: 2.8% for AGIs below $25k, 4.0% for AGIs $25k-50k, 9.0% for AGIs $50k-75k, 14.5% for AGIs $75k-100k, 68.6% for AGIs $100k-200k)
Net capital gain/loss in AGI: +$7,322 (reported on 3.2% of returns)
Here:
+$7,322
State:
+$39,590
(% of AGI for various income ranges: 0.3% for AGIs below $25k, 7.8% for AGIs $25k-50k, 14.3% for AGIs $50k-75k, 88.5% for AGIs $75k-100k, 611.8% for AGIs $100k-200k)
Profit/loss from business: +$10,175 (reported on 17.2% of returns)
Here:
+$10,175
State:
+$10,888
(% of AGI for various income ranges: 183.2% for AGIs below $25k, 122.6% for AGIs $25k-50k, 260.9% for AGIs $50k-75k, 332.8% for AGIs $75k-100k, 2513.6% for AGIs $100k-200k)
Taxable individual retirement arrangement distribution: $12,885 (reported on 2.1% of returns)
77803:
$12,885
Texas:
$24,740
(% of AGI for various income ranges: 12.1% for AGIs below $25k, 13.3% for AGIs $25k-50k, 58.4% for AGIs $50k-75k, 129.8% for AGIs $75k-100k, 537.7% for AGIs $100k-200k)
Total itemized deductions: $31,909 (reported on 2.5% of returns)
Here:
$31,909
State:
$40,428
(% of AGI for various income ranges: 18.1% for AGIs below $25k, 82.7% for AGIs $25k-50k, 237.7% for AGIs $50k-75k, 363.0% for AGIs $75k-100k, 913.6% for AGIs $100k-200k)
Charity contributions: $9,724 (reported on 1.9% of returns)
Here:
$9,724
State:
$18,201
(% of AGI for various income ranges: 2.2% for AGIs below $25k, 17.9% for AGIs $25k-50k, 57.2% for AGIs $50k-75k, 97.2% for AGIs $75k-100k, 262.3% for AGIs $100k-200k)
Taxes paid: $7,129 (reported on 2.2% of returns)
77803:
$7,129
State:
$7,821
(% of AGI for various income ranges: 1.7% for AGIs below $25k, 15.4% for AGIs $25k-50k, 43.6% for AGIs $50k-75k, 87.9% for AGIs $75k-100k, 206.8% for AGIs $100k-200k)
Earned income credit: $2,907 (reported on 33.6% of returns)
Here:
$2,907
State:
$2,584
(% of AGI for various income ranges: 186.3% for AGIs below $25k, 121.2% for AGIs $25k-50k, 2.8% for AGIs $50k-75k)
Percentage of individuals using paid preparers for their 2020 taxes: 90.5%
Here:
90%
State:
92%
(% for various income ranges: 89.3% for AGIs below $25k, 90.8% for AGIs $25k-50k, 91.1% for AGIs $50k-75k, 92.4% for AGIs $75k-100k, 97.1% for AGIs $100k-200k, 100.0% for AGIs over 200k)
Averages for the 2012 tax year for zip code 77803, filed in 2013:
Average Adjusted Gross Income (AGI) in 2012: $29,252 (Individual Income Tax Returns)
Here:
$29,252
State:
$65,384
Salary/wage: $26,925 (reported on 90.3% of returns)
Here:
$26,925
State:
$52,524
(% of AGI for various income ranges: 84.3% for AGIs below $25k, 90.5% for AGIs $25k-50k, 87.0% for AGIs $50k-75k, 82.6% for AGIs $75k-100k, 78.8% for AGIs $100k-200k, 20.6% for AGIs over 200k)
Taxable interest for individuals: $991 (reported on 8.9% of returns)
This zip code:
$991
Texas:
$2,372
(% of AGI for various income ranges: 0.2% for AGIs below $25k, 0.2% for AGIs $25k-50k, 0.1% for AGIs $50k-75k, 0.5% for AGIs $75k-100k, 0.2% for AGIs $100k-200k, 1.6% for AGIs over 200k)
Ordinary dividends: $3,003 (reported on 3.2% of returns)
Here:
$3,003
State:
$9,721
(% of AGI for various income ranges: 0.5% for AGIs below $25k, 0.3% for AGIs $25k-50k, 0.2% for AGIs $50k-75k, 0.5% for AGIs $75k-100k, 0.5% for AGIs $100k-200k)
Net capital gain/loss in AGI: +$20,150 (reported on 2.2% of returns)
Here:
+$20,150
State:
+$35,319
(% of AGI for various income ranges: 0.1% for AGIs below $25k, 0.1% for AGIs $25k-50k, 0.3% for AGIs $50k-75k, 1.3% for AGIs $75k-100k, 20.1% for AGIs $100k-200k)
Profit/loss from business: +$8,650 (reported on 14.6% of returns)
Here:
+$8,650
State:
+$13,732
(% of AGI for various income ranges: 9.9% for AGIs below $25k, 2.1% for AGIs $25k-50k, 1.5% for AGIs $50k-75k, 2.1% for AGIs $75k-100k, 7.5% for AGIs $100k-200k)
Taxable individual retirement arrangement distribution: $10,146 (reported on 2.4% of returns)
77803:
$10,146
Texas:
$19,511
(% of AGI for various income ranges: 0.5% for AGIs below $25k, 0.5% for AGIs $25k-50k, 1.1% for AGIs $50k-75k, 3.7% for AGIs $75k-100k)
Total itemized deductions: $17,020 (26% of AGI, reported on 7.8% of returns)
Here:
$17,020
State:
$24,724
Here:
25.8% of AGI
State:
15.9% of AGI
(% of AGI for various income ranges: 2.2% for AGIs below $25k, 4.5% for AGIs $25k-50k, 5.6% for AGIs $50k-75k, 7.8% for AGIs $75k-100k, 7.3% for AGIs $100k-200k, 4.0% for AGIs over 200k)
Charity contributions: $4,441 (reported on 5.0% of returns)
Here:
$4,441
State:
$6,808
(% of AGI for various income ranges: 0.2% for AGIs below $25k, 0.5% for AGIs $25k-50k, 1.1% for AGIs $50k-75k, 1.8% for AGIs $75k-100k, 2.7% for AGIs $100k-200k)
Taxes paid: $3,882 (reported on 7.1% of returns)
77803:
$3,882
State:
$6,921
(% of AGI for various income ranges: 0.4% for AGIs below $25k, 1.0% for AGIs $25k-50k, 1.1% for AGIs $50k-75k, 1.4% for AGIs $75k-100k, 1.6% for AGIs $100k-200k, 1.1% for AGIs over 200k)
Earned income credit: $2,857 (reported on 40.0% of returns)
Here:
$2,857
State:
$2,570
(% of AGI for various income ranges: 11.8% for AGIs below $25k, 2.2% for AGIs $25k-50k)
Percentage of individuals using paid preparers for their 2012 taxes: 53.3%
Here:
53%
State:
51%
(% for various income ranges: 53.5% for AGIs below $25k, 52.6% for AGIs $25k-50k, 55.1% for AGIs $50k-75k, 48.6% for AGIs $75k-100k, 55.6% for AGIs $100k-200k, 66.7% for AGIs over 200k)
Averages for the 2004 tax year for zip code 77803, filed in 2005:
Average Adjusted Gross Income (AGI) in 2004: $23,798 (Individual Income Tax Returns)
Here:
$23,798
State:
$47,881
Salary/wage: $22,820 (reported on 91.7% of returns)
Here:
$22,820
State:
$41,947
(% of AGI for various income ranges: 95.0% for AGIs below $10k, 90.5% for AGIs $10k-25k, 90.8% for AGIs $25k-50k, 87.5% for AGIs $50k-75k, 80.4% for AGIs $75k-100k, 57.3% for AGIs over 100k)
Taxable interest for individuals: $953 (reported on 13.5% of returns)
This zip code:
$953
Texas:
$2,255
(% of AGI for various income ranges: 0.8% for AGIs below $10k, 0.4% for AGIs $10k-25k, 0.5% for AGIs $25k-50k, 0.6% for AGIs $50k-75k, 0.4% for AGIs $75k-100k, 1.2% for AGIs over 100k)
Taxable dividends: $1,193 (reported on 4.7% of returns)
Here:
$1,193
State:
$4,261
(% of AGI for various income ranges: 0.3% for AGIs below $10k, 0.2% for AGIs $10k-25k, 0.2% for AGIs $25k-50k, 0.3% for AGIs $50k-75k, 0.1% for AGIs $75k-100k, 0.4% for AGIs over 100k)
Net capital gain/loss: +$3,432 (reported on 3.6% of returns)
Here:
+$3,432
State:
+$16,110
(% of AGI for various income ranges: -0.4% for AGIs below $10k, 0.1% for AGIs $10k-25k, 0.2% for AGIs $25k-50k, 0.2% for AGIs $50k-75k, 0.4% for AGIs $75k-100k, 6.8% for AGIs over 100k)
Profit/loss from business: +$5,946 (reported on 12.6% of returns)
Here:
+$5,946
State:
+$11,013
(% of AGI for various income ranges: 7.0% for AGIs below $10k, 3.9% for AGIs $10k-25k, 2.1% for AGIs $25k-50k, 1.9% for AGIs $50k-75k, 4.8% for AGIs $75k-100k, 4.6% for AGIs over 100k)
IRA payment deduction: $2,484 (reported on 1.0% of returns)
77803:
$2,484
Texas:
$3,120
Total itemized deductions: $14,844 (30% of AGI, reported on 7.5% of returns)
Here:
$14,844
State:
$19,631
Here:
29.5% of AGI
State:
18.9% of AGI
(% of AGI for various income ranges: 2.8% for AGIs below $10k, 2.1% for AGIs $10k-25k, 5.1% for AGIs $25k-50k, 6.4% for AGIs $50k-75k, 7.6% for AGIs $75k-100k, 9.3% for AGIs over 100k)
Charity contributions deductions: $3,896 (7% of AGI, reported on 5.8% of returns)
Here:
$3,896
State:
$4,753
Here:
7.3% of AGI
State:
4.2% of AGI
(% of AGI for various income ranges: 0.2% for AGIs below $10k, 0.3% for AGIs $10k-25k, 0.8% for AGIs $25k-50k, 1.3% for AGIs $50k-75k, 2.6% for AGIs $75k-100k, 3.6% for AGIs over 100k)
Total tax: $2,661 (reported on 52.5% of returns)
77803:
$2,661
State:
$9,058
(% of AGI for various income ranges: 2.7% for AGIs below $10k, 2.5% for AGIs $10k-25k, 5.2% for AGIs $25k-50k, 8.3% for AGIs $50k-75k, 10.9% for AGIs $75k-100k, 19.0% for AGIs over 100k)
Earned income credit: $2,121 (reported on 42.4% of returns)
Here:
$2,121
State:
$2,024
Percentage of individuals using paid preparers for their 2004 taxes: 63.7%
Here:
64%
State:
57%
(% for various income ranges: 61.9% for AGIs below $10k, 70.1% for AGIs $10k-25k, 58.2% for AGIs $25k-50k, 52.3% for AGIs $50k-75k, 59.9% for AGIs $75k-100k, 52.0% for AGIs over 100k)
Likely homosexual households (counted as self-reported same-sex unmarried-partner households)
Lesbian couples: 0.1% of all households
Gay men: 0.2% of all households
Household received Food Stamps/SNAP in the past 12 months: 2,176 Household did not receive Food Stamps/SNAP in the past 12 months: 7,817
Women who had a birth in the past 12 months: 565 (336 now married, 226 unmarried) Women who did not have a birth in the past 12 months: 7,804 (2,823 now married, 4,999 unmarried)
Housing units in zip code 77803 with a mortgage: 2,900 Houses without a mortgage: 13
Median monthly owner costs for units with a mortgage: $1,220 Median monthly owner costs for units without a mortgage: $475
Residents with income below the poverty level in 2022:
This zip code:
28.1%
Whole state:
14.0%
Residents with income below 50% of the poverty level in 2022:
This zip code:
18.7%
Whole state:
7.4%
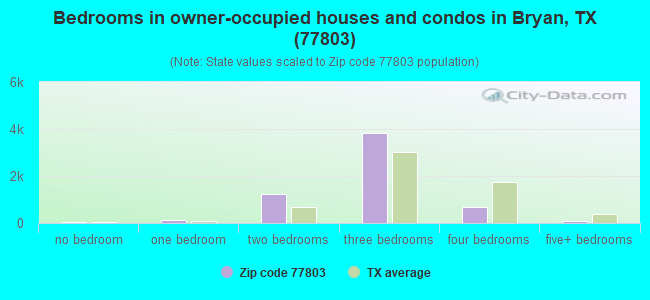
Median number of rooms in houses and condos:
Here:
5.3
State:
6.3
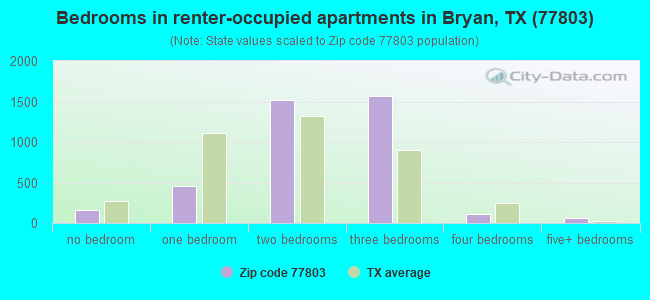
Median number of rooms in apartments:
Here:
4.5
State:
4.0
Notable locations in this zip code not listed on our city pages
Notable locations in zip code 77803: East Side Historic District (A), Edward J Jenkins House (B), E J Blazek House (C), English-Poindexter House (D), English-Dansby House (E), Eugene Edge House (F), First State Bank and Trust Building (G), First National Bank and Trust Building (H), Griesser Bakery and CSPS Lodge (I), Humpty Dumpty Store (J), J M Jones House (K), James O Chance House (L), McDougal-Jones House (M), Minnie Zulch Zimmerman House (N), Milton Parker House (O), Moore House (P), Bryan County Courthouse (Q), Bryan Fire Department Station 4 (R), Howell House (S), Bryan Fire Department (T). Display/hide their locations on the map
Churches in zip code 77803 include: Santa Teresa Church (A), Temple Freda (B), Saint Andrews Episcopal Church (C), Saint Anthonys Catholic Church (D), First Baptist Church (E). Display/hide their locations on the map
Parks in zip code 77803 include: Henderson Park (1), Scurry Park (2), Bronco Field (3), Sadie Thomas Memorial Park (4), Haswell Memorial Park (5), Lobo Stadium - Jane Long Middle School (6), Bronco Stadium (7), Bonham Park (8). Display/hide their locations on the map
3,686 married couples with children.
4,189 single-parent households (772 men, 3,417 women).
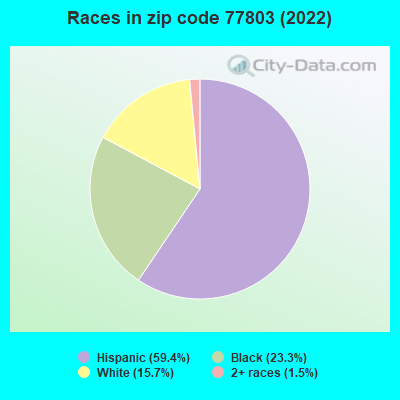
52.5% of residents of 77803 zip code speak English at home.
45.9% of residents speak Spanish at home (51% very well, 24% well, 19% not well, 6% not at all).
0.1% of residents speak other Indo-European language at home (91% very well, 9% not at all).
0.1% of residents speak Asian or Pacific Island language at home (100% not well).
0.4% of residents speak other language at home (65% very well, 35% well).
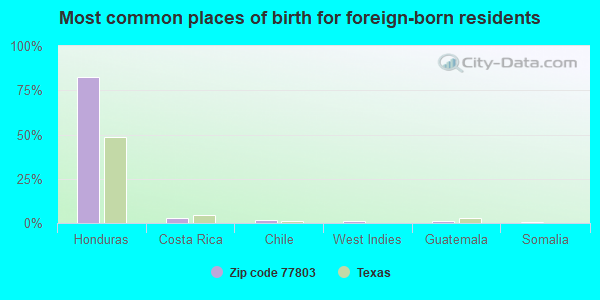
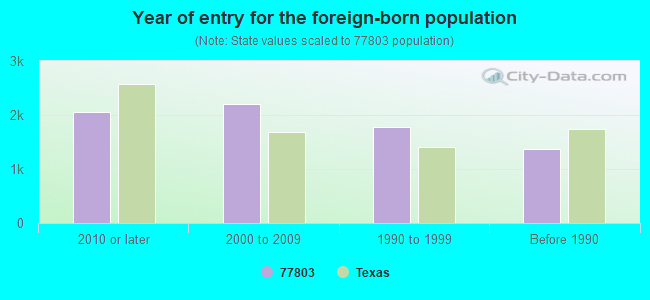
Foreign born population: 7,097 (21.5%) (27.1% of them are naturalized citizens)
Facilities with environmental interests located in this zip code:
ANSON JONES ELEMENTARY (1400 PECAN ST in BRYAN, TX)
(National Center for Education Statistics) - STATE ID-021902115 Organizations: BRYAN ISD (SCHOOL DISTRICT)
Housing units lacking complete plumbing facilities: 1.2% Housing units lacking complete kitchen facilities: 0.5%
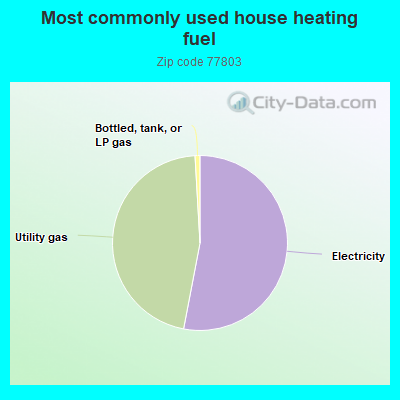
52.8%Electricity
45.9%Utility gas
0.9%Bottled, tank, or LP gas
Population in 1990: 32,052.
Place of birth for U.S.-born residents:
This state: 21,703
Northeast: 308
Midwest: 1,009
South: 1,441
West: 876
50% of the 77803 zip code residents lived in the same house 5 years ago. Out of people who lived in different houses, 65% lived in this county. Out of people who lived in different counties, 50% lived in Texas.
85% of the 77803 zip code residents lived in the same house 1 year ago. Out of people who lived in different houses, 46% moved from this county. Out of people who lived in different houses, 35% moved from different county within same state. Out of people who lived in different houses, 11% moved from different state. Out of people who lived in different houses, 8% moved from abroad.
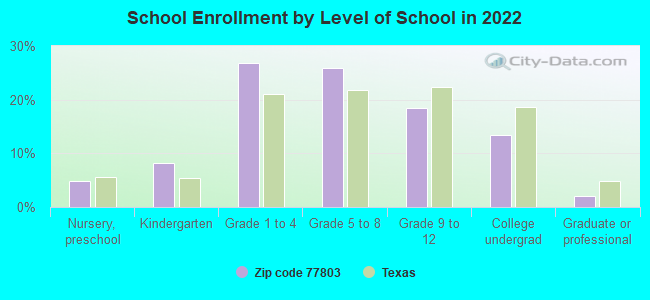
Private vs. public school enrollment:
Students in private schools in grades 1 to 8 (elementary and middle school): 170
Here:
4.0%
Texas:
8.8%
Students in private schools in grades 9 to 12 (high school): 16
Here:
1.1%
Texas:
8.0%
Students in private undergraduate colleges: 123
Here:
11.2%
Texas:
16.2%
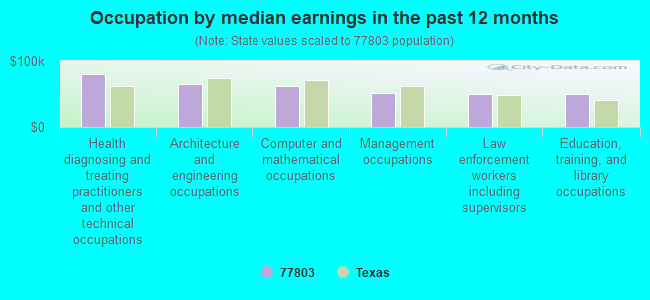
Occupation by median earnings in the past 12 months ($)
80,263Health diagnosing and treating practitioners and other technical occupations
65,010Architecture and engineering occupations
61,788Computer and mathematical occupations
50,801Management occupations
50,491Law enforcement workers including supervisors
49,986Education, training, and library occupations
Companies with federal contracts located in this zip code:
FIBER DYNAMICS INCORPORATED (909 INDUSTRIAL BLVD in BRYAN, TX; small business) : $1,139,235 in 8 contractsfrom 2000 to 2003
Contracts for Defense Ships -- Basic Research (R&D) by Navy Signed by year:2000: $430,000; 2001: $0; 2002: $543,967; 2003: $165,268; 2004: $0; 2005: $0; 2006: $0.
Biggest contracts:
$400,000 with Navy for Defense Ships -- Basic Research (R&D). Signed on 2000-08-23. Completion date: 2003-08-23.
$201,735, same as above.Signed on 2002-05-30. Completion date: 2003-08-23.
$165,268, same as above.Signed on 2003-02-04. Completion date: 2003-08-23.
$150,726, same as above.Signed on 2002-04-11. Completion date: 2003-08-23.
DYNACON INC (831 INDUSTRIAL BLVD in BRYAN, TX; small business) : $711,999 in 16 contractsfrom 2000 to 2005
Contracts for Engineering and Technical Services, Miscellaneous Construction Equipment, Maintenance, Repair and Rebuilding of Equipment -- Materials Handling Equipment, Winches, Hoists, Cranes, and Derricks, and moreby Navy, National Oceanic and Atmospheric Administration/Under Secretary for Oceans and Atmosphere Signed by year:2000: $74,495; 2001: $39,020; 2002: $164,817; 2003: $300,859; 2004: $54,672; 2005: $78,136; 2006: $0.
Biggest contracts:
$105,884 with Navy for Engineering and Technical Services. Signed on 2003-09-15. Completion date: 2004-03-15.
$91,783 with Navy for Miscellaneous Construction Equipment. Signed on 2002-07-12. Completion date: 2002-10-01.
$76,417 with Navy for Engineering and Technical Services. Signed on 2003-09-30. Completion date: 2004-03-31.
$74,495 with Navy for Maintenance, Repair and Rebuilding of Equipment -- Materials Handling Equipment. Signed on 2000-12-26. Completion date: 2001-05-21.
SCARMARDO PRODUCE, INC (1289 N HARVEY MITCHELL PK in BRYAN, TX; small business) : $70,843 in 14 contractsfrom 2004 to 2005
Contracts for Fruits and Vegetables, by Defense Logistics Agency, Bureau of Prisoners/Federal Prison System Signed by year:2000: $0; 2001: $0; 2002: $0; 2003: $0; 2004: $33,207; 2005: $37,636; 2006: $0.
Biggest contracts:
$7,216 with Defense Logistics Agency for Fruits and Vegetables. Signed on 2005-09-15. Completion date: 2005-09-15.
$6,481, same as above.Signed on 2005-09-10. Completion date: 2005-09-10.
$5,730, same as above.Signed on 2004-11-13. Completion date: 2004-11-13.
$5,227, same as above.Signed on 2004-11-06. Completion date: 2004-11-06.
a coat of many colors (3017 Alabama St in Bryan, TX; small business) : $14,905 in 15 contractsfrom 2003 to 2005
Contracts for Construction of Structures and Facilities -- Miscellaneous Buildings, by Agricultural Research Service Signed by year:2000: $0; 2001: $0; 2002: $0; 2003: $3,000; 2004: $6,395; 2005: $5,510; 2006: $0.
Biggest contracts:
$1,950 with Agricultural Research Service for Construction of Structures and Facilities -- Miscellaneous Buildings. Signed on 2003-10-14. Effective on 2003-10-15. Completion date: 2003-10-16.
$1,850, same as above.Signed on 2004-12-14. Completion date: 2004-12-14.
$1,425, same as above.Signed on 2005-10-21. Completion date: 2005-10-21.
$1,200, same as above.Signed on 2004-09-20. Completion date: 2004-09-20.
COTHERN, RIDLEY B (1204 E 23RD ST in BRYAN, TX; small business) : $7,920 in 2 contractsfrom 2005 to 2006
$11,800 with Air Force for Inspection Services (including commercial testing and lab services, except medical/dental) -- Ground Effect Vehicles, Motor Vehicles, Trailers, and Cycles. Taking place in FL. Signed on 2005-05-25. Completion date: 2005-06-10.
-$3,880, same as above.Signed on 2006-02-27. Completion date: 2006-03-01.
luther price cabinet company (4110 Laura Lane in Bryan, TX; small business)
$1,845 with Agricultural Research Service for Construction of Structures and Facilities -- Miscellaneous Buildings. Signed on 2005-02-10. Completion date: 2005-02-10.
MARCELINO MUNOZ (213 MAIN ST in BRYAN, TX; small business)
$1,475 with Agricultural Research Service for Installation of Equipment -- Miscellaneous. Signed on 2002-09-15. Completion date: 2002-09-15.
Top industries in this zip code by the number of employees in 2005:
Health Care and Social Assistance: Home Health Care Services (250-499 employees: 1 establishment, 50-99 employees: 1 establishment)
Health Care and Social Assistance: Other Individual and Family Services (250-499: 1, 10-19: 2, 1-4: 3)
Other Services (except Public Administration): Religious Organizations (50-99: 1, 20-49: 2, 10-19: 2, 5-9: 5, 1-4: 9)
Administrative and Support and Waste Management and Remediation Services: Janitorial Services (100-249: 1, 5-9: 3, 1-4: 6)
2002 - 2018 National Fire Incident Reporting System (NFIRS) incidents
According to the data from the years 2002 - 2018 the average number of fires per year is 105. The highest number of reported fire incidents - 139 took place in 2005, and the least - 62 in 2009. The data has a growing trend.
When looking into fire subcategories, the most reports belonged to: Outside Fires (40.0%), and Structure Fires (37.2%).
Fire incident types reported to NFIRS in Zip Code 77803


 Nearest zip codes: 77801, 77802, 77840, 77807, 77808, 77845.


 According to the data from the years 2002 - 2018 the average number of fires per year is 105. The highest number of reported fire incidents - 139 took place in 2005, and the least - 62 in 2009. The data has a growing trend.
 When looking into fire subcategories, the most reports belonged to: Outside Fires (40.0%), and Structure Fires (37.2%).