Estimated zip code population in 2022: 11,182 Zip code population in 2010: 9,567 Zip code population in 2000: 9,242
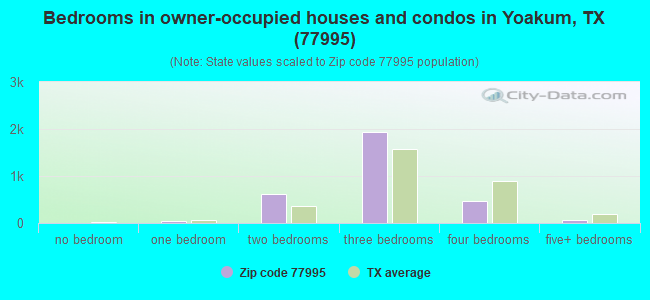
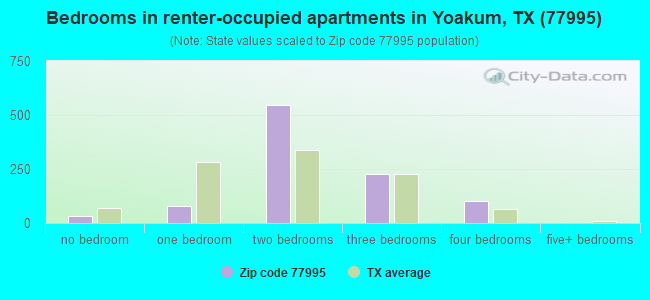
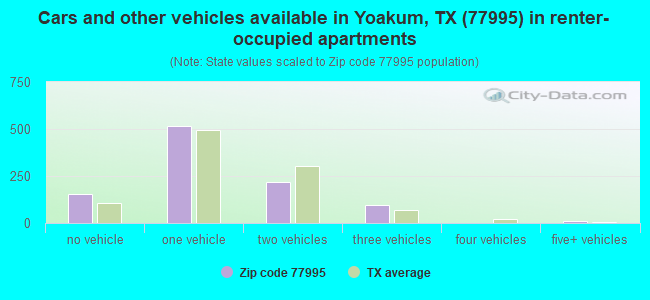
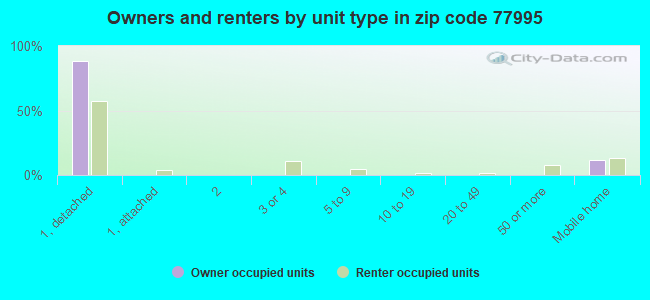
Houses and condos: 4,963 Renter-occupied apartments: 994
% of renters here:
24%
State:
38%
March 2022 cost of living index in zip code 77995: 79.6 (low, U.S. average is 100)
Land area: 356.8 sq. mi. Water area: 0.5 sq. mi.
Population density: 31 people per square mile
(very low).
OSM Map
General Map
Google Map
MSN Map
OSM Map
General Map
Google Map
MSN Map
OSM Map
General Map
Google Map
MSN Map
OSM Map
General Map
Google Map
MSN Map
Please wait while loading the map...
Real estate property taxes paid for housing units in 2022:
This zip code:
1.1% ($2,181)
Texas:
1.5% ($4,050)
Median real estate property taxes paid for housing units with mortgages in 2022: $2,750 (1.1%) Median real estate property taxes paid for housing units with no mortgage in 2022: $1,593 (0.9%)
Business Search- 14 Million verified businesses
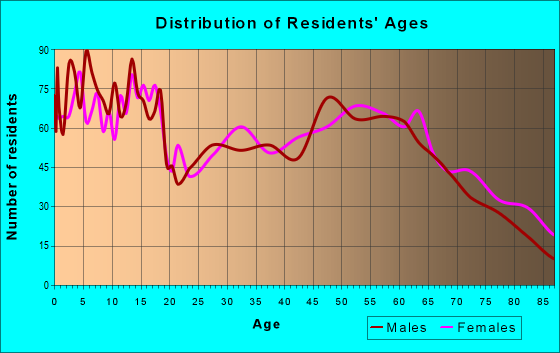
Males: 5,618
(50.2%)
Females: 5,564
(49.8%)
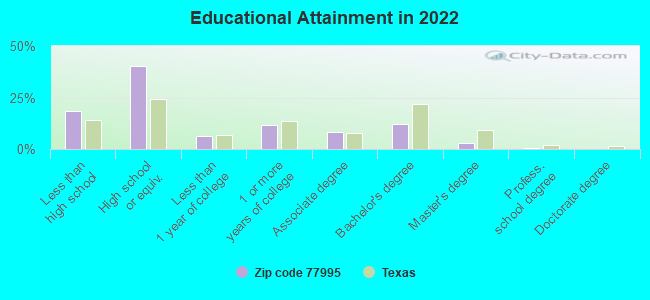
For population 25 years and over in 77995:
High school or higher: 80.0%
Bachelor's degree or higher: 15.0%
Graduate or professional degree: 3.3%
Unemployed: 2.6%
Mean travel time to work (commute): 20.8 minutes
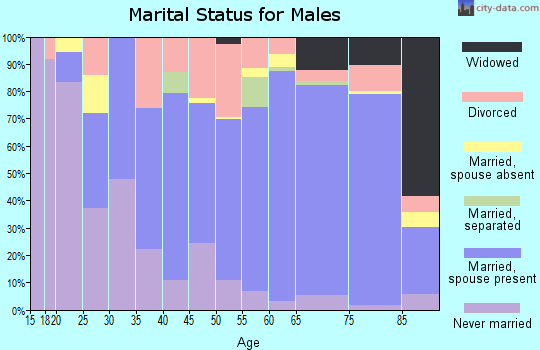
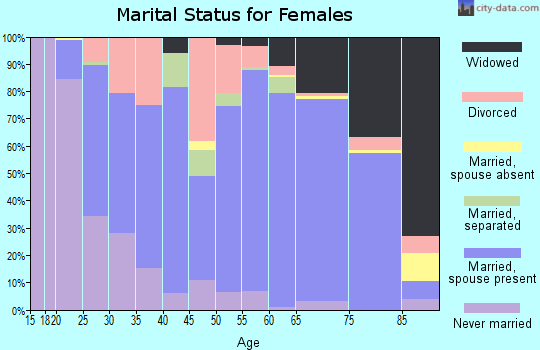
For population 15 years and over in 77995:
Never married: 24.4%
Now married: 54.2%
Separated: 1.9%
Widowed: 8.1%
Divorced: 11.4%
Zip code 77995 compared to state average:
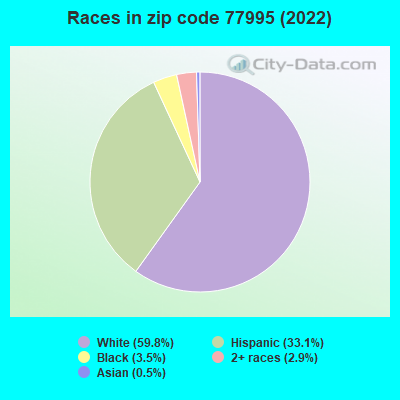
Black race population percentage significantly below state average.
Foreign-born population percentage below state average.
Renting percentage below state average.
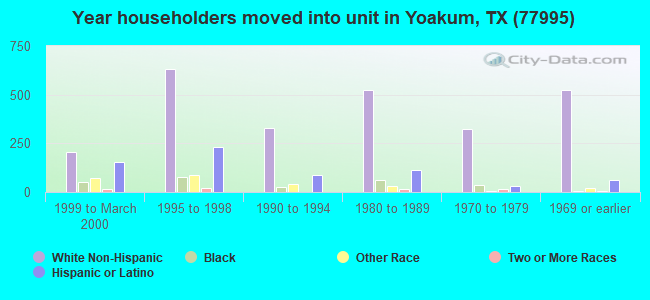
Length of stay since moving in significantly above state average.
House age above state average.
Number of college students below state average.
Percentage of population with a bachelor's degree or higher significantly below state average.
Averages for the 2020 tax year for zip code 77995, filed in 2021:
Average Adjusted Gross Income (AGI) in 2020: $58,968 (Individual Income Tax Returns)
Here:
$58,968
State:
$77,054
Salary/wage: $46,289 (reported on 79.5% of returns)
Here:
$46,289
State:
$62,766
(% of AGI for various income ranges: 1271.8% for AGIs below $25k, 3774.4% for AGIs $25k-50k, 6416.6% for AGIs $50k-75k, 9914.8% for AGIs $75k-100k, 16480.8% for AGIs $100k-200k, 51512.5% for AGIs over 200k)
Taxable interest for individuals: $1,793 (reported on 32.1% of returns)
This zip code:
$1,793
Texas:
$2,665
(% of AGI for various income ranges: 20.6% for AGIs below $25k, 28.2% for AGIs $25k-50k, 46.3% for AGIs $50k-75k, 139.5% for AGIs $75k-100k, 210.4% for AGIs $100k-200k, 2380.0% for AGIs over 200k)
Ordinary dividends: $5,833 (reported on 16.0% of returns)
Here:
$5,833
State:
$10,044
(% of AGI for various income ranges: 16.1% for AGIs below $25k, 28.9% for AGIs $25k-50k, 79.8% for AGIs $50k-75k, 165.7% for AGIs $75k-100k, 355.8% for AGIs $100k-200k, 4952.5% for AGIs over 200k)
Net capital gain/loss in AGI: +$20,061 (reported on 16.3% of returns)
Here:
+$20,061
State:
+$39,590
(% of AGI for various income ranges: 7.8% for AGIs below $25k, 55.4% for AGIs $25k-50k, 110.5% for AGIs $50k-75k, 281.0% for AGIs $75k-100k, 806.9% for AGIs $100k-200k, 25837.5% for AGIs over 200k)
Profit/loss from business: +$12,941 (reported on 18.4% of returns)
Here:
+$12,941
State:
+$10,888
(% of AGI for various income ranges: 107.9% for AGIs below $25k, 48.0% for AGIs $25k-50k, 203.4% for AGIs $50k-75k, 338.6% for AGIs $75k-100k, 585.8% for AGIs $100k-200k, 13550.0% for AGIs over 200k)
Taxable individual retirement arrangement distribution: $18,497 (reported on 9.1% of returns)
77995:
$18,497
Texas:
$24,740
(% of AGI for various income ranges: 52.4% for AGIs below $25k, 74.1% for AGIs $25k-50k, 165.9% for AGIs $50k-75k, 549.0% for AGIs $75k-100k, 914.2% for AGIs $100k-200k, 4325.0% for AGIs over 200k)
Total itemized deductions: $38,093 (reported on 3.3% of returns)
Here:
$38,093
State:
$40,428
(% of AGI for various income ranges: 80.8% for AGIs below $25k, 287.1% for AGIs $50k-75k, 408.8% for AGIs $100k-200k, 5247.5% for AGIs over 200k)
Charity contributions: $18,130 (reported on 2.3% of returns)
Here:
$18,130
State:
$18,201
(% of AGI for various income ranges: 23.9% for AGIs $25k-50k, 197.3% for AGIs $100k-200k, 2742.5% for AGIs over 200k)
Taxes paid: $5,807 (reported on 3.3% of returns)
77995:
$5,807
State:
$7,821
(% of AGI for various income ranges: 7.5% for AGIs below $25k, 32.4% for AGIs $50k-75k, 85.4% for AGIs $100k-200k, 915.0% for AGIs over 200k)
Earned income credit: $2,770 (reported on 20.9% of returns)
Here:
$2,770
State:
$2,584
(% of AGI for various income ranges: 146.6% for AGIs below $25k, 81.2% for AGIs $25k-50k)
Percentage of individuals using paid preparers for their 2020 taxes: 90.5%
Here:
90%
State:
92%
(% for various income ranges: 89.0% for AGIs below $25k, 91.7% for AGIs $25k-50k, 91.4% for AGIs $50k-75k, 88.6% for AGIs $75k-100k, 91.5% for AGIs $100k-200k, 94.4% for AGIs over 200k)
Averages for the 2012 tax year for zip code 77995, filed in 2013:
Average Adjusted Gross Income (AGI) in 2012: $63,650 (Individual Income Tax Returns)
Here:
$63,650
State:
$65,384
Salary/wage: $42,164 (reported on 82.6% of returns)
Here:
$42,164
State:
$52,524
(% of AGI for various income ranges: 79.8% for AGIs below $25k, 80.8% for AGIs $25k-50k, 78.1% for AGIs $50k-75k, 71.9% for AGIs $75k-100k, 64.3% for AGIs $100k-200k, 22.1% for AGIs over 200k)
Taxable interest for individuals: $1,418 (reported on 36.7% of returns)
This zip code:
$1,418
Texas:
$2,372
(% of AGI for various income ranges: 1.5% for AGIs below $25k, 1.2% for AGIs $25k-50k, 0.6% for AGIs $50k-75k, 1.1% for AGIs $75k-100k, 1.0% for AGIs $100k-200k, 0.4% for AGIs over 200k)
Ordinary dividends: $5,439 (reported on 14.7% of returns)
Here:
$5,439
State:
$9,721
(% of AGI for various income ranges: 1.0% for AGIs below $25k, 0.7% for AGIs $25k-50k, 0.8% for AGIs $50k-75k, 1.0% for AGIs $75k-100k, 1.9% for AGIs $100k-200k, 1.4% for AGIs over 200k)
Net capital gain/loss in AGI: +$14,431 (reported on 14.0% of returns)
Here:
+$14,431
State:
+$35,319
(% of AGI for various income ranges: 0.4% for AGIs below $25k, 0.6% for AGIs $25k-50k, 0.7% for AGIs $50k-75k, 2.5% for AGIs $75k-100k, 3.9% for AGIs $100k-200k, 5.4% for AGIs over 200k)
Profit/loss from business: +$13,870 (reported on 19.8% of returns)
Here:
+$13,870
State:
+$13,732
(% of AGI for various income ranges: 6.9% for AGIs below $25k, 3.1% for AGIs $25k-50k, 3.9% for AGIs $50k-75k, 2.8% for AGIs $75k-100k, 7.0% for AGIs $100k-200k, 3.4% for AGIs over 200k)
Taxable individual retirement arrangement distribution: $10,850 (reported on 9.2% of returns)
77995:
$10,850
Texas:
$19,511
(% of AGI for various income ranges: 2.4% for AGIs below $25k, 1.7% for AGIs $25k-50k, 2.1% for AGIs $50k-75k, 2.3% for AGIs $75k-100k, 2.1% for AGIs $100k-200k, 0.7% for AGIs over 200k)
Self-employment retirement plans: $29,400 (reported on 0.5% of returns)
77995:
$29,400
Texas:
$23,938
Total itemized deductions: $22,985 (12% of AGI, reported on 13.3% of returns)
Here:
$22,985
State:
$24,724
Here:
12.1% of AGI
State:
15.9% of AGI
(% of AGI for various income ranges: 4.6% for AGIs below $25k, 3.6% for AGIs $25k-50k, 5.8% for AGIs $50k-75k, 6.1% for AGIs $75k-100k, 6.6% for AGIs $100k-200k, 3.7% for AGIs over 200k)
Charity contributions: $9,072 (reported on 9.7% of returns)
Here:
$9,072
State:
$6,808
(% of AGI for various income ranges: 0.4% for AGIs below $25k, 0.7% for AGIs $25k-50k, 0.6% for AGIs $50k-75k, 1.1% for AGIs $75k-100k, 1.2% for AGIs $100k-200k, 2.2% for AGIs over 200k)
Taxes paid: $4,813 (reported on 13.0% of returns)
77995:
$4,813
State:
$6,921
(% of AGI for various income ranges: 0.7% for AGIs below $25k, 0.6% for AGIs $25k-50k, 0.9% for AGIs $50k-75k, 1.4% for AGIs $75k-100k, 1.9% for AGIs $100k-200k, 0.6% for AGIs over 200k)
Earned income credit: $2,687 (reported on 21.5% of returns)
Here:
$2,687
State:
$2,570
(% of AGI for various income ranges: 8.8% for AGIs below $25k, 1.2% for AGIs $25k-50k)
Percentage of individuals using paid preparers for their 2012 taxes: 58.9%
Here:
59%
State:
51%
(% for various income ranges: 49.4% for AGIs below $25k, 58.9% for AGIs $25k-50k, 63.0% for AGIs $50k-75k, 66.7% for AGIs $75k-100k, 77.8% for AGIs $100k-200k, 93.8% for AGIs over 200k)
Averages for the 2004 tax year for zip code 77995, filed in 2005:
Average Adjusted Gross Income (AGI) in 2004: $36,279 (Individual Income Tax Returns)
Here:
$36,279
State:
$47,881
Salary/wage: $30,624 (reported on 81.8% of returns)
Here:
$30,624
State:
$41,947
(% of AGI for various income ranges: 116.7% for AGIs below $10k, 80.0% for AGIs $10k-25k, 78.0% for AGIs $25k-50k, 74.5% for AGIs $50k-75k, 76.6% for AGIs $75k-100k, 45.1% for AGIs over 100k)
Taxable interest for individuals: $1,620 (reported on 43.7% of returns)
This zip code:
$1,620
Texas:
$2,255
(% of AGI for various income ranges: 7.1% for AGIs below $10k, 2.3% for AGIs $10k-25k, 2.0% for AGIs $25k-50k, 1.4% for AGIs $50k-75k, 1.5% for AGIs $75k-100k, 1.9% for AGIs over 100k)
Taxable dividends: $2,617 (reported on 17.5% of returns)
Here:
$2,617
State:
$4,261
(% of AGI for various income ranges: 2.1% for AGIs below $10k, 0.6% for AGIs $10k-25k, 0.8% for AGIs $25k-50k, 0.8% for AGIs $50k-75k, 0.8% for AGIs $75k-100k, 2.4% for AGIs over 100k)
Net capital gain/loss: +$4,367 (reported on 17.8% of returns)
Here:
+$4,367
State:
+$16,110
(% of AGI for various income ranges: -0.3% for AGIs below $10k, 0.7% for AGIs $10k-25k, 1.1% for AGIs $25k-50k, 1.3% for AGIs $50k-75k, 2.3% for AGIs $75k-100k, 4.5% for AGIs over 100k)
Profit/loss from business: +$10,528 (reported on 18.5% of returns)
Here:
+$10,528
State:
+$11,013
(% of AGI for various income ranges: 5.4% for AGIs below $10k, 5.2% for AGIs $10k-25k, 3.2% for AGIs $25k-50k, 5.3% for AGIs $50k-75k, 4.0% for AGIs $75k-100k, 8.0% for AGIs over 100k)
IRA payment deduction: $3,209 (reported on 2.9% of returns)
77995:
$3,209
Texas:
$3,120
(% of AGI for various income ranges: 0.3% for AGIs $10k-25k, 0.3% for AGIs $25k-50k, 0.3% for AGIs $50k-75k, 0.3% for AGIs over 100k)
Self-employed pension: $12,733 (reported on 0.4% of returns)
Here:
$12,733
Texas:
$16,401
Total itemized deductions: $17,104 (19% of AGI, reported on 10.9% of returns)
Here:
$17,104
State:
$19,631
Here:
19.1% of AGI
State:
18.9% of AGI
(% of AGI for various income ranges: 11.7% for AGIs below $10k, 2.6% for AGIs $10k-25k, 4.3% for AGIs $25k-50k, 5.1% for AGIs $50k-75k, 7.4% for AGIs $75k-100k, 5.8% for AGIs over 100k)
Charity contributions deductions: $5,131 (5% of AGI, reported on 8.7% of returns)
Here:
$5,131
State:
$4,753
Here:
5.2% of AGI
State:
4.2% of AGI
(% of AGI for various income ranges: 0.5% for AGIs $10k-25k, 0.7% for AGIs $25k-50k, 1.0% for AGIs $50k-75k, 1.2% for AGIs $75k-100k, 2.3% for AGIs over 100k)
Total tax: $5,920 (reported on 67.4% of returns)
77995:
$5,920
State:
$9,058
(% of AGI for various income ranges: 4.1% for AGIs below $10k, 3.7% for AGIs $10k-25k, 6.2% for AGIs $25k-50k, 9.2% for AGIs $50k-75k, 10.4% for AGIs $75k-100k, 20.8% for AGIs over 100k)
Earned income credit: $2,015 (reported on 23.6% of returns)
Here:
$2,015
State:
$2,024
Percentage of individuals using paid preparers for their 2004 taxes: 70.9%
Here:
71%
State:
57%
(% for various income ranges: 66.5% for AGIs below $10k, 73.3% for AGIs $10k-25k, 69.8% for AGIs $25k-50k, 71.3% for AGIs $50k-75k, 70.2% for AGIs $75k-100k, 81.1% for AGIs over 100k)
Household received Food Stamps/SNAP in the past 12 months: 631 Household did not receive Food Stamps/SNAP in the past 12 months: 3,503
Women who had a birth in the past 12 months: 89 (57 now married, 31 unmarried) Women who did not have a birth in the past 12 months: 1,937 (964 now married, 969 unmarried)
Housing units in zip code 77995 with a mortgage: 1,114 (43 second mortgage, 31 both second mortgage and home equity loan) Median monthly owner costs for units with a mortgage: $1,549 Median monthly owner costs for units without a mortgage: $506
Residents with income below the poverty level in 2022:
This zip code:
12.7%
Whole state:
14.0%
Residents with income below 50% of the poverty level in 2022:
This zip code:
4.7%
Whole state:
7.4%
Median number of rooms in houses and condos:
Here:
5.5
State:
6.3
Median number of rooms in apartments:
Here:
4.0
State:
4.0
Notable locations in this zip code not listed on our city pages
Notable locations in zip code 77995: Yoakum Fire and Emergency Management Service Department (A), Fordtran Volunteer Fire Department (B), Yoakum Police Department (C), May-Hickey House (D), Baker House (E), Municipal Power Plant (F). Display/hide their locations on the map
Churches in zip code 77995 include: Mount Sinai Baptist Church (A), First Presbyterian Church (B), Holy Communion Episcopal Church (C), Forrest Street Church of God in Christ (D), Saint Johns Baptist Church (E), Pleasant Grove Church (F), Saint Anns Church (G), Leesville Church (H), Hebron Church (I). Display/hide their locations on the map
Cemeteries: Saint Joseph Cemetery (1), Alexander Cemetery (2), Harless Cemetery (3), Cook-Holland Cemetery (4), County Line Cemetery (5), Oak Grove Cemetery (6), Guadalupe Cemetery (7). Display/hide their locations on the map
Reservoirs: Carroll Lake (A), Musselman Cattle Company Lake Number 1 (B), Kaiser Lake (C), Kuester Lake (D), Bathing Tank (E), Big Tank (F), Lakeside Lake (G), Windmill Tank (H). Display/hide their locations on the map
Streams, rivers, and creeks: Boggy Creek (A), Bear Branch (B), Andrews Branch (C), Turkey Creek (D), South Chicolete Creek (E), Willow Prong (F), Williams Branch (G), Tonqua Creek (H), Roundhouse Creek (I). Display/hide their locations on the map
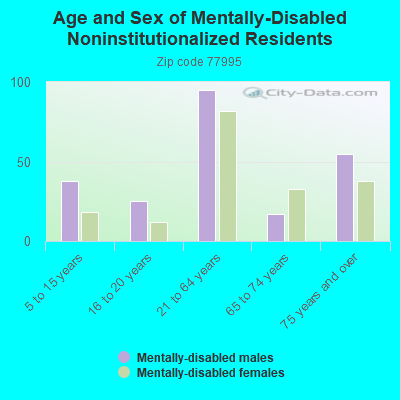
In group quarters: 222 (-1 institutionalized population)
Size of family households: 1,374 2-persons, 631 3-persons, 493 4-persons, 296 5-persons, 82 6-persons, 39 7-or-more-persons
Size of nonfamily households: 1,152 1-person, 47 2-persons, 8 4-persons
1,937 married couples with children.
658 single-parent households (152 men, 506 women).
81.4% of residents of 77995 zip code speak English at home.
16.6% of residents speak Spanish at home (65% very well, 19% well, 8% not well, 8% not at all).
1.4% of residents speak other Indo-European language at home (92% very well, 8% well).
0.8% of residents speak Asian or Pacific Island language at home (60% very well, 8% well, 32% not well).
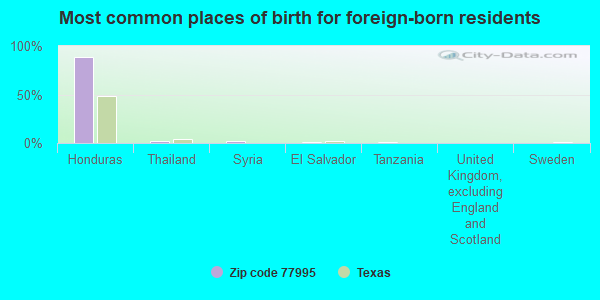
Foreign born population: 829 (7.4%) (7.3% of them are naturalized citizens)
This zip code:
7.4%
Whole state:
17.2%
89%Honduras
3%Thailand
2%Syria
1%El Salvador
1%Tanzania
0%United Kingdom, excluding England and Scotland
0%Sweden
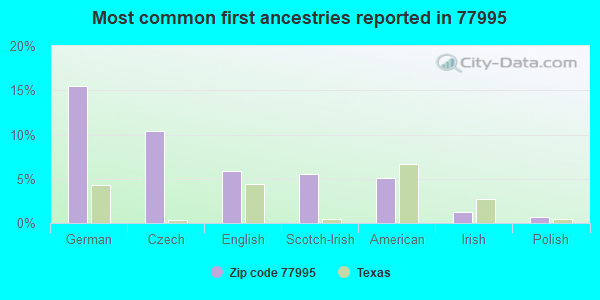
16%German
10%Czech
6%English
6%Scotch-Irish
5%American
1%Irish
1%Polish
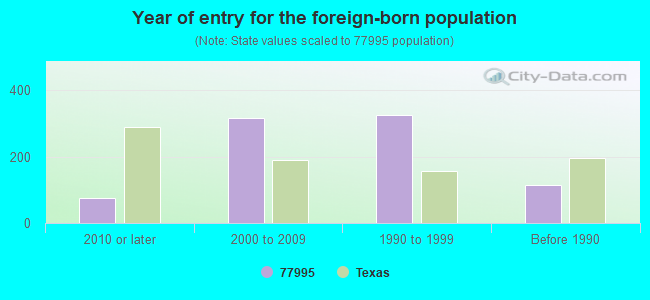
Year of entry for the foreign-born population
742010 or later
3162000 to 2009
3251990 to 1999
115Before 1990
Facilities with environmental interests located in this zip code:
ARMSTRONG GAS PLANT (10 MI S OF YOAKUM ON FM 682 in YOAKUM, TX)
CRITERIA AND HAZARDOUS AIR POLLUTANT INVENTORY (Inventory of air pollution sources) Business SIC classification: NATURAL GAS LIQUIDS
Housing units lacking complete plumbing facilities: 2.5% Housing units lacking complete kitchen facilities: 3.0%
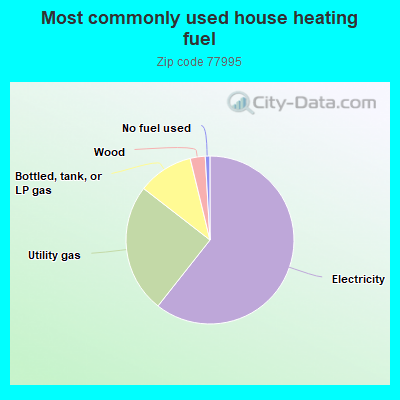
60.7%Electricity
24.9%Utility gas
10.7%Bottled, tank, or LP gas
2.9%Wood
0.9%No fuel used
Population in 1990: 9,747.
Place of birth for U.S.-born residents:
This state: 9,246
Northeast: 153
Midwest: 155
South: 326
West: 329
64% of the 77995 zip code residents lived in the same house 5 years ago. Out of people who lived in different houses, 43% lived in this county. Out of people who lived in different counties, 50% lived in Texas.
94% of the 77995 zip code residents lived in the same house 1 year ago. Out of people who lived in different houses, 53% moved from this county. Out of people who lived in different houses, 45% moved from different county within same state. Out of people who lived in different houses, 3% moved from abroad.
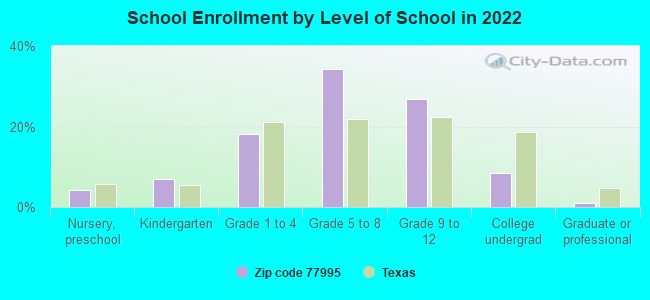
Private vs. public school enrollment:
Students in private schools in grades 1 to 8 (elementary and middle school): 186
Here:
13.9%
Texas:
8.8%
Students in private schools in grades 9 to 12 (high school): 199
Here:
28.9%
Texas:
8.0%
Students in private undergraduate colleges: 16
Here:
7.8%
Texas:
16.2%
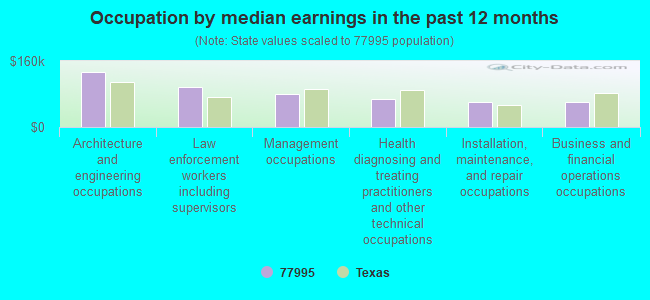
Occupation by median earnings in the past 12 months ($)
132,777Architecture and engineering occupations
96,464Law enforcement workers including supervisors
79,464Management occupations
67,707Health diagnosing and treating practitioners and other technical occupations
61,790Installation, maintenance, and repair occupations
61,137Business and financial operations occupations
Companies with federal contracts located in this zip code:
YOAKUM PAWN & JEWELRY (602 S US HIGHWAY 77A in YOAKUM, TX; small business) : $15,900 in 3 contractsfrom 2003 to 2005
$5,500 with Army for Landscaping/Groundskeeping Services. Signed on 2005-06-21. Completion date: 2006-07-31.
$5,300, same as above.Signed on 2004-06-18. Completion date: 2005-08-01.
$5,100, same as above.Signed on 2003-07-30. Completion date: 2004-07-31.
Top industries in this zip code by the number of employees in 2005:
Health Care and Social Assistance: Nursing Care Facilities (100-249 employees: 1 establishment, 50-99 employees: 1 establishment, 1-4 employees: 1 establishment)
Health Care and Social Assistance: General Medical and Surgical Hospitals (100-249: 1)
Mining: Support Activities for Oil and Gas Operations (50-99: 1, 5-9: 1, 1-4: 3)
Finance and Insurance: Commercial Banking (20-49: 2, 1-4: 1)
People in group quarters in 2010:
173 people in nursing facilities/skilled-nursing facilities
26 people in group homes for juveniles (non-correctional)
10 people in workers' group living quarters and job corps centers
People in group quarters in 2000:
186 people in nursing homes
23 people in other group homes
10 people in homes for the mentally ill
2 people in religious group quarters
Fatal accident statistics in 2014:
Fatal accident count: 4
Vehicles involved in fatal accidents: 6
Fatal accidents caused by drunken drivers: 1
Fatalities: 5
Persons involved in fatal accidents: 11
Pedestrians involved in fatal accidents: 0
Fatal accident statistics in 2013:
Fatal accident count: 1
Vehicles involved in fatal accidents: 2
Fatal accidents caused by drunken drivers: 2
Fatalities: 2
Persons involved in fatal accidents: 3
Pedestrians involved in fatal accidents: 0
Home Mortgage Disclosure Act Aggregated Statistics For Year 2009 (Based on 2 partial tracts)
A) FHA, FSA/RHS & VA Home Purchase Loans
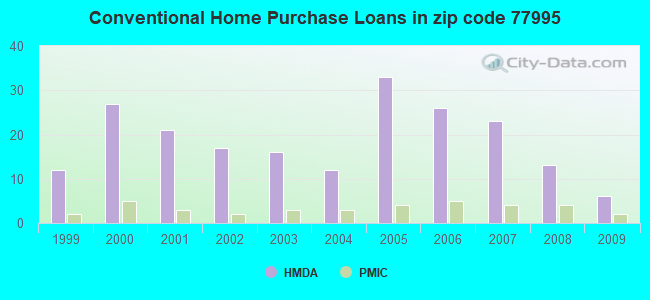
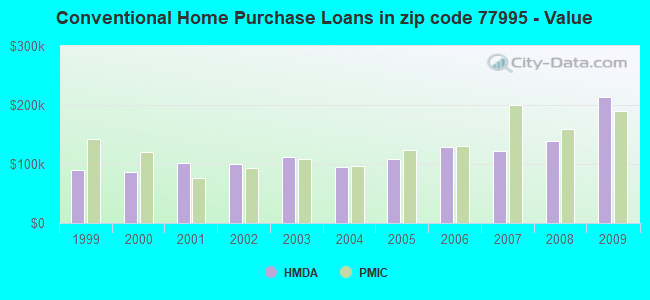
B) Conventional Home Purchase Loans
C) Refinancings
D) Home Improvement Loans
F) Non-occupant Loans on < 5 Family Dwellings (A B C & D)
G) Loans On Manufactured Home Dwelling (A B C & D)
Number
Average Value
Number
Average Value
Number
Average Value
Number
Average Value
Number
Average Value
Number
Average Value
LOANS ORIGINATED
3
$140,967
6
$213,293
20
$130,421
4
$20,250
1
$191,990
1
$35,770
APPLICATIONS APPROVED, NOT ACCEPTED
0
$0
1
$49,970
1
$115,190
1
$17,880
0
$0
1
$49,970
APPLICATIONS DENIED
1
$92,050
4
$148,858
6
$97,748
1
$36,820
1
$39,450
2
$49,445
APPLICATIONS WITHDRAWN
1
$79,950
5
$116,982
5
$143,914
0
$0
0
$0
0
$0
FILES CLOSED FOR INCOMPLETENESS
0
$0
0
$0
2
$149,120
0
$0
0
$0
0
$0
Aggregated Statistics For Year 2008 (Based on 2 partial tracts)
A) FHA, FSA/RHS & VA Home Purchase Loans
B) Conventional Home Purchase Loans
C) Refinancings
D) Home Improvement Loans
F) Non-occupant Loans on < 5 Family Dwellings (A B C & D)
G) Loans On Manufactured Home Dwelling (A B C & D)
Number
Average Value
Number
Average Value
Number
Average Value
Number
Average Value
Number
Average Value
Number
Average Value
LOANS ORIGINATED
4
$143,860
13
$139,390
13
$116,529
4
$49,050
1
$120,450
1
$64,700
APPLICATIONS APPROVED, NOT ACCEPTED
0
$0
1
$126,770
1
$189,360
0
$0
0
$0
0
$0
APPLICATIONS DENIED
1
$113,090
6
$89,770
8
$68,051
3
$72,763
2
$56,545
3
$56,283
APPLICATIONS WITHDRAWN
2
$102,570
8
$84,358
4
$118,875
0
$0
1
$130,450
1
$96,780
FILES CLOSED FOR INCOMPLETENESS
0
$0
0
$0
1
$88,370
0
$0
0
$0
0
$0
Aggregated Statistics For Year 2007 (Based on 2 partial tracts)
A) FHA, FSA/RHS & VA Home Purchase Loans
B) Conventional Home Purchase Loans
C) Refinancings
D) Home Improvement Loans
F) Non-occupant Loans on < 5 Family Dwellings (A B C & D)
G) Loans On Manufactured Home Dwelling (A B C & D)
Number
Average Value
Number
Average Value
Number
Average Value
Number
Average Value
Number
Average Value
Number
Average Value
LOANS ORIGINATED
4
$118,088
23
$121,963
10
$101,781
8
$44,315
2
$53,125
1
$69,960
APPLICATIONS APPROVED, NOT ACCEPTED
2
$84,160
4
$116,245
2
$95,205
2
$19,460
0
$0
1
$56,810
APPLICATIONS DENIED
0
$0
5
$87,000
12
$86,790
5
$21,040
2
$82,055
2
$28,665
APPLICATIONS WITHDRAWN
0
$0
3
$127,993
8
$82,056
1
$31,560
1
$100,990
0
$0
FILES CLOSED FOR INCOMPLETENESS
0
$0
2
$177,260
2
$122,820
1
$37,350
0
$0
0
$0
Aggregated Statistics For Year 2006 (Based on 2 partial tracts)
A) FHA, FSA/RHS & VA Home Purchase Loans
B) Conventional Home Purchase Loans
C) Refinancings
D) Home Improvement Loans
F) Non-occupant Loans on < 5 Family Dwellings (A B C & D)
G) Loans On Manufactured Home Dwelling (A B C & D)
Number
Average Value
Number
Average Value
Number
Average Value
Number
Average Value
Number
Average Value
Number
Average Value
LOANS ORIGINATED
2
$78,375
26
$129,538
11
$78,087
8
$49,181
3
$103,623
2
$70,485
APPLICATIONS APPROVED, NOT ACCEPTED
0
$0
4
$31,035
3
$76,270
2
$58,125
0
$0
4
$43,000
APPLICATIONS DENIED
0
$0
10
$73,377
6
$74,692
4
$53,390
1
$5,260
3
$32,437
APPLICATIONS WITHDRAWN
0
$0
3
$94,330
5
$129,502
2
$41,815
0
$0
0
$0
FILES CLOSED FOR INCOMPLETENESS
0
$0
1
$137,290
2
$108,095
0
$0
0
$0
0
$0
Aggregated Statistics For Year 2005 (Based on 2 partial tracts)
A) FHA, FSA/RHS & VA Home Purchase Loans
B) Conventional Home Purchase Loans
C) Refinancings
D) Home Improvement Loans
F) Non-occupant Loans on < 5 Family Dwellings (A B C & D)
G) Loans On Manufactured Home Dwelling (A B C & D)
Number
Average Value
Number
Average Value
Number
Average Value
Number
Average Value
Number
Average Value
Number
Average Value
LOANS ORIGINATED
3
$103,797
33
$108,069
16
$95,469
5
$29,036
4
$102,175
5
$38,188
APPLICATIONS APPROVED, NOT ACCEPTED
0
$0
3
$97,660
0
$0
2
$53,390
0
$0
0
$0
APPLICATIONS DENIED
0
$0
6
$97,398
8
$137,089
3
$22,617
2
$48,390
4
$69,828
APPLICATIONS WITHDRAWN
0
$0
4
$99,150
8
$118,876
2
$170,425
1
$53,650
1
$10,520
FILES CLOSED FOR INCOMPLETENESS
0
$0
0
$0
6
$122,558
0
$0
0
$0
0
$0
Aggregated Statistics For Year 2004 (Based on 2 partial tracts)
A) FHA, FSA/RHS & VA Home Purchase Loans
B) Conventional Home Purchase Loans
C) Refinancings
D) Home Improvement Loans
F) Non-occupant Loans on < 5 Family Dwellings (A B C & D)
G) Loans On Manufactured Home Dwelling (A B C & D)
Number
Average Value
Number
Average Value
Number
Average Value
Number
Average Value
Number
Average Value
Number
Average Value
LOANS ORIGINATED
3
$101,693
12
$94,987
15
$101,799
7
$30,433
1
$12,620
4
$40,240
APPLICATIONS APPROVED, NOT ACCEPTED
1
$38,920
6
$93,628
1
$172,000
1
$36,290
0
$0
1
$16,830
APPLICATIONS DENIED
1
$9,470
6
$42,168
13
$76,958
6
$33,488
1
$37,870
7
$31,786
APPLICATIONS WITHDRAWN
0
$0
2
$46,025
13
$82,905
1
$27,350
0
$0
0
$0
FILES CLOSED FOR INCOMPLETENESS
0
$0
1
$85,210
7
$111,663
1
$15,780
0
$0
0
$0
Aggregated Statistics For Year 2003 (Based on 2 partial tracts)
A) FHA, FSA/RHS & VA Home Purchase Loans
B) Conventional Home Purchase Loans
C) Refinancings
D) Home Improvement Loans
F) Non-occupant Loans on < 5 Family Dwellings (A B C & D)
Number
Average Value
Number
Average Value
Number
Average Value
Number
Average Value
Number
Average Value
LOANS ORIGINATED
2
$84,160
16
$111,315
59
$101,170
6
$41,115
0
$0
APPLICATIONS APPROVED, NOT ACCEPTED
0
$0
4
$162,402
5
$61,858
1
$42,080
1
$10,520
APPLICATIONS DENIED
0
$0
7
$58,611
22
$89,803
7
$21,190
1
$26,300
APPLICATIONS WITHDRAWN
1
$42,610
1
$136,760
13
$57,738
2
$42,345
1
$39,450
FILES CLOSED FOR INCOMPLETENESS
0
$0
0
$0
3
$81,880
0
$0
0
$0
Aggregated Statistics For Year 2002 (Based on 2 partial tracts)
A) FHA, FSA/RHS & VA Home Purchase Loans
B) Conventional Home Purchase Loans
C) Refinancings
D) Home Improvement Loans
F) Non-occupant Loans on < 5 Family Dwellings (A B C & D)
Number
Average Value
Number
Average Value
Number
Average Value
Number
Average Value
Number
Average Value
LOANS ORIGINATED
2
$94,155
17
$99,724
35
$103,261
4
$15,912
1
$97,310
APPLICATIONS APPROVED, NOT ACCEPTED
1
$36,820
4
$105,462
6
$79,250
0
$0
1
$27,880
APPLICATIONS DENIED
1
$49,440
10
$56,229
11
$62,881
3
$12,623
1
$19,990
APPLICATIONS WITHDRAWN
1
$44,180
1
$26,300
6
$111,600
0
$0
0
$0
FILES CLOSED FOR INCOMPLETENESS
0
$0
0
$0
4
$168,582
0
$0
0
$0
Aggregated Statistics For Year 2001 (Based on 2 partial tracts)
A) FHA, FSA/RHS & VA Home Purchase Loans
B) Conventional Home Purchase Loans
C) Refinancings
D) Home Improvement Loans
F) Non-occupant Loans on < 5 Family Dwellings (A B C & D)
Number
Average Value
Number
Average Value
Number
Average Value
Number
Average Value
Number
Average Value
LOANS ORIGINATED
6
$85,738
21
$101,292
19
$95,843
6
$23,143
3
$25,600
APPLICATIONS APPROVED, NOT ACCEPTED
2
$87,580
3
$41,730
5
$88,052
1
$10,520
0
$0
APPLICATIONS DENIED
0
$0
10
$57,229
9
$68,672
3
$22,617
1
$81,530
APPLICATIONS WITHDRAWN
1
$68,380
1
$77,320
5
$88,788
1
$6,310
0
$0
FILES CLOSED FOR INCOMPLETENESS
0
$0
1
$225,650
1
$61,020
0
$0
0
$0
Aggregated Statistics For Year 2000 (Based on 2 partial tracts)
A) FHA, FSA/RHS & VA Home Purchase Loans
B) Conventional Home Purchase Loans
C) Refinancings
D) Home Improvement Loans
F) Non-occupant Loans on < 5 Family Dwellings (A B C & D)
Number
Average Value
Number
Average Value
Number
Average Value
Number
Average Value
Number
Average Value
LOANS ORIGINATED
7
$71,236
27
$86,420
11
$72,349
4
$10,652
0
$0
APPLICATIONS APPROVED, NOT ACCEPTED
2
$36,820
4
$81,925
4
$86,000
1
$24,200
1
$14,730
APPLICATIONS DENIED
1
$152,540
9
$85,854
5
$63,436
2
$21,040
1
$28,930
APPLICATIONS WITHDRAWN
1
$35,770
3
$122,557
2
$42,870
1
$530
1
$6,310
FILES CLOSED FOR INCOMPLETENESS
0
$0
1
$257,740
1
$57,860
0
$0
0
$0
Aggregated Statistics For Year 1999 (Based on 1 partial tract)
A) FHA, FSA/RHS & VA Home Purchase Loans
B) Conventional Home Purchase Loans
C) Refinancings
D) Home Improvement Loans
F) Non-occupant Loans on < 5 Family Dwellings (A B C & D)
Detailed PMIC statistics for the following Tracts:0015.01
2002 - 2018 National Fire Incident Reporting System (NFIRS) incidents
According to the data from the years 2002 - 2018 the average number of fire incidents per year is 59. The highest number of fire incidents - 92 took place in 2008, and the least - 32 in 2010. The data has a rising trend.
When looking into fire subcategories, the most incidents belonged to: Outside Fires (64.4%), and Mobile Property/Vehicle Fires (15.4%).
Fire incident types reported to NFIRS in Zip Code 77995


 Nearest zip codes: 77987, 77954, 77976, 77904, 77984, 77964.
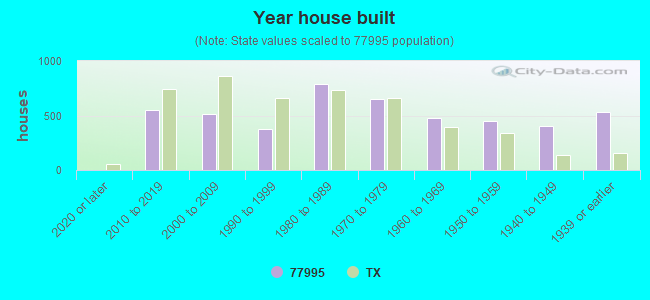


 According to the data from the years 2002 - 2018 the average number of fire incidents per year is 59. The highest number of fire incidents - 92 took place in 2008, and the least - 32 in 2010. The data has a rising trend.
 When looking into fire subcategories, the most incidents belonged to: Outside Fires (64.4%), and Mobile Property/Vehicle Fires (15.4%).