Estimated zip code population in 2022: 42,344 Zip code population in 2010: 27,558 Zip code population in 2000: 19,247
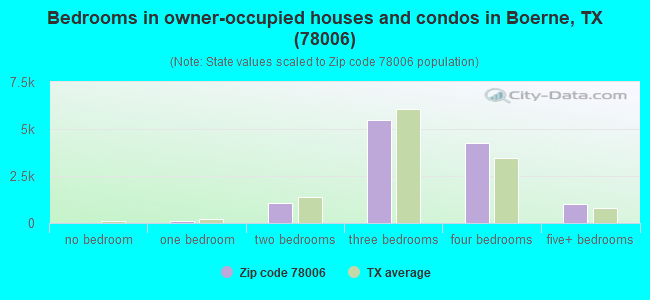
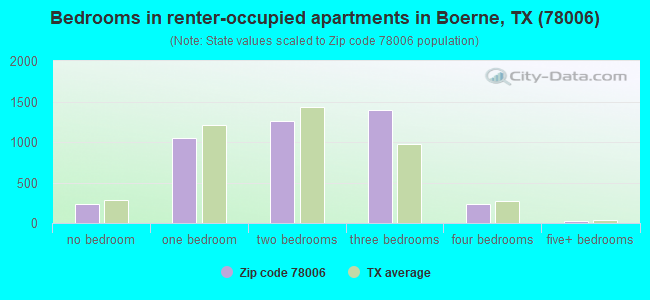
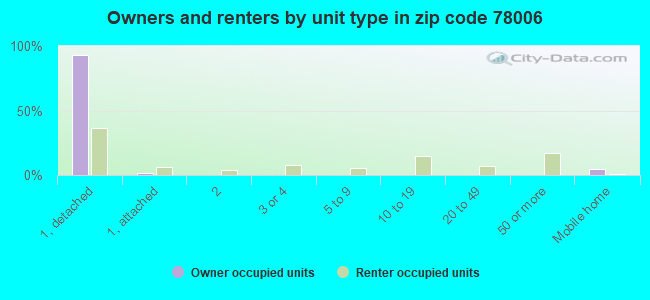
Houses and condos: 17,018 Renter-occupied apartments: 4,216
% of renters here:
26%
State:
38%
March 2022 cost of living index in zip code 78006: 83.4 (less than average, U.S. average is 100)
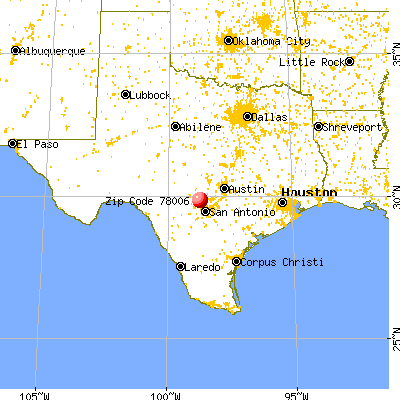
Land area: 311.8 sq. mi. Water area: 0.6 sq. mi.
Population density: 136 people per square mile
(very low).
OSM Map
General Map
Google Map
MSN Map
OSM Map
General Map
Google Map
MSN Map
OSM Map
General Map
Google Map
MSN Map
OSM Map
General Map
Google Map
MSN Map
Please wait while loading the map...
Real estate property taxes paid for housing units in 2022:
This zip code:
1.2% ($6,403)
Texas:
1.5% ($4,050)
Median real estate property taxes paid for housing units with mortgages in 2022: $7,167 (1.3%) Median real estate property taxes paid for housing units with no mortgage in 2022: $5,292 (1.0%)
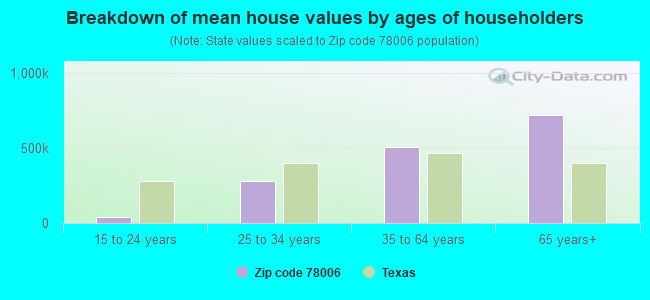
Estimated median house/condo value in 2022: $544,667
78006:
$544,667
Texas:
$275,400
According to our research of Texas and other state lists, there were 16 registered sex offenders living in 78006 zip code as of April 27, 2024. The ratio of all residents to sex offenders in zip code 78006 is 1,951 to 1. The ratio of registered sex offenders to all residents in this zip code is much lower than the state average.
Median resident age:
This zip code:
43.0 years
Texas median age:
35.6 years
Average household size:
This zip code:
2.6 people
Texas:
2.6 people
Averages for the 2020 tax year for zip code 78006, filed in 2021:
Average Adjusted Gross Income (AGI) in 2020: $187,139 (Individual Income Tax Returns)
Here:
$187,139
State:
$77,054
Salary/wage: $101,604 (reported on 74.7% of returns)
Here:
$101,604
State:
$62,766
(% of AGI for various income ranges: 1110.8% for AGIs below $25k, 3399.3% for AGIs $25k-50k, 5857.9% for AGIs $50k-75k, 8452.1% for AGIs $75k-100k, 17714.0% for AGIs $100k-200k, 86323.6% for AGIs over 200k)
Taxable interest for individuals: $4,784 (reported on 43.7% of returns)
This zip code:
$4,784
Texas:
$2,665
(% of AGI for various income ranges: 36.1% for AGIs below $25k, 65.9% for AGIs $25k-50k, 82.1% for AGIs $50k-75k, 150.4% for AGIs $75k-100k, 251.9% for AGIs $100k-200k, 3208.5% for AGIs over 200k)
Ordinary dividends: $14,107 (reported on 42.3% of returns)
Here:
$14,107
State:
$10,044
(% of AGI for various income ranges: 69.0% for AGIs below $25k, 129.5% for AGIs $25k-50k, 213.4% for AGIs $50k-75k, 336.4% for AGIs $75k-100k, 772.1% for AGIs $100k-200k, 9471.5% for AGIs over 200k)
Net capital gain/loss in AGI: +$70,549 (reported on 30.9% of returns)
Here:
+$70,549
State:
+$39,590
(% of AGI for various income ranges: 44.1% for AGIs below $25k, 93.5% for AGIs $25k-50k, 166.8% for AGIs $50k-75k, 368.6% for AGIs $75k-100k, 1006.7% for AGIs $100k-200k, 42507.2% for AGIs over 200k)
Profit/loss from business: +$22,842 (reported on 22.6% of returns)
Here:
+$22,842
State:
+$10,888
(% of AGI for various income ranges: 183.2% for AGIs below $25k, 287.7% for AGIs $25k-50k, 315.6% for AGIs $50k-75k, 581.7% for AGIs $75k-100k, 1080.9% for AGIs $100k-200k, 5753.1% for AGIs over 200k)
Taxable individual retirement arrangement distribution: $32,696 (reported on 13.6% of returns)
78006:
$32,696
Texas:
$24,740
(% of AGI for various income ranges: 66.9% for AGIs below $25k, 162.2% for AGIs $25k-50k, 385.4% for AGIs $50k-75k, 645.8% for AGIs $75k-100k, 1377.0% for AGIs $100k-200k, 4086.4% for AGIs over 200k)
Self-employed (Keogh) retirement plans: $31,004 (reported on 1.1% of returns)
78006:
$31,004
Texas:
$29,298
(% of AGI for various income ranges: 7.2% for AGIs $25k-50k, 59.3% for AGIs $100k-200k, 593.4% for AGIs over 200k)
Total itemized deductions: $48,649 (reported on 17.6% of returns)
Here:
$48,649
State:
$40,428
(% of AGI for various income ranges: 103.3% for AGIs below $25k, 235.3% for AGIs $25k-50k, 494.9% for AGIs $50k-75k, 766.8% for AGIs $75k-100k, 1582.4% for AGIs $100k-200k, 11676.9% for AGIs over 200k)
Charity contributions: $22,138 (reported on 15.2% of returns)
Here:
$22,138
State:
$18,201
(% of AGI for various income ranges: 7.6% for AGIs below $25k, 31.4% for AGIs $25k-50k, 67.3% for AGIs $50k-75k, 141.1% for AGIs $75k-100k, 417.6% for AGIs $100k-200k, 5723.2% for AGIs over 200k)
Taxes paid: $8,470 (reported on 17.4% of returns)
78006:
$8,470
State:
$7,821
(% of AGI for various income ranges: 18.1% for AGIs below $25k, 40.6% for AGIs $25k-50k, 106.0% for AGIs $50k-75k, 173.4% for AGIs $75k-100k, 378.0% for AGIs $100k-200k, 1679.5% for AGIs over 200k)
Earned income credit: $2,180 (reported on 8.8% of returns)
Here:
$2,180
State:
$2,584
(% of AGI for various income ranges: 68.8% for AGIs below $25k, 60.9% for AGIs $25k-50k, 1.3% for AGIs $50k-75k)
Percentage of individuals using paid preparers for their 2020 taxes: 91.4%
Here:
91%
State:
92%
(% for various income ranges: 89.5% for AGIs below $25k, 92.2% for AGIs $25k-50k, 91.3% for AGIs $50k-75k, 89.7% for AGIs $75k-100k, 92.3% for AGIs $100k-200k, 93.1% for AGIs over 200k)
Averages for the 2012 tax year for zip code 78006, filed in 2013:
Average Adjusted Gross Income (AGI) in 2012: $112,926 (Individual Income Tax Returns)
Here:
$112,926
State:
$65,384
Salary/wage: $79,550 (reported on 77.3% of returns)
Here:
$79,550
State:
$52,524
(% of AGI for various income ranges: 69.8% for AGIs below $25k, 69.3% for AGIs $25k-50k, 63.0% for AGIs $50k-75k, 66.2% for AGIs $75k-100k, 67.0% for AGIs $100k-200k, 44.2% for AGIs over 200k)
Taxable interest for individuals: $3,382 (reported on 44.6% of returns)
This zip code:
$3,382
Texas:
$2,372
(% of AGI for various income ranges: 2.3% for AGIs below $25k, 1.4% for AGIs $25k-50k, 1.3% for AGIs $50k-75k, 1.1% for AGIs $75k-100k, 1.2% for AGIs $100k-200k, 1.4% for AGIs over 200k)
Ordinary dividends: $10,542 (reported on 29.3% of returns)
Here:
$10,542
State:
$9,721
(% of AGI for various income ranges: 3.1% for AGIs below $25k, 2.4% for AGIs $25k-50k, 1.8% for AGIs $50k-75k, 2.0% for AGIs $75k-100k, 2.3% for AGIs $100k-200k, 3.1% for AGIs over 200k)
Net capital gain/loss in AGI: +$45,967 (reported on 26.3% of returns)
Here:
+$45,967
State:
+$35,319
(% of AGI for various income ranges: 0.3% for AGIs below $25k, 0.8% for AGIs $25k-50k, 1.3% for AGIs $50k-75k, 1.2% for AGIs $75k-100k, 2.4% for AGIs $100k-200k, 18.2% for AGIs over 200k)
Profit/loss from business: +$24,136 (reported on 23.7% of returns)
Here:
+$24,136
State:
+$13,732
(% of AGI for various income ranges: 10.4% for AGIs below $25k, 5.5% for AGIs $25k-50k, 5.9% for AGIs $50k-75k, 5.0% for AGIs $75k-100k, 5.1% for AGIs $100k-200k, 4.6% for AGIs over 200k)
Taxable individual retirement arrangement distribution: $27,345 (reported on 13.3% of returns)
78006:
$27,345
Texas:
$19,511
(% of AGI for various income ranges: 2.9% for AGIs below $25k, 3.2% for AGIs $25k-50k, 3.6% for AGIs $50k-75k, 3.9% for AGIs $75k-100k, 4.7% for AGIs $100k-200k, 2.5% for AGIs over 200k)
Self-employment retirement plans: $20,015 (reported on 1.3% of returns)
78006:
$20,015
Texas:
$23,938
(% of AGI for various income ranges: 0.3% for AGIs $50k-75k, 0.3% for AGIs $100k-200k, 0.3% for AGIs over 200k)
Total itemized deductions: $30,793 (14% of AGI, reported on 40.9% of returns)
Here:
$30,793
State:
$24,724
Here:
14.3% of AGI
State:
15.9% of AGI
(% of AGI for various income ranges: 13.6% for AGIs below $25k, 11.6% for AGIs $25k-50k, 13.7% for AGIs $50k-75k, 14.1% for AGIs $75k-100k, 14.9% for AGIs $100k-200k, 8.8% for AGIs over 200k)
Charity contributions: $8,517 (reported on 35.0% of returns)
Here:
$8,517
State:
$6,808
(% of AGI for various income ranges: 1.1% for AGIs below $25k, 1.3% for AGIs $25k-50k, 1.9% for AGIs $50k-75k, 2.2% for AGIs $75k-100k, 2.8% for AGIs $100k-200k, 3.0% for AGIs over 200k)
Taxes paid: $9,145 (reported on 40.3% of returns)
78006:
$9,145
State:
$6,921
(% of AGI for various income ranges: 3.1% for AGIs below $25k, 2.8% for AGIs $25k-50k, 3.7% for AGIs $50k-75k, 4.1% for AGIs $75k-100k, 4.7% for AGIs $100k-200k, 2.6% for AGIs over 200k)
Earned income credit: $2,146 (reported on 10.7% of returns)
Here:
$2,146
State:
$2,570
(% of AGI for various income ranges: 4.6% for AGIs below $25k, 1.0% for AGIs $25k-50k)
Percentage of individuals using paid preparers for their 2012 taxes: 49.3%
Here:
49%
State:
51%
(% for various income ranges: 40.8% for AGIs below $25k, 44.9% for AGIs $25k-50k, 49.7% for AGIs $50k-75k, 49.0% for AGIs $75k-100k, 55.6% for AGIs $100k-200k, 73.2% for AGIs over 200k)
Averages for the 2004 tax year for zip code 78006, filed in 2005:
Average Adjusted Gross Income (AGI) in 2004: $72,768 (Individual Income Tax Returns)
Here:
$72,768
State:
$47,881
Salary/wage: $56,996 (reported on 77.8% of returns)
Here:
$56,996
State:
$41,947
(% of AGI for various income ranges: 1419.8% for AGIs below $10k, 70.4% for AGIs $10k-25k, 69.4% for AGIs $25k-50k, 69.7% for AGIs $50k-75k, 73.6% for AGIs $75k-100k, 53.2% for AGIs over 100k)
Taxable interest for individuals: $2,853 (reported on 52.9% of returns)
This zip code:
$2,853
Texas:
$2,255
(% of AGI for various income ranges: 116.2% for AGIs below $10k, 3.2% for AGIs $10k-25k, 2.4% for AGIs $25k-50k, 1.8% for AGIs $50k-75k, 1.8% for AGIs $75k-100k, 1.9% for AGIs over 100k)
Taxable dividends: $5,568 (reported on 32.4% of returns)
Here:
$5,568
State:
$4,261
(% of AGI for various income ranges: 108.1% for AGIs below $10k, 1.9% for AGIs $10k-25k, 1.8% for AGIs $25k-50k, 1.5% for AGIs $50k-75k, 1.5% for AGIs $75k-100k, 2.9% for AGIs over 100k)
Net capital gain/loss: +$21,292 (reported on 29.7% of returns)
Here:
+$21,292
State:
+$16,110
(% of AGI for various income ranges: 7.2% for AGIs below $10k, 1.0% for AGIs $10k-25k, 1.1% for AGIs $25k-50k, 1.7% for AGIs $50k-75k, 1.7% for AGIs $75k-100k, 13.1% for AGIs over 100k)
Profit/loss from business: +$15,753 (reported on 24.4% of returns)
Here:
+$15,753
State:
+$11,013
(% of AGI for various income ranges: 7.0% for AGIs below $10k, 7.6% for AGIs $10k-25k, 6.3% for AGIs $25k-50k, 5.8% for AGIs $50k-75k, 4.6% for AGIs $75k-100k, 5.0% for AGIs over 100k)
IRA payment deduction: $3,439 (reported on 3.4% of returns)
78006:
$3,439
Texas:
$3,120
(% of AGI for various income ranges: 0.2% for AGIs $10k-25k, 0.3% for AGIs $25k-50k, 0.2% for AGIs $50k-75k, 0.2% for AGIs $75k-100k, 0.1% for AGIs over 100k)
Self-employed pension: $15,176 (reported on 1.5% of returns)
Here:
$15,176
Texas:
$16,401
(% of AGI for various income ranges: 0.1% for AGIs $25k-50k, 0.2% for AGIs $50k-75k, 0.3% for AGIs $75k-100k, 0.4% for AGIs over 100k)
Total itemized deductions: $22,642 (19% of AGI, reported on 39.7% of returns)
Here:
$22,642
State:
$19,631
Here:
18.5% of AGI
State:
18.9% of AGI
(% of AGI for various income ranges: 209.1% for AGIs below $10k, 13.3% for AGIs $10k-25k, 13.7% for AGIs $25k-50k, 14.8% for AGIs $50k-75k, 15.5% for AGIs $75k-100k, 10.8% for AGIs over 100k)
Charity contributions deductions: $5,723 (4% of AGI, reported on 34.5% of returns)
Here:
$5,723
State:
$4,753
Here:
4.4% of AGI
State:
4.2% of AGI
(% of AGI for various income ranges: 11.3% for AGIs below $10k, 1.4% for AGIs $10k-25k, 1.8% for AGIs $25k-50k, 2.1% for AGIs $50k-75k, 2.4% for AGIs $75k-100k, 3.1% for AGIs over 100k)
Total tax: $14,856 (reported on 79.4% of returns)
78006:
$14,856
State:
$9,058
(% of AGI for various income ranges: 58.2% for AGIs below $10k, 4.7% for AGIs $10k-25k, 7.2% for AGIs $25k-50k, 9.3% for AGIs $50k-75k, 10.8% for AGIs $75k-100k, 20.8% for AGIs over 100k)
Earned income credit: $1,701 (reported on 10.0% of returns)
Here:
$1,701
State:
$2,024
Percentage of individuals using paid preparers for their 2004 taxes: 56.0%
Here:
56%
State:
57%
(% for various income ranges: 49.4% for AGIs below $10k, 56.8% for AGIs $10k-25k, 56.0% for AGIs $25k-50k, 54.0% for AGIs $50k-75k, 53.8% for AGIs $75k-100k, 64.8% for AGIs over 100k)
Household received Food Stamps/SNAP in the past 12 months: 512 Household did not receive Food Stamps/SNAP in the past 12 months: 15,606
Women who had a birth in the past 12 months: 527 (288 now married, 234 unmarried) Women who did not have a birth in the past 12 months: 8,684 (4,423 now married, 4,242 unmarried)
Housing units in zip code 78006 with a mortgage: 6,794 (430 second mortgage, 312 both second mortgage and home equity loan) Houses without a mortgage: 101
Median monthly owner costs for units with a mortgage: $2,564 Median monthly owner costs for units without a mortgage: $870
Residents with income below the poverty level in 2022:
This zip code:
5.8%
Whole state:
14.0%
Residents with income below 50% of the poverty level in 2022:
This zip code:
1.7%
Whole state:
7.4%
Median number of rooms in houses and condos:
Here:
7.1
State:
6.3
Median number of rooms in apartments:
Here:
4.5
State:
4.0
Notable locations in this zip code not listed on our city pages
Notable locations in zip code 78006: Herff Park Fairground (A), Sycamore Ridge Camp (B), Camp Alzafar (C), Cothrum Ranch (D), Guadalupe River Ranch (E), Haag Ranch (F), Offer Ranch (G), Welfare (H), Whitworth Ranch (I), Balcones Community Center (J), Joseph Dienger Building (K), Kendall Inn (L), Kendall County Courthouse (M), Kulmann-King House (N), Comfort Historical Society (O), Cibolo Nature Center (P), Agricultural Heritage Museum (Q), Bulverde Fire Department Station 3 (R), Kendall County Emergency Medical Service (S), Pleasant Valley Community Center (T). Display/hide their locations on the map
Churches in zip code 78006 include: Baptist Church (A), Assembly of God Church (B), Jesus Name Full Gospel Church (C), First United Methodist Church (D), Saint Peter the Apostle Catholic Church (E), Jehovahs Witnesses of Boerne (F), First Baptist Church (G), Benedictine Convent (H), Church of Christ (I). Display/hide their locations on the map
Cemeteries: Wren Cemetery (1), Ammann Cemetery (2), Howard Cemetery (3), Dantziger Monument (4), Lenz Cemetery (5), Beseler Cemetery (6), Cole And Hugman Cemetery (7). Display/hide their locations on the map
Reservoirs: White Ranch Lake (A), Smith Investment Company Lake Number 1 (B), Smith Investment Company Lake Number 3 (C), Masters Lake (D), Lake Oz (E), 711 Ranch Lake (F), Boerne Park Lake (G), Soil Conservation Service Site 1 Reservoir (H). Display/hide their locations on the map
Creeks: Browns Creek (A), Black Creek (B), Willie Creek (C), Violet Creek (D), Soell Creek (E), Sister Creek (F), Rundale Creek (G), Reeh Creek (H), Platte Creek (I). Display/hide their locations on the map
In group quarters: 510 (-1 institutionalized population)
Size of family households: 5,721 2-persons, 2,423 3-persons, 2,127 4-persons, 1,265 5-persons, 367 6-persons, 299 7-or-more-persons
Size of nonfamily households: 3,576 1-person, 347 2-persons, 28 3-persons
6,880 married couples with children.
1,718 single-parent households (780 men, 938 women).
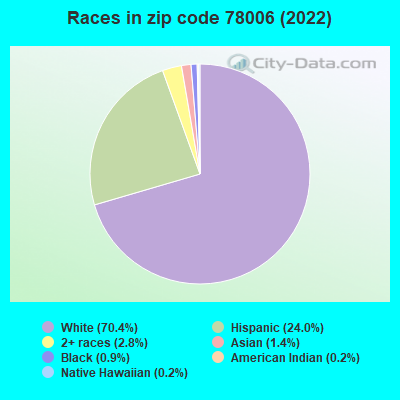
85.7% of residents of 78006 zip code speak English at home.
12.5% of residents speak Spanish at home (68% very well, 14% well, 15% not well, 4% not at all).
1.0% of residents speak other Indo-European language at home (59% very well, 17% well, 24% not well).
0.8% of residents speak Asian or Pacific Island language at home (71% very well, 29% well).
0.2% of residents speak other language at home (100% very well).
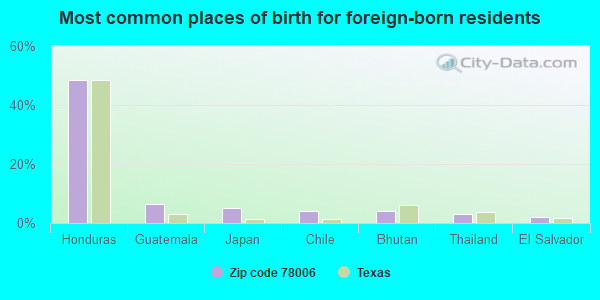
Foreign born population: 2,925 (6.9%) (51.9% of them are naturalized citizens)
This zip code:
6.9%
Whole state:
17.2%
48%Honduras
6%Guatemala
5%Japan
4%Chile
4%Bhutan
3%Thailand
2%El Salvador
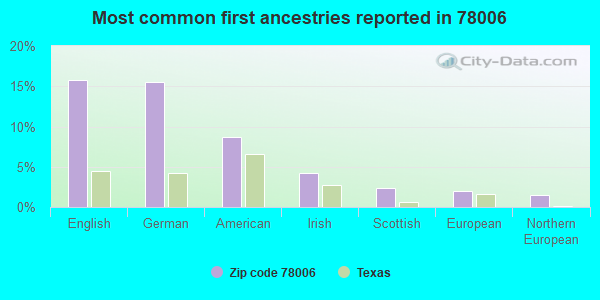
16%English
16%German
9%American
4%Irish
2%Scottish
2%European
2%Northern European
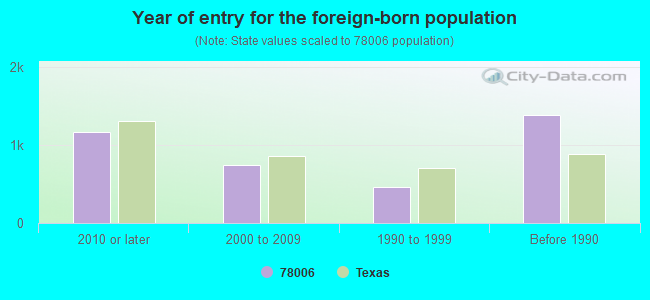
Year of entry for the foreign-born population
1,1642010 or later
7452000 to 2009
4651990 to 1999
1,387Before 1990
Facilities with environmental interests located in this zip code:
ANCIRA GMC TRUCKS & MOTOR (IH-10 & CASCADE in BOERNE, TX)
(Resource Conservation and Recovery Act (tracking hazardous waste)) Alternative names: ANCIRA GMC TRUCKS & MOTOR HOMES
Housing units lacking complete kitchen facilities: 1.6%
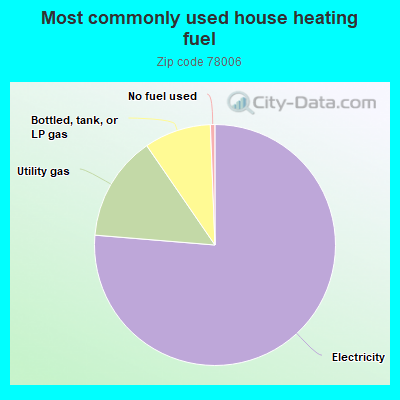
75.7%Electricity
14.0%Utility gas
8.9%Bottled, tank, or LP gas
0.6%No fuel used
Population in 1990: 14,427. Population change in the 1990s: +4,820 (+33.4%).
Place of birth for U.S.-born residents:
This state: 23,994
Northeast: 1,814
Midwest: 3,814
South: 4,191
West: 4,853
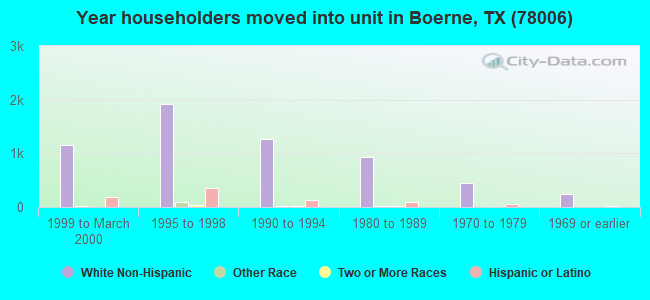
52% of the 78006 zip code residents lived in the same house 5 years ago. Out of people who lived in different houses, 30% lived in this county. Out of people who lived in different counties, 50% lived in Texas.
88% of the 78006 zip code residents lived in the same house 1 year ago. Out of people who lived in different houses, 42% moved from this county. Out of people who lived in different houses, 39% moved from different county within same state. Out of people who lived in different houses, 17% moved from different state. Out of people who lived in different houses, 4% moved from abroad.
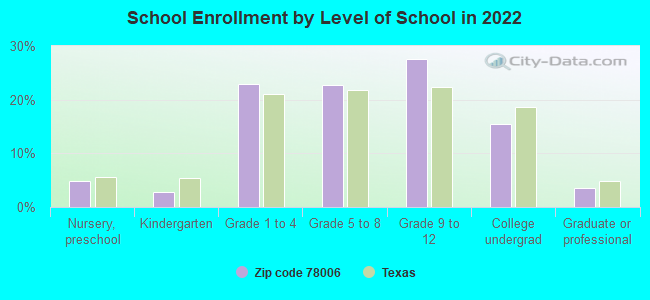
Private vs. public school enrollment:
Students in private schools in grades 1 to 8 (elementary and middle school): 715
Here:
15.4%
Texas:
8.8%
Students in private schools in grades 9 to 12 (high school): 383
Here:
13.7%
Texas:
8.0%
Students in private undergraduate colleges: 305
Here:
19.6%
Texas:
16.2%
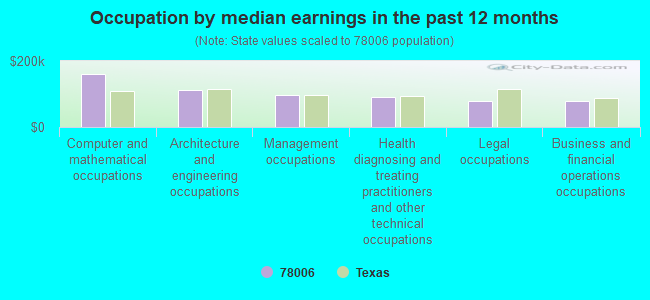
Occupation by median earnings in the past 12 months ($)
161,671Computer and mathematical occupations
111,711Architecture and engineering occupations
97,852Management occupations
89,856Health diagnosing and treating practitioners and other technical occupations
79,509Legal occupations
79,266Business and financial operations occupations
Companies with biggest federal contracts located in this zip code (BOERNE, TX):
BUIE FOREST PRODUCTS (30875 IH 10 W; small business) : $66,437,891 in 1899 contractsfrom 1999 to 2006
Contracts for Lumber and Related Basic Wood Materials, Plywood and Veneer, Miscellaneous Prefabricated Structures, Millwork, and moreby Defense Logistics Agency, Navy, Army Signed by year:2000: $2,104,899; 2001: $6,546,637; 2002: $7,597,764; 2003: $4,872,300; 2004: $21,737,033; 2005: $18,197,213; 2006: $3,733,124.
Biggest contracts:
$3,178,982 with Defense Logistics Agency for Lumber and Related Basic Wood Materials. Signed on 2004-01-21. Completion date: 2004-03-22.
$2,283,494, same as above.Signed on 2004-04-21. Completion date: 2004-05-01.
$1,592,640, same as above.Signed on 2002-09-27. Completion date: 2002-10-13.
$1,573,715, same as above.Signed on 2003-11-28. Completion date: 2004-01-26.
CONSTRUCTION OUTFITTERS INTERN (37450 IH 10 W # 101; small business) : $8,355,963 in 12 contractsfrom 2003 to 2006
Contracts for Other Management Support Services, Radio and Television Communication Equipment, Except Airborne, Other Buildings, Maintenance, Repair or Alteration of Real Property -- Office Buildings by Department of State, Army, Air Force Signed by year:2000: $0; 2001: $0; 2002: $0; 2003: $3,638,128; 2004: $164,526; 2005: $4,532,685; 2006: $20,624.
Biggest contracts:
$4,335,623 with Department of State for Other Management Support Services. Signed on 2005-01-17. Completion date: 2006-02-28.
$3,479,128, same as above.Signed on 2003-09-15. Completion date: 2005-02-15.
$164,526 with Army for Radio and Television Communication Equipment, Except Airborne. Taking place in VA. Signed on 2004-05-28. Completion date: 2004-06-23.
$159,000 with Department of State for Other Buildings. Signed on 2003-02-15. Completion date: 2003-02-15.
BUIE WHOLESALE SUPPLY, LTD (30875 IH 10 WEST; small business) : $1,409,532 in 155 contractsfrom 2004 to 2006
Contracts for Miscellaneous Prefabricated Structures, Lumber and Related Basic Wood Materials, Miscellaneous Ship and Marine Equipment, Cranes and Crane-Shovels, and moreby Defense Logistics Agency, Navy Signed by year:2000: $0; 2001: $0; 2002: $0; 2003: $0; 2004: $12,638; 2005: $593,497; 2006: $803,397.
Biggest contracts:
$44,133 with Defense Logistics Agency for Miscellaneous Prefabricated Structures. Signed on 2006-05-23. Completion date: 2006-05-26.
$40,494 with Defense Logistics Agency for Lumber and Related Basic Wood Materials. Signed on 2005-09-25. Completion date: 2005-11-25.
$33,943 with Navy for Miscellaneous Ship and Marine Equipment. Signed on 2006-02-28. Completion date: 2006-04-24.
$32,889 with Defense Logistics Agency for Miscellaneous Prefabricated Structures. Signed on 2006-05-10. Completion date: 2006-05-12.
R D BUIE ENTERPRISES INC (30875 IH 10 W; small business) : $1,159,525 in 23 contractsfrom 2004 to 2006
Contracts for Plywood and Veneer, Lumber and Related Basic Wood Materials by Defense Logistics Agency, Army, Navy, Air Force, and others Signed by year:2000: $0; 2001: $0; 2002: $0; 2003: $0; 2004: $218,572; 2005: $44,310; 2006: $896,643.
Biggest contracts:
$227,232 with Defense Logistics Agency for Plywood and Veneer. Signed on 2006-06-14. Completion date: 2006-06-20.
$175,392, same as above.Signed on 2006-06-10. Completion date: 2006-06-14.
$168,960, same as above.Signed on 2006-06-10. Completion date: 2006-06-14.
$139,200, same as above.Signed on 2006-06-18. Completion date: 2006-06-22.
LINFOOT, JOHN A, JR (1517 CORDILLERA TRACE; small business) : $338,583 in 2 contractsin 2005
$290,000 with Army for Internal Medicine Services. Signed on 2005-10-11. Completion date: 2005-09-30.
$48,583, same as above.Signed on 2005-08-02. Completion date: 2005-09-30.
HSC ELECTRIC COMPANY, INC (226 BENTWOOD DRIVE; small business) : $328,690 in 7 contractsfrom 2002 to 2005
Contracts for Inspection Services (including commercial testing and lab services, except medical/dental) -- Electrical and Electronic Equipment Components, Maintenance, Repair and Rebuilding of Equipment -- Electrical and Electronic Equipment Components, Maintenance, Repair or Alteration of Real Property -- Office Buildings by Department of Veterans Affairs, Air Force Signed by year:2000: $0; 2001: $0; 2002: $320,000; 2003: $2,450; 2004: $3,950; 2005: $2,290; 2006: $0.
Biggest contracts:
$136,000 with Department of Veterans Affairs for Inspection Services (including commercial testing and lab services, except medical/dental) -- Electrical and Electronic Equipment Components. Signed on 2002-05-15. Completion date: 2002-09-15.
$122,000, same as above.Signed on 2002-08-15. Completion date: 2002-12-15.
$54,000, same as above.Signed on 2002-08-15. Completion date: 2002-09-15.
$8,000, same as above.Signed on 2002-08-15. Completion date: 2002-09-15.
KL TECHNOLOGIES, INC (32880 IH 10 W STE 104; small business) 50 employees, $0 revenue. Woman Owned Business: $276,989 in 4 contractsfrom 2003 to 2006
$149,169 with Defense Threat Reduction Agency for ADP Support Equipment. Signed on 2005-10-04. Completion date: 2005-12-09.
$58,250 with Defense Threat Reduction Agency for Telecommunications Network Management Services. Signed on 2006-06-22. Completion date: 2006-09-18.
$57,584 with Air Force for ADP Supplies. Taking place in NE. Signed on 2003-09-30. Completion date: 2003-12-31.
$11,986 with Defense Threat Reduction Agency for ADP Support Equipment. Signed on 2004-08-05. Completion date: 2004-09-04.
BIG JIM HALTER COMPANY INC. (10045 JOHNS ROAD; small business) : $75,035 in 4 contractsfrom 2003 to 2005
$69,500 with Air Force for Individual Equipment. Signed on 2003-08-04. Completion date: 2003-09-04.
$5,535 with Army for Textile Fabrics. Signed on 2005-07-16. Completion date: 2005-06-24.
$4,313 with Federal Supply Service for Individual Equipment. Signed on 2005-11-16. Completion date: 2005-12-19.
-$4,313, same as above.Signed on 2005-11-16. Completion date: 2005-12-19.
GALE AND PANSY WHITE (215 W BANDERA RD SUITE 114; small business) : $59,223 in 11 contractsfrom 2002 to 2006
Contracts for Operation of Government-Owned Facilities -- Recreation Facilities (Non-Building) by Army, U.S. Army Corps of Engineers - civil program financing only Signed by year:2000: $0; 2001: $0; 2002: -$741; 2003: $7,134; 2004: $25,330; 2005: $18,972; 2006: $8,528.
Biggest contracts:
$12,665 with Army for Operation of Government-Owned Facilities -- Recreation Facilities (Non-Building). Signed on 2004-03-10. Completion date: 2004-12-31.
$12,665 with U.S. Army Corps of Engineers - civil program financing only for Operation of Government-Owned Facilities -- Recreation Facilities (Non-Building). Signed on 2004-03-10. Completion date: 2004-12-31.
$9,486 with U.S. Army Corps of Engineers - civil program financing only for Operation of Government-Owned Facilities -- Recreation Facilities (Non-Building). Taking place in AR. Signed on 2005-02-24. Completion date: 2005-10-31.
$9,486 with Army for Operation of Government-Owned Facilities -- Recreation Facilities (Non-Building). Taking place in AR. Signed on 2005-02-24. Completion date: 2005-10-31.
OIL FILTRATION SYSTEMS, INC (111 PARKWAY DRIVE; small business) : $52,480 in 2 contractsin 2005
$27,500 with Bureau of Reclamation for Centrifugals, Separators, and Pressure and Vacuum Filters. Taking place in CA. Signed on 2005-07-25. Completion date: 2005-09-19.
$24,980 with Navy for Other Defense -- Applied Research and Exploratory Development (R&D). Signed on 2005-09-30. Completion date: 2005-11-30.
Top industries in this zip code by the number of employees in 2005:
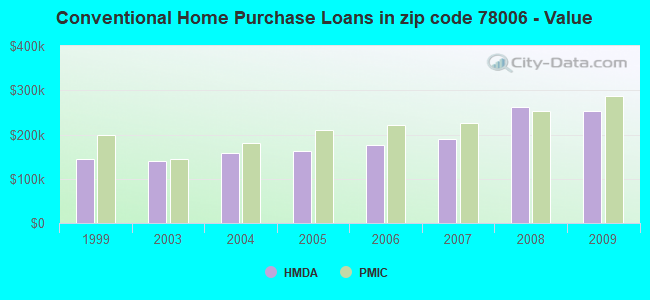
Detailed PMIC statistics for the following Tracts:1821.02
, 1821.03
2002 - 2018 National Fire Incident Reporting System (NFIRS) incidents
Based on the data from the years 2002 - 2018 the average number of fire incidents per year is 141. The highest number of fire incidents - 204 took place in 2011, and the least - 80 in 2002. The data has a rising trend.
When looking into fire subcategories, the most reports belonged to: Outside Fires (63.2%), and Structure Fires (21.2%).
Fire incident types reported to NFIRS in Zip Code 78006


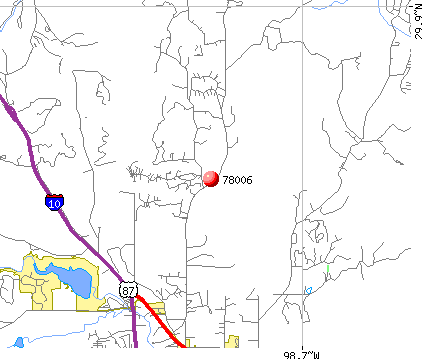 Nearest zip codes: 78015, 78004, 78027, 78255, 78013, 78257.
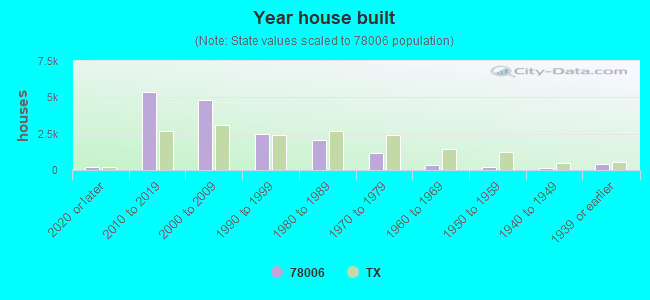


 Based on the data from the years 2002 - 2018 the average number of fire incidents per year is 141. The highest number of fire incidents - 204 took place in 2011, and the least - 80 in 2002. The data has a rising trend.
 When looking into fire subcategories, the most reports belonged to: Outside Fires (63.2%), and Structure Fires (21.2%).