Estimated zip code population in 2022: 11,184 Zip code population in 2010: 11,031 Zip code population in 2000: 9,795
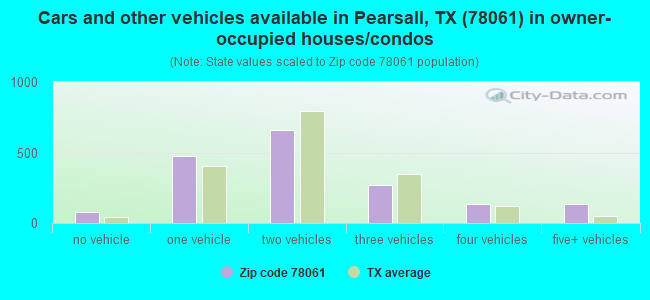
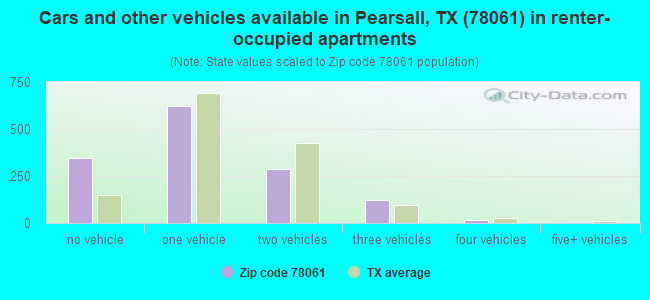
Houses and condos: 3,900 Renter-occupied apartments: 1,390
% of renters here:
44%
State:
38%
March 2022 cost of living index in zip code 78061: 76.9 (low, U.S. average is 100)
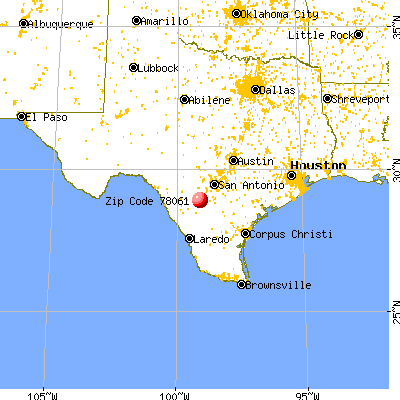
Land area: 553.2 sq. mi. Water area: 0.5 sq. mi.
Population density: 20 people per square mile
(very low).
OSM Map
General Map
Google Map
MSN Map
OSM Map
General Map
Google Map
MSN Map
OSM Map
General Map
Google Map
MSN Map
OSM Map
General Map
Google Map
MSN Map
Please wait while loading the map...
Real estate property taxes paid for housing units in 2022:
This zip code:
1.7% ($1,872)
Texas:
1.5% ($4,050)
Median real estate property taxes paid for housing units with mortgages in 2022: $2,131 (1.6%) Median real estate property taxes paid for housing units with no mortgage in 2022: $1,798 (1.8%)
Business Search- 14 Million verified businesses
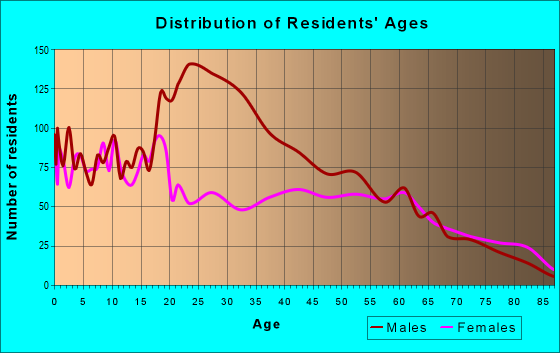
Males: 6,457
(57.7%)
Females: 4,727
(42.3%)
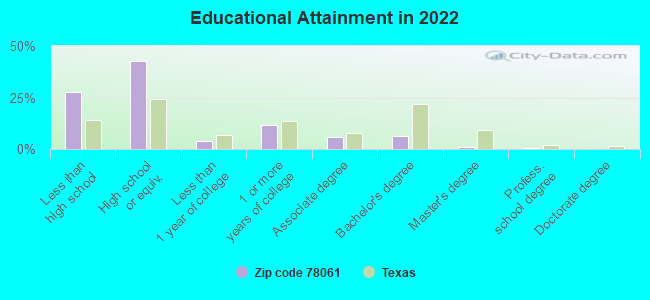
For population 25 years and over in 78061:
High school or higher: 70.3%
Bachelor's degree or higher: 7.7%
Graduate or professional degree: 1.6%
Unemployed: 2.8%
Mean travel time to work (commute): 19.6 minutes
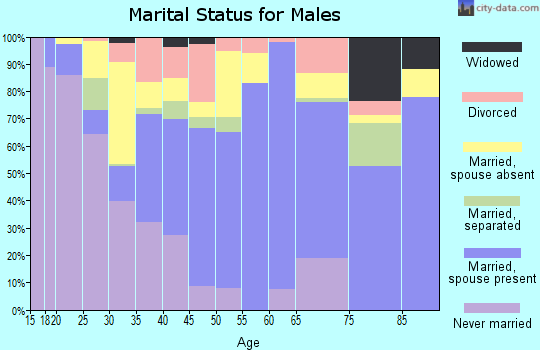
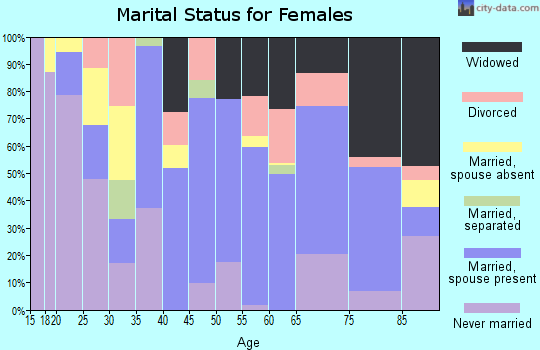
For population 15 years and over in 78061:
Never married: 47.0%
Now married: 35.4%
Separated: 2.5%
Widowed: 5.0%
Divorced: 10.2%
Zip code 78061 compared to state average:
Median household income below state average.
Median house value significantly below state average.
Black race population percentage significantly below state average.
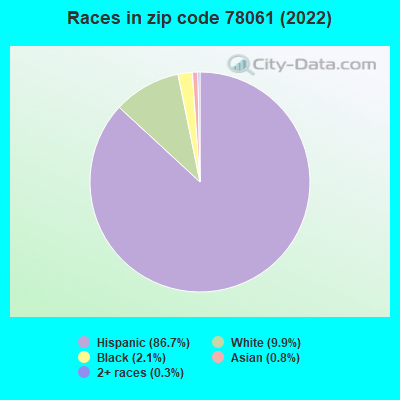
Hispanic race population percentage above state average.
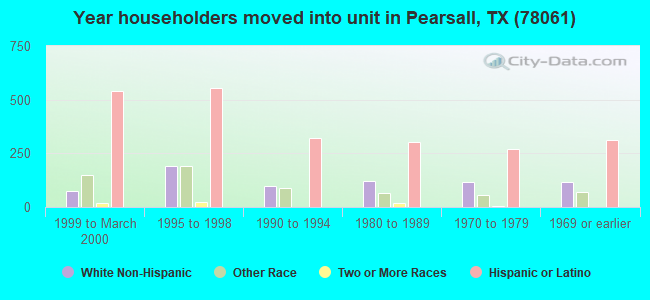
Length of stay since moving in significantly above state average.
Percentage of population with a bachelor's degree or higher significantly below state average.
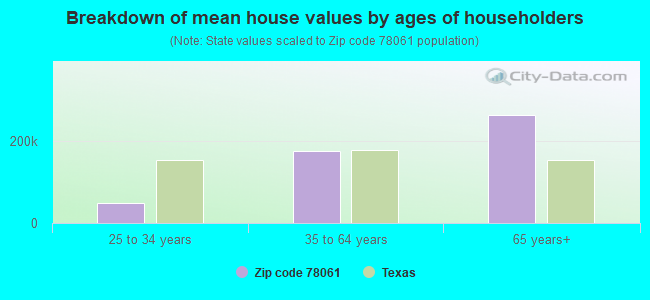
Estimated median house/condo value in 2022: $108,771
78061:
$108,771
Texas:
$275,400
According to our research of Texas and other state lists, there were 32 registered sex offenders living in 78061 zip code as of April 27, 2024. The ratio of all residents to sex offenders in zip code 78061 is 396 to 1. The ratio of registered sex offenders to all residents in this zip code is near the state average.
Median resident age:
This zip code:
33.0 years
Texas median age:
35.6 years
Average household size:
This zip code:
3.1 people
Texas:
2.6 people
Averages for the 2020 tax year for zip code 78061, filed in 2021:
Average Adjusted Gross Income (AGI) in 2020: $43,713 (Individual Income Tax Returns)
Here:
$43,713
State:
$77,054
Salary/wage: $37,904 (reported on 88.1% of returns)
Here:
$37,904
State:
$62,766
(% of AGI for various income ranges: 1504.0% for AGIs below $25k, 3749.7% for AGIs $25k-50k, 6793.5% for AGIs $50k-75k, 9491.8% for AGIs $75k-100k, 15722.7% for AGIs $100k-200k)
Taxable interest for individuals: $2,054 (reported on 12.9% of returns)
This zip code:
$2,054
Texas:
$2,665
(% of AGI for various income ranges: 3.8% for AGIs below $25k, 3.4% for AGIs $25k-50k, 19.5% for AGIs $50k-75k, 85.3% for AGIs $75k-100k, 255.3% for AGIs $100k-200k)
Ordinary dividends: $8,135 (reported on 5.0% of returns)
Here:
$8,135
State:
$10,044
(% of AGI for various income ranges: 2.1% for AGIs below $25k, 1.7% for AGIs $25k-50k, 32.0% for AGIs $50k-75k, 83.5% for AGIs $75k-100k, 239.3% for AGIs $100k-200k)
Net capital gain/loss in AGI: +$19,900 (reported on 4.0% of returns)
Here:
+$19,900
State:
+$39,590
(% of AGI for various income ranges: 2.8% for AGIs $25k-50k, 51.5% for AGIs $50k-75k, 49.4% for AGIs $75k-100k, 302.0% for AGIs $100k-200k)
Profit/loss from business: +$3,045 (reported on 18.6% of returns)
Here:
+$3,045
State:
+$10,888
(% of AGI for various income ranges: 96.5% for AGIs $75k-100k, 874.0% for AGIs $100k-200k)
Taxable individual retirement arrangement distribution: $12,700 (reported on 2.7% of returns)
78061:
$12,700
Texas:
$24,740
(% of AGI for various income ranges: 37.0% for AGIs $25k-50k, 164.8% for AGIs $50k-75k, 220.7% for AGIs $100k-200k)
Total itemized deductions: $42,489 (reported on 6.7% of returns)
Here:
$42,489
State:
$40,428
(% of AGI for various income ranges: 330.0% for AGIs $25k-50k, 505.8% for AGIs $50k-75k, 1062.4% for AGIs $75k-100k, 2675.3% for AGIs $100k-200k)
Charity contributions: $9,406 (reported on 4.2% of returns)
Here:
$9,406
State:
$18,201
(% of AGI for various income ranges: 25.4% for AGIs $25k-50k, 64.2% for AGIs $50k-75k, 114.1% for AGIs $75k-100k, 579.3% for AGIs $100k-200k)
Taxes paid: $5,096 (reported on 6.7% of returns)
78061:
$5,096
State:
$7,821
(% of AGI for various income ranges: 47.3% for AGIs $25k-50k, 68.0% for AGIs $50k-75k, 121.2% for AGIs $75k-100k, 252.0% for AGIs $100k-200k)
Earned income credit: $2,718 (reported on 32.9% of returns)
Here:
$2,718
State:
$2,584
(% of AGI for various income ranges: 182.7% for AGIs below $25k, 104.5% for AGIs $25k-50k)
Percentage of individuals using paid preparers for their 2020 taxes: 84.9%
Here:
85%
State:
92%
(% for various income ranges: 82.7% for AGIs below $25k, 87.4% for AGIs $25k-50k, 84.6% for AGIs $50k-75k, 87.0% for AGIs $75k-100k, 83.3% for AGIs $100k-200k, 100.0% for AGIs over 200k)
Averages for the 2012 tax year for zip code 78061, filed in 2013:
Average Adjusted Gross Income (AGI) in 2012: $43,535 (Individual Income Tax Returns)
Here:
$43,535
State:
$65,384
Salary/wage: $32,791 (reported on 90.7% of returns)
Here:
$32,791
State:
$52,524
(% of AGI for various income ranges: 87.7% for AGIs below $25k, 90.0% for AGIs $25k-50k, 84.3% for AGIs $50k-75k, 85.0% for AGIs $75k-100k, 69.8% for AGIs $100k-200k, 20.4% for AGIs over 200k)
Taxable interest for individuals: $1,658 (reported on 14.8% of returns)
This zip code:
$1,658
Texas:
$2,372
(% of AGI for various income ranges: 0.1% for AGIs below $25k, 0.2% for AGIs $25k-50k, 0.3% for AGIs $50k-75k, 0.4% for AGIs $75k-100k, 0.5% for AGIs $100k-200k, 1.4% for AGIs over 200k)
Ordinary dividends: $5,830 (reported on 5.8% of returns)
Here:
$5,830
State:
$9,721
(% of AGI for various income ranges: 0.3% for AGIs below $25k, 0.4% for AGIs $50k-75k, 0.6% for AGIs $75k-100k, 1.3% for AGIs $100k-200k, 1.7% for AGIs over 200k)
Net capital gain/loss in AGI: +$24,671 (reported on 4.3% of returns)
Here:
+$24,671
State:
+$35,319
(% of AGI for various income ranges: 0.4% for AGIs $50k-75k, 1.4% for AGIs $100k-200k, 8.7% for AGIs over 200k)
Profit/loss from business: +$13,884 (reported on 16.1% of returns)
Here:
+$13,884
State:
+$13,732
(% of AGI for various income ranges: 7.4% for AGIs below $25k, 3.2% for AGIs $25k-50k, 3.4% for AGIs $50k-75k, 3.6% for AGIs $75k-100k, 9.6% for AGIs $100k-200k, 4.9% for AGIs over 200k)
Taxable individual retirement arrangement distribution: $11,421 (reported on 3.5% of returns)
78061:
$11,421
Texas:
$19,511
(% of AGI for various income ranges: 0.5% for AGIs below $25k, 0.5% for AGIs $25k-50k, 1.6% for AGIs $50k-75k, 4.0% for AGIs $100k-200k)
Total itemized deductions: $21,555 (21% of AGI, reported on 12.3% of returns)
Here:
$21,555
State:
$24,724
Here:
20.6% of AGI
State:
15.9% of AGI
(% of AGI for various income ranges: 4.2% for AGIs below $25k, 7.6% for AGIs $25k-50k, 8.9% for AGIs $50k-75k, 6.8% for AGIs $75k-100k, 7.2% for AGIs $100k-200k, 3.4% for AGIs over 200k)
Charity contributions: $5,173 (reported on 9.3% of returns)
Here:
$5,173
State:
$6,808
(% of AGI for various income ranges: 0.3% for AGIs below $25k, 0.6% for AGIs $25k-50k, 1.0% for AGIs $50k-75k, 0.9% for AGIs $75k-100k, 1.5% for AGIs $100k-200k, 1.9% for AGIs over 200k)
Taxes paid: $3,350 (reported on 11.1% of returns)
78061:
$3,350
State:
$6,921
(% of AGI for various income ranges: 0.5% for AGIs below $25k, 0.8% for AGIs $25k-50k, 1.0% for AGIs $50k-75k, 1.0% for AGIs $75k-100k, 1.4% for AGIs $100k-200k, 0.7% for AGIs over 200k)
Earned income credit: $2,672 (reported on 38.2% of returns)
Here:
$2,672
State:
$2,570
(% of AGI for various income ranges: 12.2% for AGIs below $25k, 2.2% for AGIs $25k-50k)
Percentage of individuals using paid preparers for their 2012 taxes: 49.5%
Here:
49%
State:
51%
(% for various income ranges: 46.3% for AGIs below $25k, 46.2% for AGIs $25k-50k, 55.8% for AGIs $50k-75k, 57.1% for AGIs $75k-100k, 58.8% for AGIs $100k-200k, 100.0% for AGIs over 200k)
Averages for the 2004 tax year for zip code 78061, filed in 2005:
Average Adjusted Gross Income (AGI) in 2004: $26,617 (Individual Income Tax Returns)
Here:
$26,617
State:
$47,881
Salary/wage: $23,109 (reported on 89.1% of returns)
Here:
$23,109
State:
$41,947
(% of AGI for various income ranges: 95.6% for AGIs below $10k, 89.1% for AGIs $10k-25k, 88.9% for AGIs $25k-50k, 76.7% for AGIs $50k-75k, 77.0% for AGIs $75k-100k, 37.8% for AGIs over 100k)
Taxable interest for individuals: $1,812 (reported on 19.2% of returns)
This zip code:
$1,812
Texas:
$2,255
(% of AGI for various income ranges: 1.7% for AGIs below $10k, 0.7% for AGIs $10k-25k, 0.7% for AGIs $25k-50k, 0.9% for AGIs $50k-75k, 1.1% for AGIs $75k-100k, 3.5% for AGIs over 100k)
Taxable dividends: $4,724 (reported on 7.1% of returns)
Here:
$4,724
State:
$4,261
(% of AGI for various income ranges: 1.1% for AGIs below $10k, 0.3% for AGIs $10k-25k, 0.5% for AGIs $25k-50k, 0.9% for AGIs $50k-75k, 0.7% for AGIs $75k-100k, 4.5% for AGIs over 100k)
Net capital gain/loss: +$6,830 (reported on 5.6% of returns)
Here:
+$6,830
State:
+$16,110
(% of AGI for various income ranges: -0.7% for AGIs below $10k, 0.2% for AGIs $10k-25k, 0.2% for AGIs $25k-50k, 1.7% for AGIs $50k-75k, -0.0% for AGIs $75k-100k, 6.1% for AGIs over 100k)
Profit/loss from business: +$10,357 (reported on 15.6% of returns)
Here:
+$10,357
State:
+$11,013
(% of AGI for various income ranges: 13.4% for AGIs below $10k, 5.3% for AGIs $10k-25k, 2.7% for AGIs $25k-50k, 5.4% for AGIs $50k-75k, 0.3% for AGIs $75k-100k, 14.3% for AGIs over 100k)
IRA payment deduction: $3,037 (reported on 1.6% of returns)
78061:
$3,037
Texas:
$3,120
Self-employed pension: $13,308 (reported on 0.4% of returns)
Here:
$13,308
Texas:
$16,401
Total itemized deductions: $17,305 (26% of AGI, reported on 8.7% of returns)
Here:
$17,305
State:
$19,631
Here:
25.5% of AGI
State:
18.9% of AGI
(% of AGI for various income ranges: 2.8% for AGIs $10k-25k, 6.9% for AGIs $25k-50k, 6.8% for AGIs $50k-75k, 6.9% for AGIs $75k-100k, 7.4% for AGIs over 100k)
Charity contributions deductions: $4,402 (6% of AGI, reported on 7.2% of returns)
Here:
$4,402
State:
$4,753
Here:
6.1% of AGI
State:
4.2% of AGI
(% of AGI for various income ranges: 0.2% for AGIs $10k-25k, 0.8% for AGIs $25k-50k, 0.8% for AGIs $50k-75k, 1.0% for AGIs $75k-100k, 4.0% for AGIs over 100k)
Total tax: $3,910 (reported on 55.3% of returns)
78061:
$3,910
State:
$9,058
(% of AGI for various income ranges: 3.1% for AGIs below $10k, 2.7% for AGIs $10k-25k, 5.4% for AGIs $25k-50k, 9.0% for AGIs $50k-75k, 11.7% for AGIs $75k-100k, 19.3% for AGIs over 100k)
Earned income credit: $2,161 (reported on 45.2% of returns)
Here:
$2,161
State:
$2,024
Percentage of individuals using paid preparers for their 2004 taxes: 64.0%
Here:
64%
State:
57%
(% for various income ranges: 56.3% for AGIs below $10k, 67.8% for AGIs $10k-25k, 64.1% for AGIs $25k-50k, 67.2% for AGIs $50k-75k, 63.1% for AGIs $75k-100k, 83.5% for AGIs over 100k)
Household received Food Stamps/SNAP in the past 12 months: 929 Household did not receive Food Stamps/SNAP in the past 12 months: 2,237
Women who had a birth in the past 12 months: 93 (0 now married, 89 unmarried) Women who did not have a birth in the past 12 months: 1,991 (519 now married, 1,483 unmarried)
Housing units in zip code 78061 with a mortgage: 563 (14 second mortgage, 15 both second mortgage and home equity loan) Median monthly owner costs for units with a mortgage: $1,453 Median monthly owner costs for units without a mortgage: $475
Residents with income below the poverty level in 2022:
This zip code:
24.5%
Whole state:
14.0%
Residents with income below 50% of the poverty level in 2022:
This zip code:
19.8%
Whole state:
7.4%
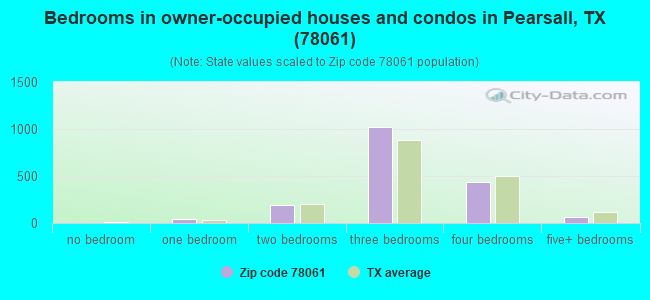
Median number of rooms in houses and condos:
Here:
5.9
State:
6.3
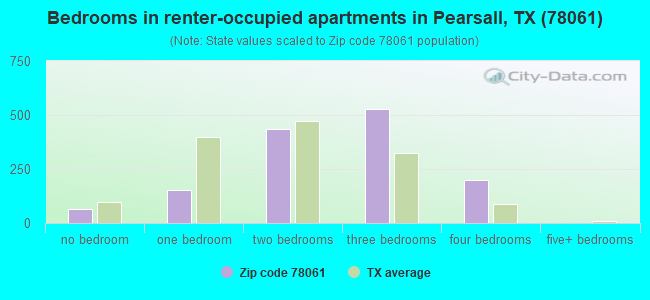
Median number of rooms in apartments:
Here:
4.5
State:
4.0
Notable locations in this zip code not listed on our city pages
Notable locations in zip code 78061: Cattail Windmill (A), Chain Windmill (B), Chivo Windmill (C), Cocklebur Windmill (D), Cow Pasture Windmill (E), Crawford Windmill (F), Creek Windmill (G), Cude Windmill (H), El Rancho Quien Sabe (I), Forest Windmill (J), Frio Windmill (K), Gillman Windmill (L), H and B Ranch (M), Halff Ranch (N), Headquarters Windmill (O), Herbert Windmill (P), Hill Windmill (Q), Honeymoon Windmill (R), Hunters Camp Windmill (S), Javalin Windmill (T). Display/hide their locations on the map
Churches in zip code 78061 include: Presbyterian Church (A), Pearsall Presbyterian Church (B), Saint Peter Lutheran Church (C), Catholic Church (D), Baptist Church First Baptist Church (E). Display/hide their locations on the map
Lakes and reservoirs: Buzzard Roost Lake (A), Howard Lake (B), Jewel Lake (C), Morrow Lake Number 2 (D), Morrow Lake Number 1 (E), Triple S Lake Number 1 (F), Triple S Lake Number 2 (G), Salt Hollow Tank (H). Display/hide their locations on the map
Creeks: Berry Creek (A), Squirrel Creek (B), Hondo Creek (C), Hackberry Creek (D), Elm Creek (E), Cat Creek (F), Calf Creek (G), Mustang Creek (H), Little Yoledigo Creek (I). Display/hide their locations on the map
In group quarters: 1,358 (-1 institutionalized population)
Size of family households: 804 2-persons, 706 3-persons, 352 4-persons, 245 5-persons, 139 6-persons, 37 7-or-more-persons
Size of nonfamily households: 845 1-person
872 married couples with children.
1,330 single-parent households (219 men, 1,111 women).
45.1% of residents of 78061 zip code speak English at home.
53.1% of residents speak Spanish at home (59% very well, 24% well, 8% not well, 9% not at all).
1.5% of residents speak other Indo-European language at home (38% very well, 23% not well, 39% not at all).
0.3% of residents speak Asian or Pacific Island language at home (66% very well, 34% not well).
0.5% of residents speak other language at home (21% very well, 66% not well, 13% not at all).
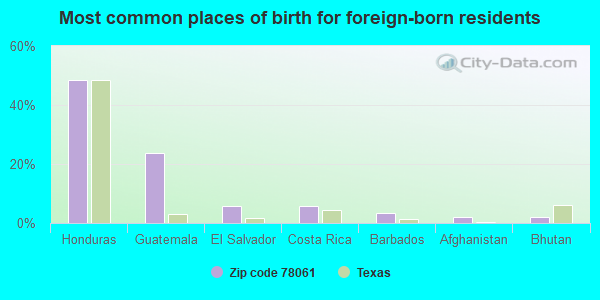
Foreign born population: 1,320 (11.8%) (10.6% of them are naturalized citizens)
This zip code:
11.8%
Whole state:
17.2%
48%Honduras
24%Guatemala
6%El Salvador
6%Costa Rica
3%Barbados
2%Afghanistan
2%Bhutan
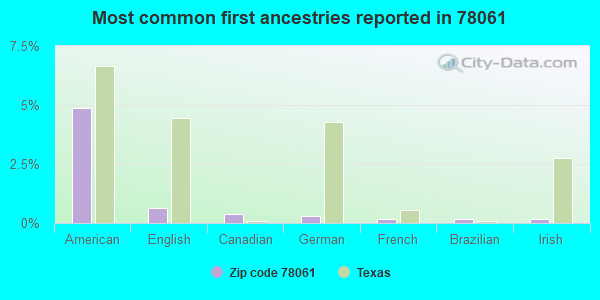
5%American
1%English
0%Canadian
0%German
0%French
0%Brazilian
0%Irish
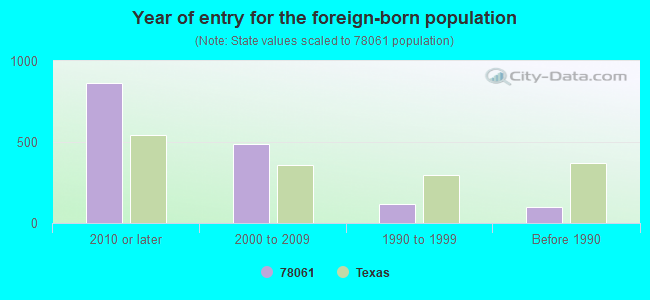
Year of entry for the foreign-born population
8622010 or later
4872000 to 2009
1201990 to 1999
99Before 1990
Facilities with environmental interests located in this zip code:
AEP TEXAS CENTRAL COMPANY (202 W FRIO ST in PEARSALL, TX)
(Resource Conservation and Recovery Act (tracking hazardous waste)) Business NAICS classification: ELECTRIC POWER DISTRIBUTION. Alternative names: CENTRAL PWR & LGHT PEARSALL SVC CTR
Housing units lacking complete plumbing facilities: 7.9% Housing units lacking complete kitchen facilities: 5.2%
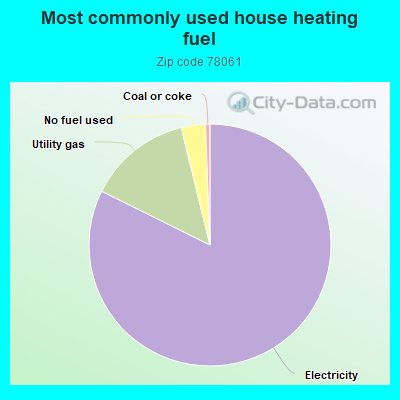
82.1%Electricity
13.8%Utility gas
3.2%No fuel used
0.6%Coal or coke
Population in 1990: 8,981. Population change in the 1990s: +814 (+9.1%).
Place of birth for U.S.-born residents:
This state: 8,920
Northeast: 37
Midwest: 455
South: 107
West: 79
62% of the 78061 zip code residents lived in the same house 5 years ago. Out of people who lived in different houses, 76% lived in this county. Out of people who lived in different counties, 50% lived in Texas.
83% of the 78061 zip code residents lived in the same house 1 year ago. Out of people who lived in different houses, 15% moved from this county. Out of people who lived in different houses, 51% moved from different county within same state. Out of people who lived in different houses, 3% moved from different state. Out of people who lived in different houses, 37% moved from abroad.
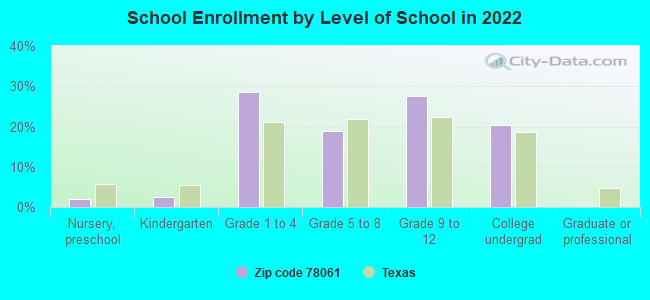
Private vs. public school enrollment:
Students in private schools in grades 1 to 8 (elementary and middle school): 128
Here:
9.7%
Texas:
8.8%
Students in private schools in grades 9 to 12 (high school):
Here:
0.0%
Texas:
8.0%
Students in private undergraduate colleges: 113
Here:
20.1%
Texas:
16.2%
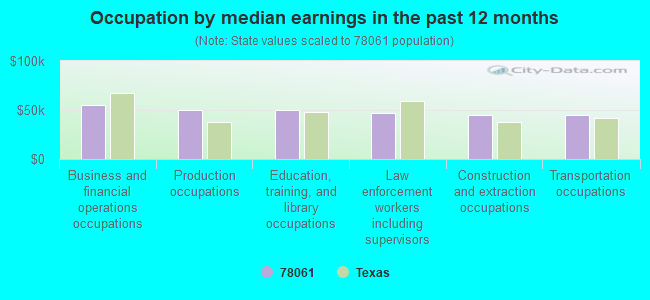
Occupation by median earnings in the past 12 months ($)
55,604Business and financial operations occupations
50,371Production occupations
49,741Education, training, and library occupations
47,332Law enforcement workers including supervisors
44,707Construction and extraction occupations
44,469Transportation occupations
Top industries in this zip code by the number of employees in 2005:
Health Care and Social Assistance: Home Health Care Services (100-249 employees: 1 establishment, 1-4 employees: 2 establishments)
Health Care and Social Assistance: Nursing Care Facilities (50-99: 2)
Administrative and Support and Waste Management and Remediation Services: Facilities Support Services (50-99: 1)
Administrative and Support and Waste Management and Remediation Services: Office Administrative Services (50-99: 1)
Health Care and Social Assistance: General Medical and Surgical Hospitals (50-99: 1)
Mining: Support Activities for Oil and Gas Operations (50-99: 1)
Health Care and Social Assistance: Offices of Physicians (except Mental Health Specialists) (20-49: 1, 5-9: 4, 1-4: 1)
People in group quarters in 2010:
1,519 people in federal detention centers
381 people in local jails and other municipal confinement facilities
93 people in nursing facilities/skilled-nursing facilities
11 people in group homes intended for adults
People in group quarters in 2000:
411 people in local jails and other confinement facilities (including police lockups)
151 people in nursing homes
7 people in homes for the mentally ill
Fatal accident statistics in 2014:
Fatal accident count: 1
Vehicles involved in fatal accidents: 2
Fatal accidents caused by drunken drivers: 0
Fatalities: 1
Persons involved in fatal accidents: 2
Pedestrians involved in fatal accidents: 0
Fatal accident statistics in 2013:
Fatal accident count: 4
Vehicles involved in fatal accidents: 6
Fatal accidents caused by drunken drivers: 0
Fatalities: 4
Persons involved in fatal accidents: 9
Pedestrians involved in fatal accidents: 0
2002 - 2018 National Fire Incident Reporting System (NFIRS) incidents
Based on the data from the years 2002 - 2018 the average number of fire incidents per year is 91. The highest number of fire incidents - 142 took place in 2011, and the least - 50 in 2014. The data has a rising trend.
When looking into fire subcategories, the most reports belonged to: Outside Fires (65.7%), and Mobile Property/Vehicle Fires (17.4%).
Fire incident types reported to NFIRS in Zip Code 78061


 Nearest zip codes: 78017, 78057, 78886, 78005, 78016, 78829.
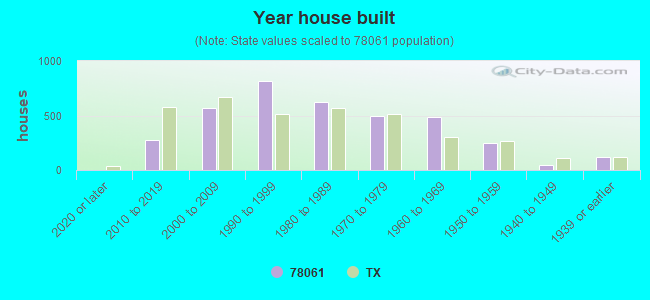


 Based on the data from the years 2002 - 2018 the average number of fire incidents per year is 91. The highest number of fire incidents - 142 took place in 2011, and the least - 50 in 2014. The data has a rising trend.
 When looking into fire subcategories, the most reports belonged to: Outside Fires (65.7%), and Mobile Property/Vehicle Fires (17.4%).