Estimated zip code population in 2022: 53,918 Zip code population in 2010: 34,603 Zip code population in 2000: 23,831
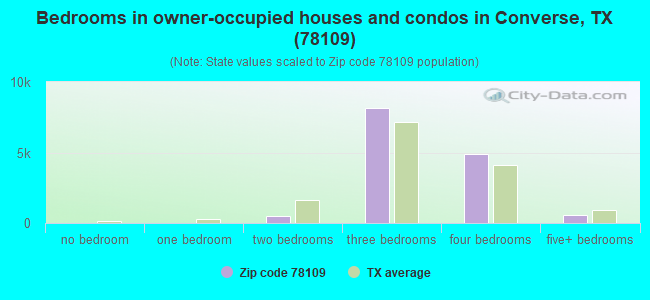
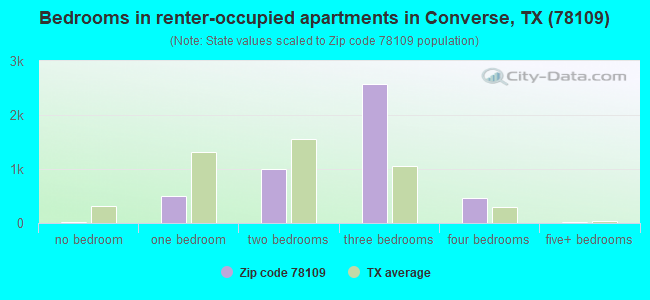
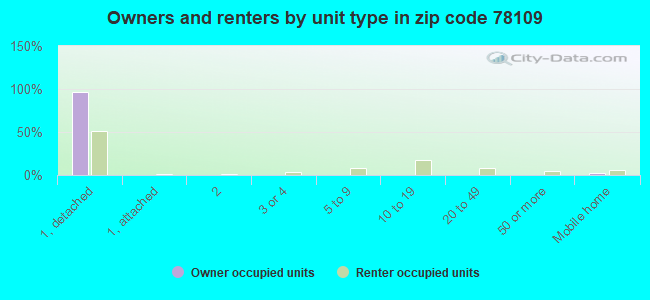
Houses and condos: 18,944 Renter-occupied apartments: 4,641
% of renters here:
25%
State:
38%
March 2022 cost of living index in zip code 78109: 88.0 (less than average, U.S. average is 100)
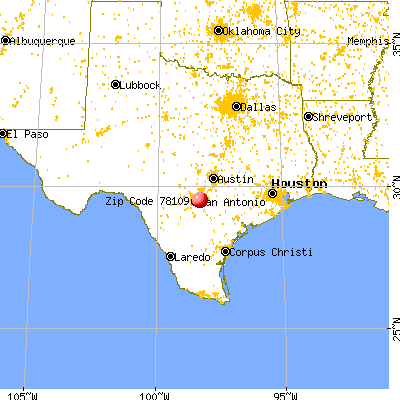
Land area: 20.9 sq. mi. Water area: 0.3 sq. mi.
Population density: 2,579 people per square mile
(average).
OSM Map
General Map
Google Map
MSN Map
OSM Map
General Map
Google Map
MSN Map
OSM Map
General Map
Google Map
MSN Map
OSM Map
General Map
Google Map
MSN Map
Please wait while loading the map...
Real estate property taxes paid for housing units in 2022:
This zip code:
1.7% ($4,235)
Texas:
1.5% ($4,050)
Median real estate property taxes paid for housing units with mortgages in 2022: $4,630 (1.8%) Median real estate property taxes paid for housing units with no mortgage in 2022: $3,642 (1.5%)
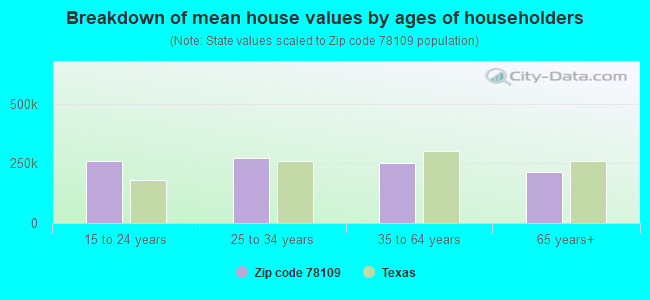
Estimated median house/condo value in 2022: $253,530
78109:
$253,530
Texas:
$275,400
According to our research of Texas and other state lists, there were 81 registered sex offenders living in 78109 zip code as of April 26, 2024. The ratio of all residents to sex offenders in zip code 78109 is 480 to 1. The ratio of registered sex offenders to all residents in this zip code is near the state average.
Median resident age:
This zip code:
33.6 years
Texas median age:
35.6 years
Average household size:
This zip code:
2.9 people
Texas:
2.6 people
Averages for the 2020 tax year for zip code 78109, filed in 2021:
Average Adjusted Gross Income (AGI) in 2020: $49,247 (Individual Income Tax Returns)
Here:
$49,247
State:
$77,054
Salary/wage: $46,093 (reported on 87.8% of returns)
Here:
$46,093
State:
$62,766
(% of AGI for various income ranges: 1159.4% for AGIs below $25k, 3553.5% for AGIs $25k-50k, 6287.8% for AGIs $50k-75k, 9259.4% for AGIs $75k-100k, 16269.6% for AGIs $100k-200k, 56624.0% for AGIs over 200k)
Taxable interest for individuals: $511 (reported on 17.0% of returns)
This zip code:
$511
Texas:
$2,665
(% of AGI for various income ranges: 3.6% for AGIs below $25k, 5.1% for AGIs $25k-50k, 10.2% for AGIs $50k-75k, 18.0% for AGIs $75k-100k, 50.2% for AGIs $100k-200k, 116.0% for AGIs over 200k)
Ordinary dividends: $1,310 (reported on 6.6% of returns)
Here:
$1,310
State:
$10,044
(% of AGI for various income ranges: 2.2% for AGIs below $25k, 3.5% for AGIs $25k-50k, 6.8% for AGIs $50k-75k, 17.1% for AGIs $75k-100k, 55.5% for AGIs $100k-200k, 642.0% for AGIs over 200k)
Net capital gain/loss in AGI: +$4,694 (reported on 6.8% of returns)
Here:
+$4,694
State:
+$39,590
(% of AGI for various income ranges: 2.9% for AGIs below $25k, 7.7% for AGIs $25k-50k, 16.3% for AGIs $50k-75k, 41.0% for AGIs $75k-100k, 153.0% for AGIs $100k-200k, 6994.0% for AGIs over 200k)
Profit/loss from business: +$5,186 (reported on 15.7% of returns)
Here:
+$5,186
State:
+$10,888
(% of AGI for various income ranges: 83.7% for AGIs below $25k, 75.0% for AGIs $25k-50k, 91.2% for AGIs $50k-75k, 118.8% for AGIs $75k-100k, 217.1% for AGIs $100k-200k, 1332.0% for AGIs over 200k)
Taxable individual retirement arrangement distribution: $13,111 (reported on 3.3% of returns)
78109:
$13,111
Texas:
$24,740
(% of AGI for various income ranges: 14.5% for AGIs below $25k, 22.2% for AGIs $25k-50k, 53.3% for AGIs $50k-75k, 88.6% for AGIs $75k-100k, 299.0% for AGIs $100k-200k)
Total itemized deductions: $26,410 (reported on 4.9% of returns)
Here:
$26,410
State:
$40,428
(% of AGI for various income ranges: 22.5% for AGIs below $25k, 95.6% for AGIs $25k-50k, 227.3% for AGIs $50k-75k, 321.2% for AGIs $75k-100k, 554.0% for AGIs $100k-200k, 2280.0% for AGIs over 200k)
Charity contributions: $8,222 (reported on 3.7% of returns)
Here:
$8,222
State:
$18,201
(% of AGI for various income ranges: 2.7% for AGIs below $25k, 15.5% for AGIs $25k-50k, 46.6% for AGIs $50k-75k, 75.5% for AGIs $75k-100k, 167.7% for AGIs $100k-200k, 994.0% for AGIs over 200k)
Taxes paid: $6,311 (reported on 4.7% of returns)
78109:
$6,311
State:
$7,821
(% of AGI for various income ranges: 5.2% for AGIs below $25k, 20.6% for AGIs $25k-50k, 51.1% for AGIs $50k-75k, 78.0% for AGIs $75k-100k, 126.3% for AGIs $100k-200k, 510.0% for AGIs over 200k)
Earned income credit: $2,482 (reported on 21.9% of returns)
Here:
$2,482
State:
$2,584
(% of AGI for various income ranges: 119.5% for AGIs below $25k, 85.4% for AGIs $25k-50k, 1.9% for AGIs $50k-75k)
Percentage of individuals using paid preparers for their 2020 taxes: 93.9%
Here:
94%
State:
92%
(% for various income ranges: 93.4% for AGIs below $25k, 94.4% for AGIs $25k-50k, 94.3% for AGIs $50k-75k, 94.4% for AGIs $75k-100k, 93.5% for AGIs $100k-200k, 88.2% for AGIs over 200k)
Averages for the 2012 tax year for zip code 78109, filed in 2013:
Average Adjusted Gross Income (AGI) in 2012: $42,738 (Individual Income Tax Returns)
Here:
$42,738
State:
$65,384
Salary/wage: $39,577 (reported on 90.8% of returns)
Here:
$39,577
State:
$52,524
(% of AGI for various income ranges: 84.5% for AGIs below $25k, 89.0% for AGIs $25k-50k, 84.5% for AGIs $50k-75k, 84.5% for AGIs $75k-100k, 81.2% for AGIs $100k-200k, 50.2% for AGIs over 200k)
Taxable interest for individuals: $578 (reported on 19.1% of returns)
This zip code:
$578
Texas:
$2,372
(% of AGI for various income ranges: 0.4% for AGIs below $25k, 0.1% for AGIs $25k-50k, 0.4% for AGIs $50k-75k, 0.2% for AGIs $75k-100k, 0.3% for AGIs $100k-200k, 0.2% for AGIs over 200k)
Ordinary dividends: $1,563 (reported on 6.9% of returns)
Here:
$1,563
State:
$9,721
(% of AGI for various income ranges: 0.3% for AGIs below $25k, 0.2% for AGIs $25k-50k, 0.3% for AGIs $50k-75k, 0.2% for AGIs $75k-100k, 0.3% for AGIs $100k-200k, 0.4% for AGIs over 200k)
Net capital gain/loss in AGI: +$3,783 (reported on 4.6% of returns)
Here:
+$3,783
State:
+$35,319
(% of AGI for various income ranges: 0.1% for AGIs $25k-50k, 0.2% for AGIs $50k-75k, 0.1% for AGIs $75k-100k, 0.7% for AGIs $100k-200k, 6.4% for AGIs over 200k)
Profit/loss from business: +$6,657 (reported on 11.9% of returns)
Here:
+$6,657
State:
+$13,732
(% of AGI for various income ranges: 5.8% for AGIs below $25k, 1.5% for AGIs $25k-50k, 1.3% for AGIs $50k-75k, 0.3% for AGIs $75k-100k, 1.5% for AGIs $100k-200k, 5.4% for AGIs over 200k)
Taxable individual retirement arrangement distribution: $10,500 (reported on 4.2% of returns)
78109:
$10,500
Texas:
$19,511
(% of AGI for various income ranges: 1.0% for AGIs below $25k, 0.7% for AGIs $25k-50k, 1.1% for AGIs $50k-75k, 0.9% for AGIs $75k-100k, 1.7% for AGIs $100k-200k)
Total itemized deductions: $16,766 (25% of AGI, reported on 23.1% of returns)
Here:
$16,766
State:
$24,724
Here:
24.7% of AGI
State:
15.9% of AGI
(% of AGI for various income ranges: 5.8% for AGIs below $25k, 8.9% for AGIs $25k-50k, 10.1% for AGIs $50k-75k, 9.4% for AGIs $75k-100k, 9.9% for AGIs $100k-200k, 7.4% for AGIs over 200k)
Charity contributions: $3,696 (reported on 16.7% of returns)
Here:
$3,696
State:
$6,808
(% of AGI for various income ranges: 0.6% for AGIs below $25k, 1.0% for AGIs $25k-50k, 1.4% for AGIs $50k-75k, 1.6% for AGIs $75k-100k, 2.2% for AGIs $100k-200k, 2.9% for AGIs over 200k)
Taxes paid: $4,306 (reported on 22.6% of returns)
78109:
$4,306
State:
$6,921
(% of AGI for various income ranges: 1.2% for AGIs below $25k, 2.1% for AGIs $25k-50k, 2.7% for AGIs $50k-75k, 2.5% for AGIs $75k-100k, 2.6% for AGIs $100k-200k, 1.7% for AGIs over 200k)
Earned income credit: $2,445 (reported on 25.8% of returns)
Here:
$2,445
State:
$2,570
(% of AGI for various income ranges: 8.9% for AGIs below $25k, 1.7% for AGIs $25k-50k)
Percentage of individuals using paid preparers for their 2012 taxes: 34.7%
Here:
35%
State:
51%
(% for various income ranges: 34.2% for AGIs below $25k, 33.8% for AGIs $25k-50k, 34.5% for AGIs $50k-75k, 36.6% for AGIs $75k-100k, 37.7% for AGIs $100k-200k, 71.4% for AGIs over 200k)
Averages for the 2004 tax year for zip code 78109, filed in 2005:
Average Adjusted Gross Income (AGI) in 2004: $37,354 (Individual Income Tax Returns)
Here:
$37,354
State:
$47,881
Salary/wage: $35,073 (reported on 92.2% of returns)
Here:
$35,073
State:
$41,947
(% of AGI for various income ranges: 104.9% for AGIs below $10k, 86.0% for AGIs $10k-25k, 89.2% for AGIs $25k-50k, 87.1% for AGIs $50k-75k, 86.4% for AGIs $75k-100k, 77.8% for AGIs over 100k)
Taxable interest for individuals: $633 (reported on 28.8% of returns)
This zip code:
$633
Texas:
$2,255
(% of AGI for various income ranges: 1.2% for AGIs below $10k, 0.5% for AGIs $10k-25k, 0.5% for AGIs $25k-50k, 0.5% for AGIs $50k-75k, 0.4% for AGIs $75k-100k, 0.5% for AGIs over 100k)
Taxable dividends: $686 (reported on 10.4% of returns)
Here:
$686
State:
$4,261
(% of AGI for various income ranges: 0.6% for AGIs below $10k, 0.1% for AGIs $10k-25k, 0.1% for AGIs $25k-50k, 0.2% for AGIs $50k-75k, 0.1% for AGIs $75k-100k, 0.4% for AGIs over 100k)
Net capital gain/loss: +$2,239 (reported on 7.8% of returns)
Here:
+$2,239
State:
+$16,110
(% of AGI for various income ranges: -0.4% for AGIs below $10k, 0.0% for AGIs $10k-25k, 0.1% for AGIs $25k-50k, 0.2% for AGIs $50k-75k, 0.4% for AGIs $75k-100k, 2.4% for AGIs over 100k)
Profit/loss from business: +$4,319 (reported on 12.3% of returns)
Here:
+$4,319
State:
+$11,013
(% of AGI for various income ranges: 2.8% for AGIs below $10k, 3.9% for AGIs $10k-25k, 1.4% for AGIs $25k-50k, 1.2% for AGIs $50k-75k, 0.5% for AGIs $75k-100k, 0.6% for AGIs over 100k)
IRA payment deduction: $2,179 (reported on 2.1% of returns)
78109:
$2,179
Texas:
$3,120
(% of AGI for various income ranges: 0.1% for AGIs $10k-25k, 0.2% for AGIs $25k-50k, 0.1% for AGIs $50k-75k, 0.1% for AGIs $75k-100k, 0.1% for AGIs over 100k)
Self-employed pension: $2,077 (reported on 0.1% of returns)
Here:
$2,077
Texas:
$16,401
Total itemized deductions: $14,205 (24% of AGI, reported on 27.0% of returns)
Here:
$14,205
State:
$19,631
Here:
24.0% of AGI
State:
18.9% of AGI
(% of AGI for various income ranges: 7.8% for AGIs below $10k, 5.8% for AGIs $10k-25k, 10.4% for AGIs $25k-50k, 11.6% for AGIs $50k-75k, 10.9% for AGIs $75k-100k, 10.5% for AGIs over 100k)
Charity contributions deductions: $2,853 (5% of AGI, reported on 22.2% of returns)
Here:
$2,853
State:
$4,753
Here:
4.6% of AGI
State:
4.2% of AGI
(% of AGI for various income ranges: 0.3% for AGIs below $10k, 0.7% for AGIs $10k-25k, 1.4% for AGIs $25k-50k, 1.8% for AGIs $50k-75k, 2.2% for AGIs $75k-100k, 2.7% for AGIs over 100k)
Total tax: $4,141 (reported on 71.6% of returns)
78109:
$4,141
State:
$9,058
(% of AGI for various income ranges: 2.3% for AGIs below $10k, 3.5% for AGIs $10k-25k, 5.5% for AGIs $25k-50k, 8.0% for AGIs $50k-75k, 10.3% for AGIs $75k-100k, 15.0% for AGIs over 100k)
Earned income credit: $1,863 (reported on 21.9% of returns)
Here:
$1,863
State:
$2,024
Percentage of individuals using paid preparers for their 2004 taxes: 45.7%
Here:
46%
State:
57%
(% for various income ranges: 41.0% for AGIs below $10k, 52.5% for AGIs $10k-25k, 46.0% for AGIs $25k-50k, 44.1% for AGIs $50k-75k, 38.3% for AGIs $75k-100k, 41.8% for AGIs over 100k)
Likely homosexual households (counted as self-reported same-sex unmarried-partner households)
Lesbian couples: 0.1% of all households
Gay men: 0.0% of all households
Household received Food Stamps/SNAP in the past 12 months: 1,961 Household did not receive Food Stamps/SNAP in the past 12 months: 16,826
Women who had a birth in the past 12 months: 751 (492 now married, 257 unmarried) Women who did not have a birth in the past 12 months: 12,724 (5,778 now married, 6,940 unmarried)
Housing units in zip code 78109 with a mortgage: 10,176 (218 second mortgage, 173 both second mortgage and home equity loan) Houses without a mortgage: 77
Median monthly owner costs for units with a mortgage: $1,596 Median monthly owner costs for units without a mortgage: $600
Residents with income below the poverty level in 2022:
This zip code:
11.2%
Whole state:
14.0%
Residents with income below 50% of the poverty level in 2022:
This zip code:
6.7%
Whole state:
7.4%
Median number of rooms in houses and condos:
Here:
6.3
State:
6.3
Median number of rooms in apartments:
Here:
5.0
State:
4.0
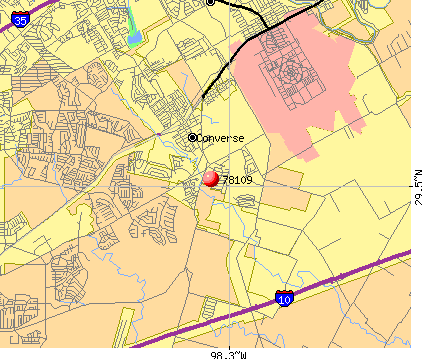
Notable locations in this zip code not listed on our city pages
Notable locations in zip code 78109: Salatrillo Creek Wastewater Treatment Plant (A), Converse Fire Department Station 2 (B), Converse Fire and Emergency Medical Services (C). Display/hide their locations on the map
Churches in zip code 78109 include: Church of Christ Ventura (A), Converse First Baptist Church (B), Agape Fellowship Baptist Church (C), Northeast Hispanic Baptist Church (D), New Life Baptist Church (E), Catholic Church of Converse (F). Display/hide their locations on the map
Reservoirs: Soil Conservation Service Site 4 Reservoir (A), Soil Conservation Service Site 3 Reservoir (B), Soil Conservation Service Site 2 Reservoir (C). Display/hide their locations on the map
Parks in zip code 78109 include: Converse City Park (1), Martinez State Park (2), Randolph Stadium (3), Judson Stadium (4). Display/hide their locations on the map
8,467 married couples with children.
5,254 single-parent households (1,177 men, 4,077 women).
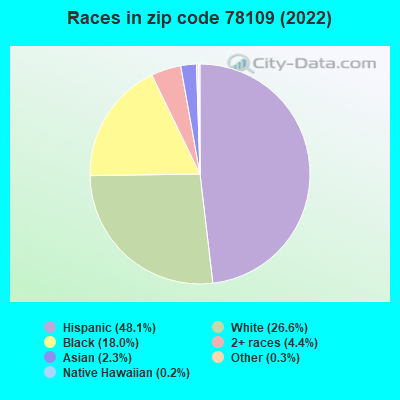
69.0% of residents of 78109 zip code speak English at home.
26.3% of residents speak Spanish at home (76% very well, 15% well, 7% not well, 3% not at all).
1.7% of residents speak other Indo-European language at home (76% very well, 21% well, 2% not well).
2.3% of residents speak Asian or Pacific Island language at home (55% very well, 27% well, 18% not well).
0.6% of residents speak other language at home (67% very well, 15% well, 19% not well).
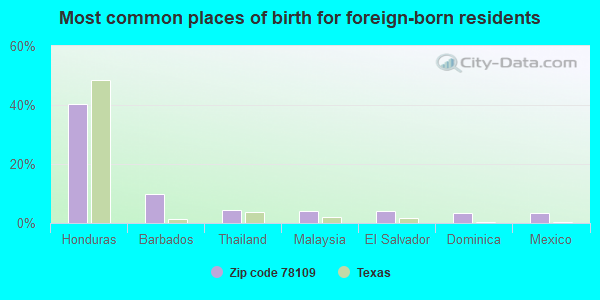
Foreign born population: 5,334 (9.9%) (55.0% of them are naturalized citizens)
This zip code:
9.9%
Whole state:
17.2%
40%Honduras
10%Barbados
4%Thailand
4%Malaysia
4%El Salvador
3%Dominica
3%Mexico
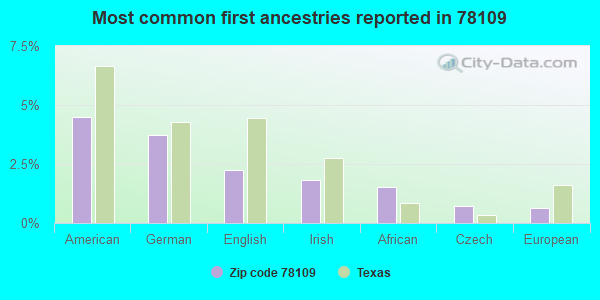
4%American
4%German
2%English
2%Irish
2%African
1%Czech
1%European
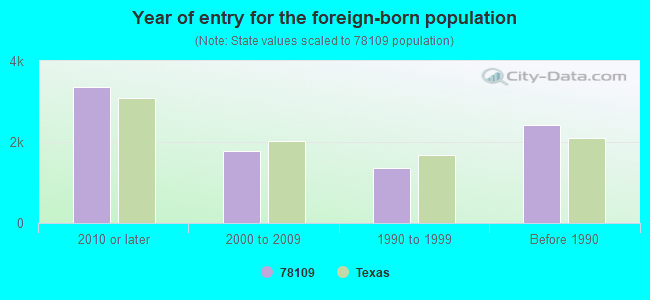
Year of entry for the foreign-born population
3,3522010 or later
1,7812000 to 2009
1,3481990 to 1999
2,432Before 1990
Facilities with environmental interests located in this zip code:
ALAMO PLATING INC (9230 CONVERSE BUSINESS LN STE 4 in CONVERSE, TX)
Small Quantity Generators, between 100 kg and 1000 kg of hazardous waste/month (Resource Conservation and Recovery Act (tracking hazardous waste)) - notification Business NAICS classification: ELECTROPLATING, PLATING, POLISHING, ANODIZING, AND COLORING.
Housing units lacking complete plumbing facilities: 0.5% Housing units lacking complete kitchen facilities: 0.7%
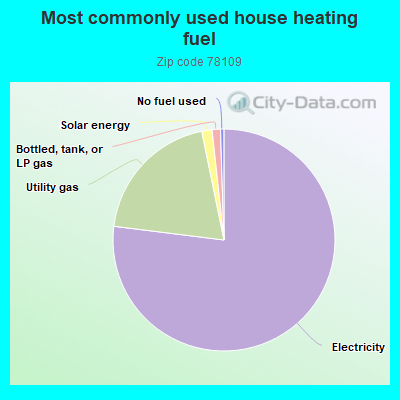
76.9%Electricity
19.8%Utility gas
1.5%Solar energy
1.2%Bottled, tank, or LP gas
0.5%No fuel used
Population in 1990: 13,291. Population change in the 1990s: +10,540 (+79.3%).
Place of birth for U.S.-born residents:
This state: 28,969
Northeast: 2,224
Midwest: 3,561
South: 4,550
West: 5,950
45% of the 78109 zip code residents lived in the same house 5 years ago. Out of people who lived in different houses, 51% lived in this county. Out of people who lived in different counties, 50% lived in Texas.
88% of the 78109 zip code residents lived in the same house 1 year ago. Out of people who lived in different houses, 50% moved from this county. Out of people who lived in different houses, 15% moved from different county within same state. Out of people who lived in different houses, 33% moved from different state. Out of people who lived in different houses, 3% moved from abroad.
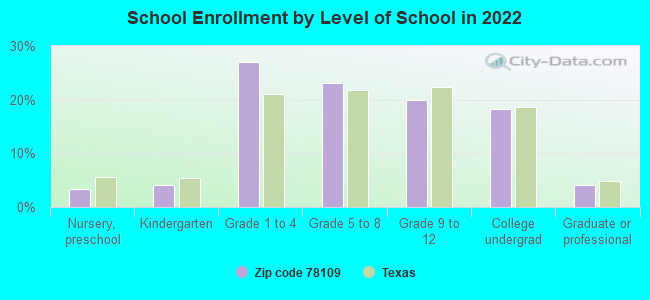
Private vs. public school enrollment:
Students in private schools in grades 1 to 8 (elementary and middle school): 437
Here:
5.6%
Texas:
8.8%
Students in private schools in grades 9 to 12 (high school): 500
Here:
16.1%
Texas:
8.0%
Students in private undergraduate colleges: 625
Here:
22.1%
Texas:
16.2%
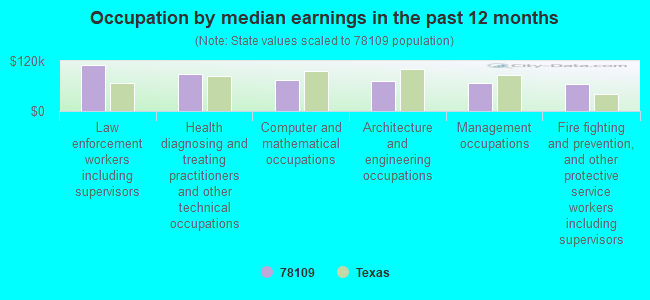
Occupation by median earnings in the past 12 months ($)
110,912Law enforcement workers including supervisors
88,958Health diagnosing and treating practitioners and other technical occupations
74,097Computer and mathematical occupations
73,121Architecture and engineering occupations
67,639Management occupations
63,895Fire fighting and prevention, and other protective service workers including supervisors
Companies with biggest federal contracts located in this zip code (CONVERSE, TX):
ALICE ROOFING & SHEET METAL WO (9092 GREEN RD; small business) : $4,909,233 in 99 contractsfrom 2000 to 2006
Contracts for Maintenance, Repair or Alteration of Real Property -- Family Housing Facilities, Maintenance, Repair or Alteration of Real Property -- Miscellaneous Buildings, Maintenance, Repair or Alteration of Real Property -- Restoration of real property by Army, Air Force Signed by year:2000: $1,820,058; 2001: $0; 2002: $712,050; 2003: $723,187; 2004: $590,967; 2005: $1,061,011; 2006: $1,960.
Biggest contracts:
$926,863 with Army for Maintenance, Repair or Alteration of Real Property -- Family Housing Facilities. Signed on 2000-09-29. Completion date: 2001-09-29.
$643,195, same as above.Signed on 2000-07-18. Completion date: 2000-05-28.
$299,027 with Air Force for Maintenance, Repair or Alteration of Real Property -- Miscellaneous Buildings. Signed on 2005-09-27. Completion date: 2005-12-27.
$299,027, same as above.Signed on 2003-03-20. Completion date: 2003-07-17.
CUSTOM POOLS INC (9144 FM 78; small business) : $620,532 in 4 contractsfrom 2002 to 2005
$499,994 with Air Force for Maintenance, Repair or Alteration of Real Property -- Recreation Facilities (Non-Building). Signed on 2002-09-19. Completion date: 2003-02-25.
$79,192 with Air Force for Plastics Fabricated Materials. Signed on 2003-02-24. Completion date: 2003-03-14.
$34,469 with Army for Miscellaneous Prefabricated Structures. Signed on 2003-08-22. Completion date: 2003-10-31.
$6,877 with Air Force for Recreational Services. Signed on 2005-09-22. Completion date: 2005-10-21.
NYE, RONNIE L (8118 CANTURA MILLS; small business) : $146,127 in 5 contractsfrom 2005 to 2006
Contracts for Veterinary/Animal Care Services by Army Signed by year:2000: $0; 2001: $0; 2002: $0; 2003: $0; 2004: $0; 2005: $152,540; 2006: -$6,413.
Biggest contracts:
$97,240 with Army for Veterinary/Animal Care Services. Signed on 2005-10-07. Completion date: 2005-09-30.
$45,100, same as above.Signed on 2005-03-24. Completion date: 2005-09-30.
$8,550, same as above.Signed on 2005-11-10. Completion date: 2005-09-30.
$1,650, same as above.Signed on 2005-06-13. Completion date: 2005-09-30.
WILLIAM T HENDERSON (8202 COOPERGATE; small business) : $120,000 in 2 contractsfrom 1999 to 2000
$60,000 with Army for Nursing Services. Signed on 2000-11-03. Completion date: 2003-09-30.
$60,000 with Army for Other Medical Services. Signed on 1999-10-14. Completion date: 2000-09-30.
MASTERS, MIKE ENTERPRISES (10219 OUTLAW BEND; small business) : $42,908 in 2 contractsfrom 2004 to 2005
$27,650 with Army for Miscellaneous Construction Materials. Signed on 2004-08-03. Completion date: 2004-07-30.
$15,258, same as above.Signed on 2005-04-29. Completion date: 2005-05-13.
SHIRLEY H MANNING (8232 LONE SHADOW TRL; small business) : $41,730 in 11 contractsfrom 2002 to 2004
Contracts for Other Professional Services, Recreational Services, Preservative and Sealing Compounds, Technical Representation Services -- Musical Instruments, Phonographs, and Home-Type Radios by Army Signed by year:2000: $0; 2001: $0; 2002: $16,920; 2003: $22,810; 2004: $2,000; 2005: $0; 2006: $0.
Biggest contracts:
$10,080 with Army for Other Professional Services. Signed on 2003-11-13. Completion date: 2003-09-30.
$10,080 with Army for Recreational Services. Signed on 2002-12-04. Completion date: 2003-09-30.
$8,960 with Army for Preservative and Sealing Compounds. Signed on 2004-11-10. Completion date: 2005-09-30.
$6,840 with Army for Technical Representation Services -- Musical Instruments, Phonographs, and Home-Type Radios. Signed on 2003-11-14. Completion date: 2004-09-30.
BUCHANAN & SONS MAINTENANCE (7123 APACHE RDG; small business) : $25,440 in 3 contractsfrom 2002 to 2005
$16,350 with Army for Maintenance, Repair or Alteration of Real Property -- Restoration of real property. Signed on 2005-06-02. Completion date: 2005-06-24.
$9,000, same as above.Signed on 2002-01-30. Completion date: 2001-11-30.
$90, same as above.Signed on 2002-02-06. Completion date: 2002-03-06.
CESA EQUIPMENT, INC (9702 IH 10 E; small business) : $23,488 in 4 contractsfrom 2004 to 2006
$11,261 with Air Force for Maintenance, Repair and Rebuilding of Equipment -- Construction, Mining, Excavating, and Highway Maintenance Equipment. Signed on 2005-01-11. Completion date: 2005-03-11.
$6,889, same as above.Signed on 2005-01-11. Completion date: 2005-03-11.
$6,700 with Army for Other Cargo and Freight Services. Signed on 2004-05-12. Completion date: 2004-05-21.
-$1,362 with Air Force for Maintenance, Repair and Rebuilding of Equipment -- Construction, Mining, Excavating, and Highway Maintenance Equipment. Signed on 2006-01-05. Completion date: 2005-03-11.
LUNSFORD, KATJA (10135 VIGILANTE TRAIL; small business) : $22,003 in 3 contractsfrom 2003 to 2004
$16,506 with Army for Relocation Services. Signed on 2003-08-13. Completion date: 2003-11-11.
$5,502, same as above.Signed on 2003-08-12. Completion date: 2003-11-11.
-$5, same as above.Signed on 2004-01-07. Completion date: 2003-11-11.
ROEL PRUDENTE (8015 CHESTNUT CEDAR DRIVE; small business) : $20,360 in 15 contractsfrom 2002 to 2006
Contracts for Recreational Services, Other Professional Services by Army Signed by year:2000: $0; 2001: $0; 2002: $6,840; 2003: $5,080; 2004: $3,360; 2005: $1,270; 2006: $3,810.
Biggest contracts:
$6,840 with Army for Recreational Services. Signed on 2002-11-05. Completion date: 2003-09-30.
$5,080 with Army for Other Professional Services. Signed on 2004-11-02. Completion date: 2005-09-30.
$5,080, same as above.Signed on 2003-11-20. Completion date: 2004-09-30.
$2,117, same as above.Signed on 2006-04-19. Completion date: 2006-09-30.
Top industries in this zip code by the number of employees in 2005:
2002 - 2018 National Fire Incident Reporting System (NFIRS) incidents
According to the data from the years 2002 - 2018 the average number of fire incidents per year is 108. The highest number of fire incidents - 220 took place in 2011, and the least - 52 in 2017. The data has a growing trend.
When looking into fire subcategories, the most incidents belonged to: Outside Fires (47.7%), and Structure Fires (30.3%).
Fire incident types reported to NFIRS in Zip Code 78109


 Nearest zip codes: 78150, 78148, 78244, 78154, 78239, 78233.


 According to the data from the years 2002 - 2018 the average number of fire incidents per year is 108. The highest number of fire incidents - 220 took place in 2011, and the least - 52 in 2017. The data has a growing trend.
 When looking into fire subcategories, the most incidents belonged to: Outside Fires (47.7%), and Structure Fires (30.3%).