According to our research of Texas and other state lists, there was 1 registered sex offender living in 78236 zip code as of April 27, 2024. The ratio of all residents to sex offenders in zip code 78236 is 7,347 to 1. The ratio of registered sex offenders to all residents in this zip code is much lower than the state average.
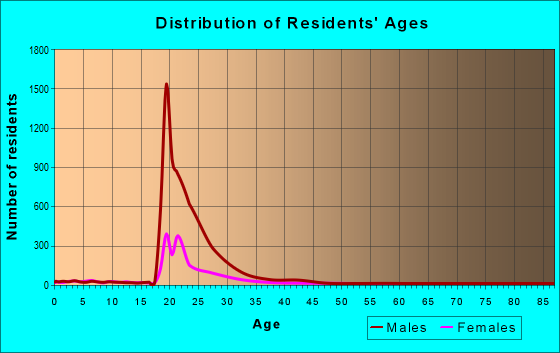
Median resident age:
This zip code:
21.5 years
Texas median age:
35.6 years
Average household size:
This zip code:
4.0 people
Texas:
2.6 people
Averages for the 2020 tax year for zip code 78236, filed in 2021:
Average Adjusted Gross Income (AGI) in 2020: $47,754 (Individual Income Tax Returns)
Here:
$47,754
State:
$77,054
Salary/wage: $45,869 (reported on 99.0% of returns)
Here:
$45,869
State:
$62,766
(% of AGI for various income ranges: 1804.8% for AGIs below $25k, 3744.3% for AGIs $25k-50k, 5895.0% for AGIs $50k-75k, 8438.3% for AGIs $75k-100k, 19672.5% for AGIs $100k-200k)
Taxable interest for individuals: $236 (reported on 13.6% of returns)
This zip code:
$236
Texas:
$2,665
(% of AGI for various income ranges: 0.2% for AGIs below $25k, 0.9% for AGIs $25k-50k, 6.2% for AGIs $50k-75k, 25.0% for AGIs $100k-200k)
Ordinary dividends: $992 (reported on 11.7% of returns)
Here:
$992
State:
$10,044
(% of AGI for various income ranges: 2.6% for AGIs $25k-50k, 5.0% for AGIs $50k-75k, 131.2% for AGIs $100k-200k)
Net capital gain/loss in AGI: +$6,150 (reported on 13.6% of returns)
Here:
+$6,150
State:
+$39,590
(% of AGI for various income ranges: 1.7% for AGIs $25k-50k, 28.1% for AGIs $50k-75k, 1015.0% for AGIs $100k-200k)
Profit/loss from business: +$3,343 (reported on 6.8% of returns)
Here:
+$3,343
State:
+$10,888
(% of AGI for various income ranges: 35.2% for AGIs $25k-50k, 255.0% for AGIs $75k-100k)
Earned income credit: $2,329 (reported on 16.5% of returns)
Here:
$2,329
State:
$2,584
(% of AGI for various income ranges: 23.0% for AGIs below $25k, 128.3% for AGIs $25k-50k)
Percentage of individuals using paid preparers for their 2020 taxes: 97.1%
Here:
97%
State:
92%
(% for various income ranges: 95.6% for AGIs below $25k, 100.0% for AGIs $25k-50k, 94.1% for AGIs $50k-75k, 100.0% for AGIs $75k-100k, 100.0% for AGIs $100k-200k)
Averages for the 2012 tax year for zip code 78236, filed in 2013:
Average Adjusted Gross Income (AGI) in 2012: $33,038 (Individual Income Tax Returns)
Here:
$33,038
State:
$65,384
Salary/wage: $32,508 (reported on 100.0% of returns)
Here:
$32,508
State:
$52,524
(% of AGI for various income ranges: 100.0% for AGIs below $25k, 99.6% for AGIs $25k-50k, 99.2% for AGIs $50k-75k, 97.5% for AGIs $75k-100k, 94.0% for AGIs $100k-200k)
Taxable interest for individuals: $258 (reported on 14.4% of returns)
This zip code:
$258
Texas:
$2,372
(% of AGI for various income ranges: 0.2% for AGIs $50k-75k, 0.2% for AGIs $75k-100k, 0.2% for AGIs $100k-200k)
Ordinary dividends: $850 (reported on 6.1% of returns)
Here:
$850
State:
$9,721
(% of AGI for various income ranges: 0.2% for AGIs $50k-75k, 0.6% for AGIs $100k-200k)
Net capital gain/loss in AGI: +$1,080 (reported on 3.8% of returns)
Here:
+$1,080
State:
+$35,319
Profit/loss from business: +$2,700 (reported on 3.8% of returns)
Here:
+$2,700
State:
+$13,732
Total itemized deductions: $19,214 (22% of AGI, reported on 5.3% of returns)
Here:
$19,214
State:
$24,724
Here:
21.9% of AGI
State:
15.9% of AGI
(% of AGI for various income ranges: 4.3% for AGIs $25k-50k, 6.8% for AGIs $75k-100k, 5.7% for AGIs $100k-200k)
Charity contributions: $4,720 (reported on 3.8% of returns)
Here:
$4,720
State:
$6,808
Taxes paid: $4,229 (reported on 5.3% of returns)
78236:
$4,229
State:
$6,921
(% of AGI for various income ranges: 0.9% for AGIs $25k-50k, 1.6% for AGIs $75k-100k, 1.3% for AGIs $100k-200k)
Earned income credit: $2,217 (reported on 18.2% of returns)
Here:
$2,217
State:
$2,570
(% of AGI for various income ranges: 1.8% for AGIs below $25k, 2.7% for AGIs $25k-50k)
Percentage of individuals using paid preparers for their 2012 taxes: 22.7%
Here:
23%
State:
51%
(% for various income ranges: 20.3% for AGIs below $25k, 24.2% for AGIs $25k-50k, 41.7% for AGIs $50k-75k, 33.3% for AGIs $100k-200k)
Averages for the 2004 tax year for zip code 78236, filed in 2005:
Average Adjusted Gross Income (AGI) in 2004: $22,459 (Individual Income Tax Returns)
Here:
$22,459
State:
$47,881
Salary/wage: $22,287 (reported on 99.5% of returns)
Here:
$22,287
State:
$41,947
(% of AGI for various income ranges: 99.8% for AGIs below $10k, 100.2% for AGIs $10k-25k, 100.3% for AGIs $25k-50k, 96.8% for AGIs $50k-75k, 100.1% for AGIs $75k-100k, 79.9% for AGIs over 100k)
Taxable interest for individuals: $160 (reported on 11.5% of returns)
This zip code:
$160
Texas:
$2,255
(% of AGI for various income ranges: 0.0% for AGIs $10k-25k, 0.1% for AGIs $25k-50k, 0.1% for AGIs $50k-75k, 0.1% for AGIs $75k-100k, 0.8% for AGIs over 100k)
Taxable dividends: $547 (reported on 4.6% of returns)
Here:
$547
State:
$4,261
(% of AGI for various income ranges: 0.0% for AGIs $10k-25k, 0.0% for AGIs $25k-50k, 0.0% for AGIs $50k-75k, 1.6% for AGIs over 100k)
Total itemized deductions: $14,175 (27% of AGI, reported on 2.8% of returns)
Here:
$14,175
State:
$19,631
Here:
27.5% of AGI
State:
18.9% of AGI
Charity contributions deductions: $3,500 (6% of AGI, reported on 2.0% of returns)
Here:
$3,500
State:
$4,753
Here:
6.4% of AGI
State:
4.2% of AGI
Total tax: $1,510 (reported on 76.7% of returns)
78236:
$1,510
State:
$9,058
(% of AGI for various income ranges: 1.0% for AGIs below $10k, 4.6% for AGIs $10k-25k, 3.9% for AGIs $25k-50k, 6.2% for AGIs $50k-75k, 8.3% for AGIs $75k-100k, 14.9% for AGIs over 100k)
Earned income credit: $1,742 (reported on 14.9% of returns)
Here:
$1,742
State:
$2,024
Percentage of individuals using paid preparers for their 2004 taxes: 36.8%
Here:
37%
State:
57%
(% for various income ranges: 39.6% for AGIs below $10k, 34.7% for AGIs $10k-25k, 39.6% for AGIs $25k-50k, 43.3% for AGIs $50k-75k, 81.2% for AGIs $75k-100k)
Household received Food Stamps/SNAP in the past 12 months: 27 Household did not receive Food Stamps/SNAP in the past 12 months: 473
Women who had a birth in the past 12 months: 64 (65 now married, 0 unmarried) Women who did not have a birth in the past 12 months: 2,733 (721 now married, 2,027 unmarried)
Housing units in zip code 78236 with a mortgage: 12 Residents with income below the poverty level in 2022:
This zip code:
7.0%
Whole state:
14.0%
Residents with income below 50% of the poverty level in 2022:
This zip code:
3.1%
Whole state:
7.4%
Median number of rooms in apartments:
Here:
5.5
State:
4.0
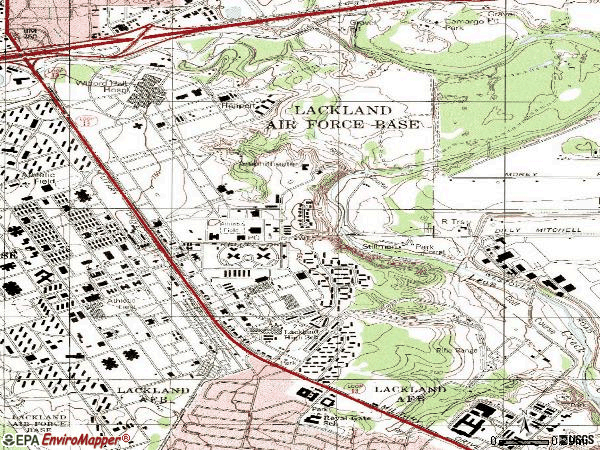
Notable locations in this zip code not listed on our city pages
In group quarters: 6,197 (-1 institutionalized population)
Size of family households: 43 2-persons, 132 3-persons, 189 4-persons, 34 5-persons, 53 6-persons, 8 7-or-more-persons
Size of nonfamily households: 14 1-person, 15 2-persons
787 married couples with children.
86 single-parent households (12 men, 74 women).
87.3% of residents of 78236 zip code speak English at home.
7.7% of residents speak Spanish at home (80% very well, 19% well, 1% not at all).
0.9% of residents speak other Indo-European language at home (77% very well, 14% well, 8% not well).
2.8% of residents speak Asian or Pacific Island language at home (36% very well, 28% well, 36% not well).
0.5% of residents speak other language at home (100% very well).
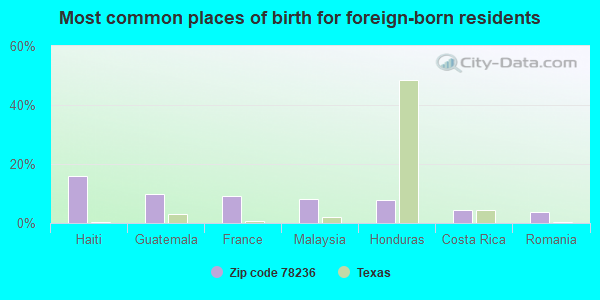
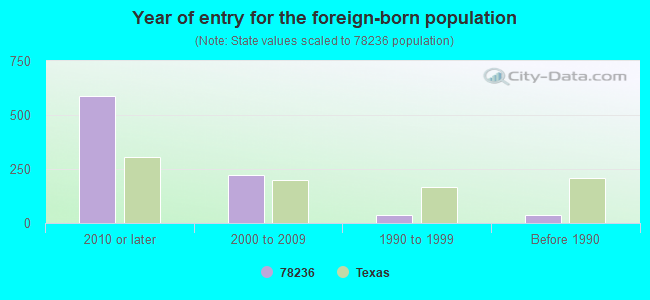
Foreign born population: 444 (5.3%) (79.5% of them are naturalized citizens)
Housing units lacking complete plumbing facilities: 2.9% Housing units lacking complete kitchen facilities: 9.2%
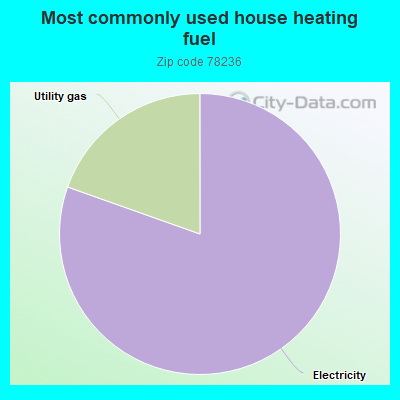
80.6%Electricity
19.6%Utility gas
Population in 1990: 8,707.
Place of birth for U.S.-born residents:
This state: 715
Northeast: 951
Midwest: 1,720
South: 2,275
West: 2,095
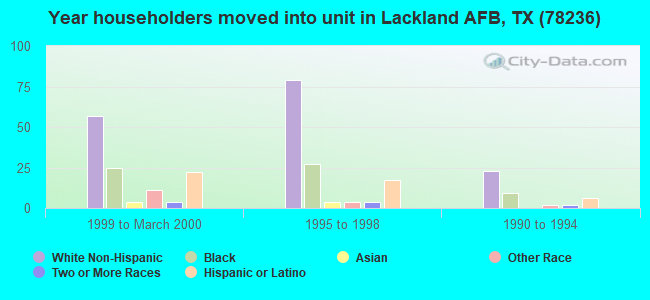
21% of the 78236 zip code residents lived in the same house 5 years ago. Out of people who lived in different houses, 25% lived in this county. Out of people who lived in different counties, 50% lived in Texas.
35% of the 78236 zip code residents lived in the same house 1 year ago. Out of people who lived in different houses, 10% moved from this county. Out of people who lived in different houses, 16% moved from different county within same state. Out of people who lived in different houses, 78% moved from different state. Out of people who lived in different houses, 3% moved from abroad.
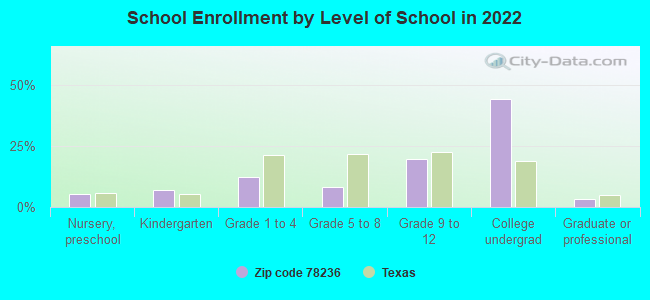
Private vs. public school enrollment:
Students in private schools in grades 1 to 8 (elementary and middle school): 33
Here:
9.4%
Texas:
8.8%
Students in private schools in grades 9 to 12 (high school): 16
Here:
4.8%
Texas:
8.0%
Students in private undergraduate colleges: 335
Here:
43.8%
Texas:
16.2%
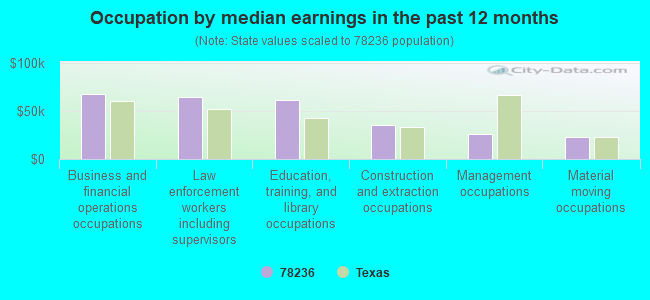
Occupation by median earnings in the past 12 months ($)
67,707Business and financial operations occupations
63,784Law enforcement workers including supervisors
60,664Education, training, and library occupations
35,544Construction and extraction occupations
26,162Management occupations
22,756Material moving occupations
Companies with federal contracts located in this zip code:
HRNCIR,DAVID (2131 PEPPERRELL ST ,BLDG in SAN ANTONIO, TX; small business) : $579,390 in 5 contractsfrom 2004 to 2005
Contracts for Internal Medicine Services by Army Signed by year:2000: $0; 2001: $0; 2002: $0; 2003: $0; 2004: $318,758; 2005: $260,632; 2006: $0.
Biggest contracts:
$244,246 with Army for Internal Medicine Services. Signed on 2005-11-01. Completion date: 2006-09-30.
$207,064, same as above.Signed on 2004-10-24. Completion date: 2005-09-30.
$93,840, same as above.Signed on 2004-04-21. Completion date: 2004-09-30.
$17,854, same as above.Signed on 2004-05-13. Completion date: 2004-09-30.
LACKLAND GATEWAY CLUB (1650 KENLY AVE in SAN ANTONIO, TX) : $16,238 in 3 contractsfrom 2004 to 2006
$9,918 with Air Force for Lease or Rental of Facilities -- Other Administrative Facilities and Service Buildings. Signed on 2005-09-30. Completion date: 2005-10-01.
$3,360 with Air Force for Food Services. Signed on 2004-11-15. Completion date: 2004-11-18.
$2,960 with Air Force for Lease or Rental of Facilities -- Conference Space and Facilities. Signed on 2006-06-23. Completion date: 2006-06-29.
Top industries in this zip code by the number of employees in 2005:
Health Care and Social Assistance: General Medical and Surgical Hospitals (500-999 employees: 1 establishment)
Administrative and Support and Waste Management and Remediation Services: Janitorial Services (250-499: 1)
Other Services (except Public Administration): Drycleaning and Laundry Services (except Coin-Operated) (20-49: 1, 5-9: 5, 1-4: 3)
Administrative and Support and Waste Management and Remediation Services: Security Guards and Patrol Services (50-99: 1)
Health Care and Social Assistance: Vocational Rehabilitation Services (50-99: 1)
Professional, Scientific, and Technical Services: Research and Development in the Physical, Engineering, and Life Sciences (20-49: 1, 10-19: 1, 5-9: 1)
Construction: Electrical Contractors (20-49: 1)
Educational Services: Colleges, Universities, and Professional Schools (20-49: 1)
People in group quarters in 2010:
9,553 people in military barracks and dormitories (nondisciplinary)
People in group quarters in 2000:
252 people in military barracks, etc.
25 people in military transient quarters for temporary residents
4 people in wards in military hospitals for patients who have no usual home elsewhere
3 people in hospitals/wards and hospices for chronically ill
3 people in military hospitals or wards for chronically ill
Fatal accident statistics in 2014:
Fatal accident count: 1
Vehicles involved in fatal accidents: 2
Fatal accidents caused by drunken drivers: 2
Fatalities: 2
Persons involved in fatal accidents: 2
Pedestrians involved in fatal accidents: 0
Fatal accident statistics in 2012:
Fatal accident count: 1
Vehicles involved in fatal accidents: 1
Fatal accidents caused by drunken drivers: 1
Fatalities: 1
Persons involved in fatal accidents: 2
Pedestrians involved in fatal accidents: 0
Home Mortgage Disclosure Act Aggregated Statistics For Year 2008 (Based on 2 partial tracts)
E) Loans on Dwellings For 5+ Families
Number
Average Value
LOANS ORIGINATED
1
$23,653,150
APPLICATIONS APPROVED, NOT ACCEPTED
0
$0
APPLICATIONS DENIED
0
$0
APPLICATIONS WITHDRAWN
0
$0
FILES CLOSED FOR INCOMPLETENESS
0
$0
Aggregated Statistics For Year 2007 (Based on 2 partial tracts)
A) FHA, FSA/RHS & VA Home Purchase Loans
B) Conventional Home Purchase Loans
C) Refinancings
D) Home Improvement Loans
G) Loans On Manufactured Home Dwelling (A B C & D)
Number
Average Value
Number
Average Value
Number
Average Value
Number
Average Value
Number
Average Value
LOANS ORIGINATED
1
$123,400
0
$0
0
$0
0
$0
0
$0
APPLICATIONS APPROVED, NOT ACCEPTED
0
$0
0
$0
0
$0
0
$0
0
$0
APPLICATIONS DENIED
0
$0
3
$143,963
1
$94,230
1
$8,970
1
$68,430
APPLICATIONS WITHDRAWN
0
$0
2
$143,590
0
$0
0
$0
0
$0
FILES CLOSED FOR INCOMPLETENESS
0
$0
0
$0
1
$121,150
0
$0
0
$0
Aggregated Statistics For Year 2006 (Based on 2 partial tracts)
B) Conventional Home Purchase Loans
D) Home Improvement Loans
F) Non-occupant Loans on < 5 Family Dwellings (A B C & D)
G) Loans On Manufactured Home Dwelling (A B C & D)
Number
Average Value
Number
Average Value
Number
Average Value
Number
Average Value
LOANS ORIGINATED
0
$0
0
$0
0
$0
0
$0
APPLICATIONS APPROVED, NOT ACCEPTED
0
$0
0
$0
0
$0
0
$0
APPLICATIONS DENIED
2
$97,035
2
$2,245
1
$2,240
3
$65,440
APPLICATIONS WITHDRAWN
1
$181,730
0
$0
0
$0
0
$0
FILES CLOSED FOR INCOMPLETENESS
0
$0
0
$0
0
$0
0
$0
Aggregated Statistics For Year 2005 (Based on 2 partial tracts)
B) Conventional Home Purchase Loans
C) Refinancings
D) Home Improvement Loans
F) Non-occupant Loans on < 5 Family Dwellings (A B C & D)
G) Loans On Manufactured Home Dwelling (A B C & D)
Number
Average Value
Number
Average Value
Number
Average Value
Number
Average Value
Number
Average Value
LOANS ORIGINATED
0
$0
0
$0
0
$0
0
$0
0
$0
APPLICATIONS APPROVED, NOT ACCEPTED
3
$69,550
0
$0
0
$0
1
$139,100
2
$34,775
APPLICATIONS DENIED
6
$40,758
0
$0
1
$7,850
1
$7,850
6
$40,758
APPLICATIONS WITHDRAWN
2
$151,445
2
$75,720
0
$0
0
$0
0
$0
FILES CLOSED FOR INCOMPLETENESS
2
$84,135
0
$0
0
$0
0
$0
0
$0
Aggregated Statistics For Year 2004 (Based on 2 partial tracts)
A) FHA, FSA/RHS & VA Home Purchase Loans
B) Conventional Home Purchase Loans
C) Refinancings
D) Home Improvement Loans
F) Non-occupant Loans on < 5 Family Dwellings (A B C & D)
G) Loans On Manufactured Home Dwelling (A B C & D)
Number
Average Value
Number
Average Value
Number
Average Value
Number
Average Value
Number
Average Value
Number
Average Value
LOANS ORIGINATED
0
$0
1
$50,480
0
$0
0
$0
0
$0
1
$50,480
APPLICATIONS APPROVED, NOT ACCEPTED
0
$0
1
$48,240
0
$0
0
$0
0
$0
1
$48,240
APPLICATIONS DENIED
1
$94,230
2
$98,720
3
$75,910
1
$17,950
1
$148,080
3
$65,813
APPLICATIONS WITHDRAWN
2
$154,250
2
$120,595
1
$79,650
0
$0
1
$79,650
0
$0
FILES CLOSED FOR INCOMPLETENESS
0
$0
0
$0
0
$0
0
$0
0
$0
0
$0
Aggregated Statistics For Year 2003 (Based on 2 partial tracts)
A) FHA, FSA/RHS & VA Home Purchase Loans
B) Conventional Home Purchase Loans
C) Refinancings
D) Home Improvement Loans
F) Non-occupant Loans on < 5 Family Dwellings (A B C & D)
Number
Average Value
Number
Average Value
Number
Average Value
Number
Average Value
Number
Average Value
LOANS ORIGINATED
1
$136,860
2
$126,205
2
$201,925
0
$0
0
$0
APPLICATIONS APPROVED, NOT ACCEPTED
0
$0
0
$0
1
$23,560
0
$0
0
$0
APPLICATIONS DENIED
1
$164,900
9
$52,101
2
$152,005
3
$13,087
0
$0
APPLICATIONS WITHDRAWN
1
$93,110
2
$108,815
2
$113,865
0
$0
1
$106,570
FILES CLOSED FOR INCOMPLETENESS
0
$0
0
$0
0
$0
0
$0
0
$0
Aggregated Statistics For Year 2002 (Based on 2 partial tracts)
A) FHA, FSA/RHS & VA Home Purchase Loans
B) Conventional Home Purchase Loans
C) Refinancings
D) Home Improvement Loans
Number
Average Value
Number
Average Value
Number
Average Value
Number
Average Value
LOANS ORIGINATED
0
$0
8
$88,902
1
$269,230
0
$0
APPLICATIONS APPROVED, NOT ACCEPTED
0
$0
1
$42,630
0
$0
0
$0
APPLICATIONS DENIED
1
$108,810
3
$114,423
3
$63,193
1
$3,370
APPLICATIONS WITHDRAWN
0
$0
3
$190,707
0
$0
0
$0
FILES CLOSED FOR INCOMPLETENESS
0
$0
0
$0
0
$0
0
$0
Aggregated Statistics For Year 2001 (Based on 2 partial tracts)
B) Conventional Home Purchase Loans
C) Refinancings
Number
Average Value
Number
Average Value
LOANS ORIGINATED
4
$98,718
1
$105,450
APPLICATIONS APPROVED, NOT ACCEPTED
1
$45,990
0
$0
APPLICATIONS DENIED
8
$46,555
1
$30,290
APPLICATIONS WITHDRAWN
1
$107,690
0
$0
FILES CLOSED FOR INCOMPLETENESS
0
$0
1
$111,060
Aggregated Statistics For Year 2000 (Based on 2 partial tracts)
B) Conventional Home Purchase Loans
C) Refinancings
D) Home Improvement Loans
Number
Average Value
Number
Average Value
Number
Average Value
LOANS ORIGINATED
3
$357,480
0
$0
0
$0
APPLICATIONS APPROVED, NOT ACCEPTED
3
$40,760
0
$0
1
$14,580
APPLICATIONS DENIED
4
$37,020
1
$16,830
1
$3,370
APPLICATIONS WITHDRAWN
0
$0
0
$0
0
$0
FILES CLOSED FOR INCOMPLETENESS
1
$114,420
0
$0
0
$0
Aggregated Statistics For Year 1999 (Based on 1 partial tract)


 Nearest zip codes: 78227, 78243, 78242, 78226, 78237, 78211.


 : $579,390 in 5 contracts from 2004 to 2005